引用本文

张羽辰, 曹满湖, 罗曼, 樊祥宇, 黄泰来, 周婷. 等比例回归法评定肉仔鸡对豆油、猪油、磷脂油和混合油能量的利用[J]. 动物营养学报, 2020, 32(12): 5692-5703.

ZHANG Yuchen, CAO Manhu, LUO Man, FAN Xiangyu, HUANG Tailai, ZHOU Ting. Energy Utilization of Soybean Oil, Lard, Phosphatide Oil and Blend Oil for Broiler Chickens Determined Using Equal Proportion Regression Method[J]. Chinese Journal of Animal Nutrition, 2020, 32(12): 5692-5703.
等比例回归法评定肉仔鸡对豆油、猪油、磷脂油和混合油能量的利用
张羽辰1

,
曹满湖1

,
罗曼2
,
樊祥宇1
,
黄泰来1
,
周婷1
1. 湖南农业大学动物科技学院, 长沙 410128;
2. 长沙市雅礼中学国际部, 长沙 410100
收稿日期: 2020-05-25
基金项目: 长沙市科技资助项目(KQ1801018)
摘要: 本试验旨在采用等比例回归法测定肉鸡对豆油、猪油、磷脂油和混合油(豆油:猪油为1:1)的回肠末端消化能(IDE)、代谢能(ME)和氮校正代谢能(MEn)。选用体重(640±1)g、健康的21日龄爱拔益加(AA)肉母鸡576只,随机分为1个对照组和8个试验组,每组8个重复,每个重复8只鸡。对照组饲喂基础饲粮,试验组分别饲喂以豆油、猪油、磷脂油和混合油(豆油:猪油为1:1)替代4%或8%基础饲粮的新饲粮。对照组和各试验组饲粮配方中玉米与豆粕的比例保持不变,均为12.04:7.00;指示剂为二氧化钛(TiO2),添加比例为0.5%。连续收集3 d(25~27日龄)的排泄物,测定干物质、氮、能量的利用率,计算ME和MEn;28日龄时屠宰鸡只,取回肠末端食糜,测定干物质、氮、能量利用率,计算IDE。结果表明:回肠末端食糜和全肠道排泄物中干物质、氮和能量利用率以及IDE、ME和MEn与豆油替代比例存在极显著的线性关系(P < 0.01);回肠末端食糜中干物质和能量利用率以及IDE与猪油替代比例存在极显著的二次曲线关系(P < 0.01),全肠道排泄物中干物质、氮、能量利用率以及ME和MEn与猪油替代比例存在极显著的线性和二次曲线关系(P < 0.01);回肠末端食糜中干物质、氮和能量利用率以及IDE与磷脂油替代比例存在极显著的线性和二次曲线关系(P < 0.01),全肠道排泄物中干物质、氮、能量利用率以及ME和MEn与磷脂油替代比例存在极显著的线性关系(P < 0.01);回肠末端食糜和全肠道排泄物中干物质、氮、能量利用率以及IDE、ME和MEn与混合油替代比例存在极显著的线性和二次曲线关系(P < 0.01)。根据豆油、猪油、磷脂油和混合油替代基础饲粮的比例与新饲粮中由豆油、猪油、磷脂油和混合油所提供的能量的对应关系,得到豆油、猪油、磷脂油和混合油的IDE、ME和MEn的回归方程为:ME=0.14(0.01)+33.66(1.46)豆油替代比例+38.82(1.53)猪油替代比例+39.90(1.52)磷脂油替代比例+50.83(1.83)混合油替代比例,R2=0.951;MEn=0.10(0.01)+32.84(1.27)豆油替代比例+37.58(1.44)猪油替代比例+38.22(1.43)磷脂油替代比例+49.75(1.43)混合油替代比例,R2=0.954;IDE=0.43(0.02)+41.35(3.10)豆油替代比例+41.05(3.25)猪油替代比例+41.87(3.21)磷脂油替代比例+44.23(3.22)混合油替代比例,R2=0.811。根据上述回归方程得出,肉仔鸡对豆油的IDE、ME和MEn分别为41.35、33.66和32.84 MJ/kg DM;对猪油的IDE、ME和MEn分别为41.05、38.82和37.58 MJ/kg DM;对磷脂油的IDE、ME和MEn分别为41.87、39.90和38.22 MJ/kg DM;对混合油的IDE、ME和MEn分别为44.23、50.83和49.75 MJ/kg DM。
关键词:
肉仔鸡 油脂 回肠末端消化能 代谢能 氮校正代谢能
Energy Utilization of Soybean Oil, Lard, Phosphatide Oil and Blend Oil for Broiler Chickens Determined Using Equal Proportion Regression Method
ZHANG Yuchen1
,
CAO Manhu1
,
LUO Man2
,
FAN Xiangyu1
,
HUANG Tailai1
,
ZHOU Ting1
1. College of Animal Science and Technology, Hunan Agricultural University, Changsha 410128, China;
2. International Department of Yali High School, Changsha 410100, China
Abstract: This experiment was conducted to evaluate the ileal digestible energy (IDE), metabolic energy (ME) and nitrogen-corrected metabolizable energy (MEn) of soybean oil, lard, phospholipid oil and mixed oil (soybean oil:lard=1:1) for broiler chickens. A total of 576 female Arbor Acres broiler chickens with the body of (640±1) g and at the age of 21 days were randomly divided into one control group and eight trial groups, and each group had eight replicates with eight birds per replicate. Broiler chickens in the control group were fed a basal diet, while those in trial groups were fed new diets. The new diets were prepared using soybean oil, lard, phosphatide oil and blend oil replaced 4% or 8% basal diet, respectively. The ratio of corn to soybean meal in diets of control group and trial groups was the same, which was 12.04:7.00. Titanium dioxide (TiO2) was used as an indicator added into diets, and the adding level was 0.5%. Excreta was collected on 25, 26 and 27 days of age for measuring the utilization rates of dry matter, nitrogen and energy and calculating the ME and MEn. At the 28 days of age, all birds were slaughtered, and the chyme was collected from the distal ileum for measuring utilization rates of dry matter, nitrogen and energy and calculating the IDE. The results showed that there were extremely significant linear relationships between the soybean oil replacement proportion and the utilization rates of dry matter, nitrogen and energy in chyme from the distal ileum and total intestinal excreta, IDE, ME and MEn (P < 0.01); there were extremely significant quadratic relationships between the lard replacement proportion and the utilization rates of dry matte and energy in chyme from the distal ileum and IDE (P < 0.01), and there were extremely significant linear and quadratic relationships between the lard replacement proportion and the utilization rates of dry matter, nitrogen and energy in total intestinal excreta and ME, MEn (P < 0.01); there were extremely significant linear and quadratic relationships between the phosphatide oil replacement proportion and the utilization rates of dry matter, nitrogen and energy in chyme from the distal ileum and IDE (P < 0.01), and there were extremely significant linear relationships between the phosphatide oil replacement proportion and the utilization rates of dry matter, nitrogen and energy in total intestinal excreta and ME, MEn (P < 0.01); there were extremely significant linear and quadratic relationships between the blend oil replacement proportion and the utilization rates of dry matter, nitrogen and energy in chyme from the distal ileum and total intestinal excreta, IDE, ME and MEn (P < 0.01). Then, according to the proportion of basal diet replacement by correlation between soybean oil, lard, phosphatide oil and blend oil and the energy supplied by soybean oil, lard, phosphatide oil and blend oil in new diets, the regression equations for ME, MEn and IDE of soybean oil, lard, phosphatide oil and blend oil was obtained as follows: ME=0.14(0.01)+33.66(1.46) soybean oil replacement proportion+38.82(1.53) lard replacement proportion+39.90(1.52) phosphatide oil replacement proportion+50.83(1.83) blend oil replacement proportion, R2=0.951; MEn=0.10(0.01)+32.84(1.27) soybean oil replacement proportion+37.58(1.44) lard replacement proportion+38.22(1.43) phosphatide oil replacement proportion+49.75(1.43) blend oil replacement proportion, R2=0.954; IDE=0.43(0.02)+41.35(3.10) soybean oil replacement proportion+41.05(3.25) lard replacement proportion+41.87(3.21) phosphatide oil replacement proportion+44.23(3.22) blend oil replacement proportion, R2=0.811. According to the above regression equation, the IDE, ME and MEn for soybean oil are 41.35, 41.35 and 32.84 MJ/kg DM, respectively; for lard are 41.05, 38.82 and 37.58 MJ/kg DM, respectively; for phosphatide oil are 41.87, 39.90 and 38.22 MJ/kg DM, respectively; and for blend oil are 44.23, 50.83 and 49.75 MJ/kg DM, respectively.
Key words:
broiler chickens oil IDE ME MEn
油脂是肉鸡饲粮的重要能量来源,饲粮中一般添加3%~5%的油脂以满足肉鸡的能量需要。我国目前普遍采用的肉鸡饲料原料数据库是NRC(1994)[1],其在油脂的能量利用方面存在着一些不足和空白,具体表现在:1)部分数据缺乏,如肉鸡对油脂的回肠末端消化能(IDE)、新型油脂磷脂油的能量利用数据、混合油的脂肪额外能量效应等均缺乏;2)较之猪的营养需要[NRC(2012)[2]],鸡的营养需要[NRC(1994)[1]]不仅更新较慢,且缺乏以动态方程对饲养标准的表述;3)研究方法存在局限性,NRC(1994)[1]中肉鸡饲料原料数据库的数据获得多以纯合饲粮法或套算法为研究方法,该方法对动物正常生理伤害较大,且无法考虑被待测原料替代后的新饲粮的营养组成对营养物质利用的影响,研究方法和结果均存在一定局限性[3-4]。以套算法为基础,待测原料以不同梯度替代基础饲粮,且被部分待测原料替代后的新饲粮的能量原料比例保持不变,并通过对新饲粮中被待测原料替代的比例和其提供的能量之间的关系进行拟合,计算待测原料能量利用,这种方法称之为等比例回归法[5-6]。该方法不仅可以使加入待测原料后的新饲粮营养更平衡,而且考虑了新饲粮的营养组成对营养物质利用的影响,并且还可对待测原料替代比例与提供的能量之间的关系进行拟合,较之传统的纯合饲粮法和单独的套算法,更科学、合理,研究结果更准确和更具普遍指导意义,是目前国际上认可度最高的测定单一能量饲料原料的能量利用的方法[7-9]。因此,本试验以套算法为基础,采用等比例回归法评定肉仔鸡对常规油脂类饲料原料(豆油、猪油、混合油)和新型油脂磷脂油等能量饲料原料的IDE、代谢能(ME)和氮校正代谢能(MEn),并建立回归方程,以期为我国肉鸡饲料原料数据库的更新累积数据和提供更具普遍指导意义的动态方程。
1 材料与方法
1.1 试验材料
试验动物购自湖南宁乡某孵化鸡场;豆油和猪油购自成都某油脂有限公司;磷脂油购自郑州某化工产品有限公司;混合油由猪油和豆油以1 : 1混合配制而成。试验所用各种油脂的总能及脂肪酸组成见表 1。
表 1(Table 1)

表 1 豆油、猪油、磷脂油和混合油的总能及脂肪酸组成(干物质基础)
Table 1 GE and fatty acid composition of soybean oil, lard, phosphatide oil and blend oil (DM basis)
| % |
| 项目Items |
豆油Soybean oil |
猪油Lard |
磷脂油Phosphatide oil |
混合油Blend oil |
| 干物质DM |
99.00 |
99.00 |
98.00 |
99.00 |
| 总能GE/(MJ/kg) |
39.74 |
39.66 |
36.16 |
39.70 |
| 肉豆蔻酸C14:0 |
0.07 |
1.46 |
0.07 |
0.76 |
| 十五烷酸C15:0 |
|
0.05 |
|
|
| 棕榈酸C16:0 |
10.50 |
26.80 |
15.40 |
18.90 |
| 棕榈烯酸C16:1 |
0.09 |
1.81 |
0.09 |
0.94 |
| 十七烷酸C17:0 |
0.20 |
0.66 |
0.27 |
0.43 |
| 硬脂酸C18:0 |
4.26 |
17.50 |
4.46 |
11.20 |
| 反油酸C18:1n9t |
|
0.25 |
|
0.13 |
| 油酸C18:1n9c |
20.50 |
35.60 |
14.10 |
27.80 |
| 亚油酸C18:2n6c |
55.20 |
13.00 |
57.10 |
34.00 |
| 花生酸C20:0 |
0.31 |
0.24 |
0.24 |
0.28 |
| 二十碳烯酸C20:1 |
0.40 |
0.77 |
0.11 |
0.57 |
| 亚麻酸C18:3n3 |
8.12 |
0.72 |
7.60 |
4.38 |
| 二十碳二烯酸C20:2 |
|
0.55 |
|
0.29 |
| 二十二烷酸22:0 |
0.30 |
|
0.41 |
0.17 |
| 二十碳三烯酸C20:3n3 |
|
0.09 |
|
|
| 花生四烯酸20:4n6 |
|
0.22 |
|
0.11 |
| 木蜡酸C24:0 |
0.06 |
|
0.14 |
0.04 |
| 饱和脂肪酸SFA |
15.70 |
46.86 |
31.78 |
20.99 |
| 不饱和脂肪酸UFA |
84.31 |
53.01 |
68.22 |
79.00 |
| 不饱和脂肪酸/饱和脂肪酸UFA/SFA |
5.37 |
1.13 |
2.15 |
3.76 |
|
表 1 豆油、猪油、磷脂油和混合油的总能及脂肪酸组成(干物质基础)
Table 1 GE and fatty acid composition of soybean oil, lard, phosphatide oil and blend oil (DM basis)
|
1.2 试验设计与饲养管理
选用1日龄爱拔益加(AA)肉母鸡576只,至21日龄时禁食8 h,使消化道内食糜排空,按照体重进行完全随机分组,分为1个对照组和8个试验组,每组8个重复,每个重复8只鸡。对照组饲喂参照NRC(1994)[1]配制的基础饲粮,试验组分别饲喂由待测油脂(豆油、猪油、磷脂油和混合油)与基础饲粮组成的新饲粮,其中豆油、猪油、磷脂油和混合油替代基础饲粮的比例为4%和8%,且对照组和试验组饲粮中玉米和豆粕的比例均保持为12.04 : 7.00。代谢试验方法为指示剂法,指示剂为二氧化钛(TiO2),添加比例为0.5%。1~21日龄为非试验期,饲喂普通肉仔鸡基础饲粮,其组成及营养水平见表 2;21~28日龄为试验期,饲喂试验饲粮,其组成及营养水平见表 3。收集25~27日龄鸡只的排泄物,待测ME和MEn;28日龄试验结束时,屠宰鸡只,取回肠末端食糜,待测IDE。日常管理参照《商品肉鸡生产技术规程》(GB/T 19664—2005),先饮水后开食,自由采食和饮水。
表 2(Table 2)
表 2 1~21日龄肉仔鸡基础饲粮组成及营养水平(饲喂基础)
Table 2 Composition and nutrient levels of the diet for broilers at 1 to 21 days of age (as-fed basis)
| % |
| 项目Items |
含量Content |
| 原料Ingredients |
| 玉米Corn |
56.00 |
| 豆粕Soybean meal |
35.69 |
| 豆油Soybean oil |
4.00 |
| 石粉Limestone |
1.30 |
| 磷酸氢钙CaHPO4 |
1.90 |
| DL-蛋氨酸DL-Met |
0.20 |
| 赖氨酸Lys |
0.20 |
| 食盐NaCl |
0.30 |
| 氯化胆碱Choline chloride |
0.26 |
| 预混料Premix1) |
0.15 |
| 合计Total |
100.00 |
| 营养水平Nutrient levels2) |
| 代谢能ME/(MJ/kg) |
12.56 |
| 粗蛋白质CP |
21.04 |
| 粗纤维CF |
3.00 |
| 钙Ca |
1.04 |
| 非植酸磷AP |
0.47 |
| 可消化氨基酸Digestible amino acids |
| 精氨酸Arg |
1.35 |
| 组氨酸His |
0.49 |
| 亮氨酸Ile |
0.76 |
| 异亮氨酸Leu |
1.56 |
| 赖氨酸Lys |
1.19 |
| 蛋氨酸Met |
0.49 |
| 半胱氨酸Cys |
0.30 |
| 苯丙氨酸Phe |
0.94 |
| 酪氨酸Tyr |
0.66 |
| 苏氨酸Thr |
0.68 |
| 色氨酸Trp |
0.22 |
| 缬氨酸Val |
0.85 |
1)预混料为每千克饲粮提供The premix provided the following per kg of the diet:VA 135 000 IU,VB1 3.0 mg,VB2 9.0 mg,VB6 3.3 mg,VB12 30 mg,VD3 4 500 IU,VE 21.0 mg,VK3 4.5 mg,D-泛酸D-pantothenic acid 15 mg,烟酸nicotinic acid 10 mg,生物素biotin 0.15mg,叶酸folic acid 1 mg,I (as potassium iodide) 1.1 mg,Mn (as manganese sulfate) 66.1 mg,Cu (as copper sulfate) 4.4 mg,Fe (as ferrous sulfate) 44.1 mg,Zn (as zinc sulfate) 44.1 mg,Se (as sodium selenite) 0.3 mg。表 3同The same as Table 3。
2)代谢能为计算值,其余为实测值。表 3同。ME was a calculated value, while the others were measured values. The same as Table 3. |
|
表 2 1~21日龄肉仔鸡基础饲粮组成及营养水平(饲喂基础)
Table 2 Composition and nutrient levels of the diet for broilers at 1 to 21 days of age (as-fed basis)
|
表 3(Table 3)
表 3 试验饲粮组成及营养水平(风干基础)
Table 3 Composition and nutrient levels of experimental diets (air-dry basis)
| % |
项目
Items |
对照组
Control group |
豆油组
Soybean oil group |
|
猪油组
Lard group |
|
磷脂油组
Phosphatide oil group |
|
混合油组
Blend oil group |
| 4% |
8% |
|
4% |
8% |
|
4% |
8% |
|
4% |
8% |
| 原料Ingredients |
| 玉米Corn |
60.19 |
57.66 |
55.13 |
|
57.66 |
55.13 |
|
57.66 |
55.13 |
|
57.66 |
55.13 |
| 豆粕Soybean meal |
35.00 |
33.53 |
32.06 |
33.53 |
32.06 |
33.53 |
32.06 |
33.53 |
32.06 |
| 豆油Soybean oil |
|
4.00 |
8.00 |
|
|
|
|
|
|
| 猪油Lard oil |
|
|
|
4.00 |
8.00 |
|
|
|
|
| 磷脂油Phosphatide oil |
|
|
|
|
|
4.00 |
8.00 |
|
|
| 混合油Blend oil |
|
|
|
|
|
|
|
4.00 |
8.00 |
| DL-蛋氨酸DL-Met |
0.20 |
0.20 |
0.20 |
0.20 |
0.20 |
0.20 |
0.20 |
0.20 |
0.20 |
| L-赖氨酸L-Lys |
0.20 |
0.20 |
0.20 |
0.20 |
0.20 |
0.20 |
0.20 |
0.20 |
0.20 |
| 石粉Limestone |
1.30 |
1.30 |
1.30 |
1.30 |
1.30 |
1.30 |
1.30 |
1.30 |
1.30 |
| 磷酸氢钙CaHPO4 |
1.90 |
1.90 |
1.90 |
1.90 |
1.90 |
1.90 |
1.90 |
1.90 |
1.90 |
| 食盐NaCl |
0.30 |
0.30 |
0.30 |
0.30 |
0.30 |
0.30 |
0.30 |
0.30 |
0.30 |
| 二氧化钛TiO2 |
0.50 |
0.50 |
0.50 |
0.50 |
0.50 |
0.50 |
0.50 |
0.50 |
0.50 |
| 氯化胆碱Choline chloride |
0.26 |
0.26 |
0.26 |
0.26 |
0.26 |
0.26 |
0.26 |
0.26 |
0.26 |
| 预混料Premix |
0.15 |
0.15 |
0.15 |
0.15 |
0.15 |
0.15 |
0.15 |
0.15 |
0.15 |
| 合计Total |
100.00 |
100.00 |
100.00 |
100.00 |
100.00 |
100.00 |
100.00 |
100.00 |
100.00 |
| 营养水平Nutrient levels |
| 代谢能ME/(MJ/kg) |
11.66 |
12.57 |
13.48 |
|
12.69 |
13.72 |
|
12.73 |
13.81 |
|
12.63 |
13.60 |
| 粗蛋白质CP |
21.10 |
20.23 |
19.36 |
20.23 |
19.36 |
20.23 |
19.36 |
20.23 |
19.36 |
| 粗纤维CF |
3.03 |
2.90 |
2.77 |
2.90 |
2.77 |
2.90 |
2.77 |
2.90 |
2.77 |
| 钙Ca |
1.04 |
1.03 |
1.03 |
1.03 |
1.03 |
1.03 |
1.03 |
1.03 |
1.03 |
| 非植酸磷AP |
0.48 |
0.47 |
0.47 |
0.47 |
0.47 |
0.47 |
0.47 |
0.47 |
0.47 |
| 可消化氨基酸Digestible amino acids |
| 精氨酸Arg |
1.34 |
1.28 |
1.23 |
|
1.28 |
1.23 |
|
1.28 |
1.23 |
|
1.28 |
1.23 |
| 组氨酸His |
0.49 |
0.47 |
0.47 |
0.47 |
0.47 |
0.47 |
0.47 |
0.47 |
0.47 |
| 亮氨酸Ile |
0.76 |
0.73 |
0.69 |
0.73 |
0.69 |
0.73 |
0.69 |
0.73 |
0.69 |
| 异亮氨酸Leu |
1.57 |
1.50 |
1.44 |
1.50 |
1.44 |
1.50 |
1.44 |
1.50 |
1.44 |
| 赖氨酸Lys |
1.18 |
1.14 |
1.10 |
1.14 |
1.10 |
1.14 |
1.10 |
1.14 |
1.10 |
| 蛋氨酸Met |
0.49 |
0.48 |
0.46 |
0.48 |
0.46 |
0.48 |
0.46 |
0.48 |
0.46 |
| 蛋氨酸+半胱氨酸Met+Cys |
0.31 |
0.30 |
0.28 |
0.30 |
0.28 |
0.30 |
0.28 |
0.30 |
0.28 |
| 苯丙氨酸Phe |
0.95 |
0.91 |
0.87 |
0.91 |
0.87 |
0.91 |
0.87 |
0.91 |
0.87 |
| 苯丙氨酸+酪氨酸Phe+Tyr |
0.66 |
0.63 |
0.61 |
0.63 |
0.61 |
0.63 |
0.61 |
0.63 |
0.61 |
| 苏氨酸Thr |
0.68 |
0.65 |
0.62 |
0.65 |
0.62 |
0.65 |
0.62 |
0.65 |
0.62 |
| 色氨酸Try |
0.22 |
0.21 |
0.20 |
0.21 |
0.20 |
0.21 |
0.20 |
0.21 |
0.20 |
| 缬氨酸Val |
0.85 |
0.82 |
0.78 |
0.82 |
0.78 |
0.82 |
0.78 |
0.82 |
0.78 |
|
表 3 试验饲粮组成及营养水平(风干基础)
Table 3 Composition and nutrient levels of experimental diets (air-dry basis)
|
1.3 样品采集与处理
排泄物的收集:收集25~27日龄(3 d)的排泄物,用镊子捡出饲料、皮屑和羽毛等杂物后,于65 ℃烘箱内烘干(风干基础),恒重,粉碎过40目筛,用于样品分析测定。
回肠末端食糜收集:28日龄试验结束前禁食8 h,排空后,称重及记录采食量,然后补喂饲粮,2~3 h后进行屠宰取样,试验动物用二氧化碳(CO2)气体窒息处死,用蒸馏水冲洗回肠末端2/3肠段,收集食糜样品,再置于65 ℃烘箱内烘干(风干基础),恒重,粉碎过40 mm筛,用于样品分析测定。
1.4 指标测定
1.4.1 生长性能
试验期间每天按重复记录采食量,分别于21和28日龄进行试验鸡称重,记录各重复剩余饲粮的重量,以重复为单位统计饲粮耗料量,并计算各组的增重(WG)、采食量(FI)和料重比(F/G)。
1.4.2 干物质、氮含量和总能的测定方法
水分含量按照《饲料中水分的测定》(GB/T 6435—2014)中方法测得,100减去水分含量即为干物质含量;氮含量采用GB/T 6432—2018凯氏定氮法测定;总能采用GR-3500GA型氧弹式热量计测定。
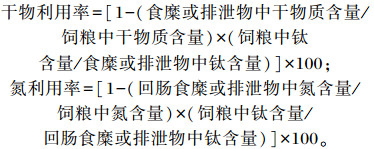
1.4.3 干物质、氮和能量利用率及IDE、ME和MEn的计算
1.4.3.1 干物质、氮利用率的计算
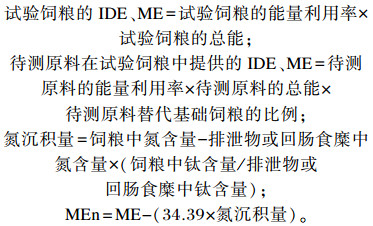
1.4.3.2 基础饲粮能量利用率的计算
1.4.3.3 待测原料能量利用率的计算
由于每组的试验饲粮均由基础饲粮和待测原料这2部分组成,根据能量守衡定律,可得:
1.4.3.4 IDE、ME及MEn的计算
式中:ME的氮校正使用常数为34.39 kJ/g(34.39 kJ/g为肉鸡消耗1 g氮所需要的能量)。
1.5 数据统计与分析
试验数据采用SAS 9.0软件先进行单因素方差分析,通过豆油、猪油、磷脂油和混合油在基础饲粮中的替代比例与其在新饲粮中提供的能值的对应关系,进行线性回归分析,得到豆油、猪油、磷脂油和混合油的IDE、ME及MEn。SAS程序为:Proc GLM;class TI;Model Y=TI*DM intake/Solution;Solution选项用于生成截距和斜率。Y是待测原料提供的IDE、ME和MEn,TI是鸡只从豆油、猪油、磷脂油或混合油中摄入的对应能值(干物质基础)。P < 0.05和P < 0.01分别表示差异显著或极显著。
2 结果与分析
2.1 以豆油、猪油、磷脂油或混合油替代部分基础饲粮对肉仔鸡生长性能的影响
由表 4可知,肉仔鸡的末重和增重与猪油、磷脂油或混合油替代比例间不存在显著的线性关系(P>0.05),而与豆油替代比例存在显著的线性关系(P < 0.05)。
表 4(Table 4)
表 4 以豆油、猪油、磷脂油或混合油替代部分基础饲粮对肉仔鸡生长性能的影响
Table 4 Effects of soybean oil, lard, phosphatide oil or blend oil partially replacing basal diet on growth performance of broiler chickens (n=8)
项目
Items |
对照组
Control group |
豆油组
Soybean oil group |
|
猪油组
Lard group |
|
磷脂油组
Phosphatide oil group |
|
混合油组
Blend oil group |
SEM |
P值P-value |
| 4% |
8% |
|
4% |
8% |
|
4% |
8% |
|
4% |
8% |
L1) |
Q1) |
L2) |
Q2) |
L3) |
Q3) |
L4) |
Q4) |
| 初重IW/g |
642 |
642 |
640 |
|
643 |
641 |
|
641 |
643 |
|
640 |
640 |
0.861 |
0.129 |
0.347 |
0.198 |
0.178 |
0.144 |
0.241 |
0.556 |
0.556 |
| 末重FW/g |
1 045 |
1 058 |
1 075 |
1 058 |
1 054 |
1 057 |
1 056 |
1 042 |
1 050 |
9.022 |
0.033 |
0.853 |
0.787 |
0.438 |
0.625 |
0.555 |
0.536 |
0.645 |
| 增重WG/g |
403 |
416 |
435 |
415 |
414 |
416 |
413 |
402 |
410 |
9.103 |
0.024 |
0.772 |
0.680 |
0.529 |
0.738 |
0.473 |
0.504 |
0.688 |
| 采食量FI/g |
627 |
646 |
631 |
621 |
617 |
610 |
616 |
626 |
617 |
16.289 |
0.813 |
0.408 |
0.743 |
0.978 |
0.913 |
0.565 |
0.643 |
0.842 |
| 料重比F/G |
1.56 |
1.55 |
1.44 |
1.50 |
1.49 |
1.45 |
1.47 |
1.56 |
1.50 |
0.081 |
0.018 |
0.025 |
0.048 |
0.056 |
0.049 |
0.017 |
0.028 |
0.057 |
1)L和Q分别表示各指标与豆油替代比例的线性和二次曲线关系。表 5同。L and Q represented the linear and quadratic relationships between the indexes and soybean oil replacement proportion, respectively. The same as Table 5.
2)L和Q分别表示各指标与猪油替代比例的线性和二次曲线关系。表 5同。L and Q represented the linear and quadratic relationships between the indexes and lard replacement proportion, respectively. The same as Table 5.
3)L和Q分别表示各指标与磷脂油替代比例的线性和二次曲线关系。表 5同。L and Q represented the linear and quadratic relationships between the indexes and phosphatide oil replacement proportion, respectively. The same as Table 5.
4)L和Q分别表示各指标与混合油替代比例的线性和二次曲线关系。表 5同。L and Q represented the linear and quadratic relationships between the indexes and blend oil replacement proportion, respectively. The same as Table 5. |
|
表 4 以豆油、猪油、磷脂油或混合油替代部分基础饲粮对肉仔鸡生长性能的影响
Table 4 Effects of soybean oil, lard, phosphatide oil or blend oil partially replacing basal diet on growth performance of broiler chickens (n=8)
|
表 5(Table 5)
表 5 以豆油、猪油、磷脂油和混合油替代部分基础饲粮对肉仔鸡回肠和全肠道干物质、氮以及能量利用的影响
Table 5 Effects of soybean oil, lard, phosphatide oil or blend oil partially replacing basal diet on DM, nitrogen and energy utilization in ileum and total intestine of broiler chickens
项目
Items |
对照组
Control group |
豆油组
Soybean oil group |
|
猪油组
Lard group |
|
磷脂油组
Phosphatide oil group |
|
混合油组
Blend oil group |
SEM |
P值P-value |
| 4% |
8% |
|
4% |
8% |
|
4% |
8% |
|
4% |
8% |
L1) |
Q1) |
L2) |
Q2) |
L3) |
Q3) |
L4) |
Q4) |
| 回肠末端食糜Chyme from distal ileum |
干物质利用率
DM utilization rate/% |
66 |
72 |
78 |
|
78 |
74 |
|
80 |
77 |
|
75 |
78 |
0.008 |
< 0.001 |
0.894 |
0.027 |
< 0.001 |
< 0.001 |
< 0.001 |
< 0.001 |
0.019 |
氮利用率
Nitrogen utilization rate/% |
82 |
83 |
88 |
89 |
85 |
|
89 |
88 |
|
85 |
86 |
0.006 |
< 0.001 |
0.001 |
0.322 |
< 0.001 |
0.010 |
< 0.001 |
0.001 |
0.162 |
能量利用率
Energy utilization rate/% |
70 |
76 |
82 |
81 |
78 |
|
82 |
81 |
|
78 |
83 |
0.007 |
< 0.001 |
0.596 |
0.001 |
< 0.001 |
< 0.001 |
< 0.001 |
< 0.001 |
0.018 |
回肠末端消化能
IDE/(MJ/kg DM) |
12.48 |
14.27 |
16.09 |
15.44 |
15.38 |
|
15.07 |
15.62 |
|
15.00 |
16.36 |
0.310 |
< 0.001 |
0.933 |
< 0.001 |
< 0.001 |
< 0.001 |
< 0.001 |
< 0.001 |
0.078 |
| 全肠道排泄物Excreta of total intestine |
干物质利用率
DM utilization rate/% |
78 |
78 |
79 |
|
82 |
82 |
|
81 |
85 |
|
86 |
88 |
0.003 |
0.004 |
0.042 |
< 0.001 |
< 0.001 |
< 0.001 |
0.060 |
< 0.001 |
< 0.001 |
氮利用率
Nitrogen utilization rate/% |
76 |
75 |
78 |
81 |
80 |
|
80 |
83 |
|
84 |
85 |
0.006 |
0.002 |
0.005 |
< 0.001 |
0.001 |
< 0.001 |
0.138 |
< 0.001 |
< 0.001 |
能量利用率
Energy utilization rate/% |
80 |
82 |
84 |
85 |
85 |
|
83 |
88 |
|
88 |
90 |
0.003 |
< 0.001 |
0.453 |
< 0.001 |
< 0.001 |
< 0.001 |
0.095 |
< 0.001 |
< 0.001 |
代谢能
ME/(MJ/kg DM) |
14.46 |
15.31 |
16.43 |
16.10 |
16.61 |
|
15.31 |
16.98 |
|
16.63 |
17.93 |
0.660 |
< 0.001 |
0.035 |
< 0.001 |
< 0.001 |
< 0.001 |
< 0.001 |
< 0.001 |
< 0.001 |
氮校正代谢能
MEn/(MJ/kg DM) |
13.58 |
14.49 |
15.56 |
15.17 |
15.74 |
|
14.33 |
16.08 |
|
15.70 |
17.05 |
0.670 |
< 0.001 |
0.202 |
< 0.001 |
< 0.001 |
< 0.001 |
< 0.001 |
< 0.001 |
< 0.001 |
|
表 5 以豆油、猪油、磷脂油和混合油替代部分基础饲粮对肉仔鸡回肠和全肠道干物质、氮以及能量利用的影响
Table 5 Effects of soybean oil, lard, phosphatide oil or blend oil partially replacing basal diet on DM, nitrogen and energy utilization in ileum and total intestine of broiler chickens
|
2.2 以豆油、猪油、磷脂油或混合油替代部分基础饲粮对肉仔鸡回肠和全肠道干物质、氮、能量利用的影响
由表 5可知,回肠末端食糜中干物质、氮和能量利用率以及IDE与豆油替代比例存在极显著的线性关系(P < 0.01);回肠末端食糜中干物质和能量利用率以及IDE与猪油替代比例存在极显著的二次曲线关系(P < 0.01);回肠末端食糜中干物质、氮和能量利用率以及IDE与磷脂油或混合油替代比例存在极显著的线性和二次曲线关系(P < 0.01)。全肠道排泄物中干物质、氮、能量利用率以及ME和MEn与豆油或磷脂油替代比例存在极显著的线性关系(P < 0.01);全肠道排泄物中干物质、氮、能量利用率以及ME和MEn与猪油或混合油替代比例存在极显著的线性和二次曲线关系(P < 0.01)。
2.3 豆油、猪油、磷脂油和混合油ME、MEn、IDE的回归方程
根据豆油、猪油、磷脂油和混合油在基础饲粮中的替代比例与其在新饲粮中提供的能量的对应关系,拟合替代比例与提供能量的关系,得到各油脂的有效能值回归方程,详见表 6,通过回归方程得到:豆油的IDE、ME和MEn分别为41.35、33.66和32.84 MJ/kg DM;猪油的IDE、ME和MEn分别为41.05、38.82和37.58 MJ/kg DM;磷脂油的IDE、ME和MEn分别为41.87、39.90和38.22 MJ/kg DM;混合油的IDE、ME和MEn分别为44.23、50.83和49.75 MJ/kg DM。
表 6(Table 6)
表 6 豆油、猪油、磷脂油和混合油ME、MEn、IDE的回归方程
Table 6 Regression equations for ME, MEn and IDE of soybean oil, lard, phosphatide oil and blend oil
| MJ/kg DM |
项目
Items |
回归方程
Regression equation |
R2 |
标准差
SD |
n |
代谢能
ME |
ME=0.14(0.01)+33.66(1.46)豆油替代比例+38.82(1.53)猪油替代比例+39.90 (1.52)磷脂油替代比例+50.83(1.83)混合油替代比例 |
0.951 |
0.43 |
72 |
氮校正代谢能
MEn |
MEn=0.10(0.01)+32.84(1.27)豆油替代比例+37.58(1.44)猪油替代比例+38.22 (1.43)磷脂油替代比例+49.75(1.43)混合油替代比例 |
0.954 |
0.46 |
72 |
回肠末端消化能
IDE |
IDE=0.43(0.02)+41.35(3.10)豆油替代比例+41.05(3.25)猪油替代比例+41.87 (3.21)磷脂油替代比例+44.23(3.22)混合油替代比例 |
0.811 |
1.25 |
72 |
回归方程中括号中的数值为标准误。
Values in parentheses of regression equations were SE. |
|
表 6 豆油、猪油、磷脂油和混合油ME、MEn、IDE的回归方程
Table 6 Regression equations for ME, MEn and IDE of soybean oil, lard, phosphatide oil and blend oil
|
3 讨论
回归法由于依据不同,又分为等量和等比例回归法。等量回归法即简单以不同梯度待测原料替代基础饲粮来预测营养物质利用回归方程的方法。由于该方法在待测原料替代基础饲粮时不考虑被替代的基础饲粮的原料之间的比例关系,如测定能量利用时,不考虑被替代的基础饲粮配方中玉米、豆粕、油脂间的比例,因而各试验饲粮的玉米、豆粕、油脂的比例关系不一致,导致在拟合回归方程时,基础饲粮对试验饲粮的校正作用的准确性稍差,因而研究结果稍欠准确[1, 5-6]。而等比例回归法则在等量回归法的基础上,约束了基础饲粮和试验饲粮中的供能饲料原料之间的比例关系,如测定能量利用时,供能饲料原料玉米、豆粕、油脂间的比例必须保持一致,这保证了在拟合回归方程时基础饲粮对试验饲粮的校正作用的准确性,即便因对照组与试验组饲粮间营养组分(如蛋白质水平)稍有差异,但这种差异在各组间是等同的,并且可通过计算过程中对照组的作用得以校正,因而,较之等量回归法,等比例回归法所得结果更准确[7-9]。等比例回归法因其试验设计更严谨、合理,是目前国际上认可度较高的研究营养物质利用的方法之一。
本研究通过回归方程得出,肉仔鸡对豆油的IDE、ME和MEn分别为41.35、33.66和32.84 MJ/kg DM,该结果较NRC(1994)[1]中豆油(毛油)的ME(35.02 MJ/kg DM)低1.36 MJ/kg DM,而Fascina等[10]研究得出21日龄肉仔鸡对豆油的ME和MEn分别为39.66和38.79 MJ/kg DM,略高于本试验研究结果。李珂[11]用强饲法评定了肉仔鸡对豆油的ME,所得结果为33.26 MJ/kg DM,与本试验结果相近。
本试验结果显示,肉仔鸡对猪油的IDE、ME和MEn分别是41.05、38.82和37.58 MJ/kg DM,其中,ME略高于NRC(1994)中猪油的ME(38.13 MJ/kg DM),但与王凤红[12]和Turchini等[13]的研究结果相似。王凤红[12]研究表明,动物油脂在肉仔鸡饲粮中的占比超过2%时,饲粮的能量利用率逐步下降。Turchini等[13]也发现,添加10%猪油降低了饲粮干物质的利用率和表观消化能。
磷脂油是豆油加工副产物,其主要成分包括卵磷脂、脑磷脂、肌醇磷脂等多种促进动物生长发育的相关活性物质,不仅可以作为能源物质,也可以作为乳化剂,增强动物对饲粮中脂肪的利用效率[14-15]。NRC(1994)[1]和《中国饲料成分及营养价值表(2019年第30版)》[16]尚均缺乏磷脂油能量利用数据。少数对猪的研究结果显示,磷脂油的表观消化能为31.35 MJ/kg DM,ME为30.10 MJ/kg DM[17-18]。本研究结果显示,肉鸡对磷脂油的IDE、ME和MEn分别为41.88、39.90和38.23 MJ/kg DM。磷脂油在肉仔鸡上的应用研究国内外报道尚不多。少量研究显示,磷脂油的添加可以改善肉鸡的生长状况,增强小肠对营养物质的吸收,改善饲料中营养物质的吸收利用率[19]。
本试验结果显示,肉仔鸡对以豆油:猪油为1 : 1配合而成的混合油的IDE、ME和MEn分别为44.23、50.83和49.75 MJ/kg DM,这3个值分别较混合油的总能高出4.54、11.13和10.05 MJ/kg DM,这主要与混合油的脂肪额外能量效应有关。脂肪额外能量效应是指以油脂替代等能值的碳水化合物和蛋白质后,能使消化过程中能量消耗减少,热增耗降低,饲粮的ME和净能增加,这种效应在植物油和动物油同时添加时更加明显[20]。本试验所用的猪油和豆油以1 : 1比例混合后,可计算出其IDE、ME和MEn的脂肪额外能量效应分别为4.54、11.13和10.05 MJ/kg DM。这与Cao等[9]所得动植物混合油的脂肪额外能量效应结果相似,该研究显示混合油的IDE、ME和MEn的脂肪额外能量效应为2.5~6.4 MJ/kg DM。脂肪额外能量效应受不饱和脂肪酸与饱和脂肪酸的比例、脂肪与碳水化合物之间的相互作用和动物年龄等因素的影响。本试验所用混合油中不饱和脂肪酸与饱和脂肪酸的比例为3.76。研究表明,不饱和脂肪酸与饱和脂肪酸的比例接近4时,可达到脂肪酸的最佳吸收效果[21-22]。混合油中脂肪酸含量的差异也将导致脂肪利用的差异。相比于本试验所用混合油,Cao等[9]试验中所用的混合油的饱和脂肪酸如月桂酸和棕榈酸等的含量更高。此外,饱和脂肪酸的含量会影响油脂的吸收效率,从而影响其有效能值。
本研究结果与NRC(1994)[1]和其他研究结果存在差异的原因可能有:1)各油脂脂肪酸的组成及典型营养特点各不相同。本试验所用4种油脂中,豆油和磷脂油含有较高的亚油酸,猪油的油酸和硬脂酸含量较高,且含有少量反式脂肪酸。豆油的不饱和脂肪酸含量最高,为84.31%,比猪油和磷脂油分别高31.30%和16.09%。总体而言,豆油和猪油总能相近,但脂肪酸组成差异明显。动物油脂的油酸和硬脂酸含量高,饱和脂肪酸含量高;而植物油脂的亚油酸含量高,不饱和脂肪酸含量高。本试验所用豆油的亚油酸含量为55.20%,高于NRC(1994)[1]的相应值(49.8%);猪油的油酸含量为35.60%,低于NRC(1994)[1]的相应值(40.9%),而亚油酸含量为13.00%,高于NRC(1994)[1]的相应值(8.7%)。磷脂油为新型油脂能量饲料原料,其脂肪酸组成尚未有标准可参考,但与2个相关研究[23-24]比较,本试验中所用的磷脂油饱和脂肪酸含量偏高,不饱和脂肪酸含量相对较低。豆油、猪油和混合油的总能均在39.70 MJ/kg DM左右,而磷脂油的总能仅为36.16 MJ/kg DM,其原因可能与磷脂油的提取原料大豆油所含的磷脂较高有关,因磷脂的含量高会降低其总能。4种油脂的脂肪酸的组成及特点各不相同,这可能是导致不同油脂能量利用差异的主要原因。另外,与NRC(1994)[1]中猪油的脂肪酸组成相比,本试验所用猪油的亚油酸含量为13.00%,比NRC(1994)[1]高4.3%。而亚油酸属于多不饱和脂肪酸,相比于单不饱和脂肪酸和饱和脂肪酸更容易被消化利用,这可能是本研究中猪油的ME略高于NRC(1994)[1]的原因之一。2)NRC(1994)[1]中豆油的数据的研究方法以纯合饲粮法和传统套算法为主,这2种方法均以添加待测原料后基础饲粮的能量利用不变为前提,未考虑待测原料替代基础饲粮后饲粮结构和营养组成的变化。而采用油脂替代基础饲粮后,改变了基础饲粮的饲粮结构和营养组成,而饲粮营养组成的变化将导致油脂的能量利用增加或降低;此外,以回归法设计的饲粮的营养平衡性较之纯合饲粮法和传统套算法对动物生理的影响要小很多,因而可以预测其结果更准确,建立的回归方程对生产的指导作用更具普遍性。
4 结论
本试验根据豆油、猪油、磷脂油和混合油替代基础饲粮的比例与新饲粮中由豆油、猪油、磷脂油和混合油所提供的能量的对应关系,拟合线性关系和回归方程,得到豆油、猪油、磷脂油和混合油的IDE、ME和MEn回归方程为:ME=0.14(0.01)+33.66(1.46)豆油替代比例+38.82(1.53)猪油替代比例+39.90(1.52)磷脂油替代比例+50.83(1.83)混合油替代比例,R2=0.951;MEn=0.10(0.01)+32.84(1.27)豆油替代比例+37.58(1.44)猪油替代比例+38.22(1.43)磷脂油替代比例+49.75(1.43)混合油替代比例,R2=0.954;IDE=0.43(0.02)+41.35(3.10)豆油替代比例+41.05(3.25)猪油替代比例+41.87(3.21)磷脂油替代比例+44.23(3.22)混合油替代比例,R2=0.811。根据上述回归方程得出,肉仔鸡对豆油的IDE、ME和MEn分别为41.35、33.66和32.84 MJ/kg DM;对猪油的IDE、ME和MEn分别为41.05、38.82和37.58 MJ/kg DM;对磷脂油的IDE、ME和MEn分别为41.87、39.90和38.22 MJ/kg DM;对混合油的IDE、ME和MEn分别为44.23、50.83和49.75 MJ/kg DM。
致谢:
感谢美国普渡大学(Purdue University)Olayiwola Adeola教授、薛鹏程博士在试验方法上的指导和对文稿所提的宝贵意见。
参考文献
| [1] |
NRC.Nutrient requirements of poultry[S].Washington, D.C.: National Academy Press, 1994.
|
| [2] |
美国国家科学院科学研究委员会.猪营养需要[M].印遇龙, 阳成波, 敖志刚, 译.北京: 科学出版社, 2014.
|
| [3] |
SCHÖNFELD P, WOJTCZAK L. Short- and medium-chain fatty acids in energy metabolism:the cellular perspective[J]. Journal of Lipid Research, 2016, 57(6): 943-954. DOI:10.1194/jlr.R067629 |
| [4] |
SANZ M, FLORES A, LOPEZ-BOTE C J. The metabolic use of energy from dietary fat in broilers is affected by fatty acid saturation[J]. British Poultry Science, 2000, 41(1): 61-68. DOI:10.1080/00071660086411 |
| [5] |
ADEOLA O, ILELEJI K E. Comparison of two diet types in the determination of metabolizable energy content of corn distillers dried grains with solubles for broiler chickens by the regression method[J]. Poultry Science, 2009, 88(3): 579-585. DOI:10.3382/ps.2008-00187 |
| [6] |
ADEOLA O, JENDZA J A, SOUTHERN L L, et al. Contribution of exogenous dietary carbohydrases to the metabolizable energy value of corn distillers grains for broiler chickens[J]. Poultry Science, 2010, 89(9): 1947-1954. DOI:10.3382/ps.2010-00706 |
| [7] |
BOLARINWA O A, DEOLA O. Energy value of wheat, barley and wheat dried distillers' grains with solubles for broiler chickens determined using the regression method[J]. Poultry Science, 2012, 91: 1928-1935. DOI:10.3382/ps.2012-02261 |
| [8] |
BOLARINWA O A, OLUKOSI O A, ADEOLA O. Metabolizable energy value of porcine meat and bone meal for broiler chickens[J]. Canadian Journal of Animal Science, 2012, 92(1): 73-78. DOI:10.4141/cjas2011-103 |
| [9] |
CAO M H, ADEOLA O. Energy value of poultry byproduct meal and animal-vegetable oil blend for broiler chickens by the regression method[J]. Poultry Science, 2016, 95(2): 268-275. DOI:10.3382/ps/pev317 |
| [10] |
FASCINA V B, CARRIJO A S, SOUZA K M R, et al. Soybean oil and beef tallow in starter broiler diets[J]. Revista Brasileira de Ciência Avícola, 2009, 11(4): 249-256. DOI:10.1590/S1516-635X2009000400006 |
| [11] |
李珂, 王晓晓, 万乃宝, 等.肉仔鸡饲用猪油、豆油和鸭油的营养价值评定[C]//中国畜牧兽医学会动物营养学分会第十一次全国动物营养学术研讨会论文集.长沙: 中国畜牧兽医学会动物营养学分会, 2012: 1.
|
| [12] |
王凤红.肉仔鸡饲用油脂营养价值的评定[D].硕士学位论文.北京: 中国农业科学院, 2009.
|
| [13] |
TURCHINI G M, FRANCIS D S. Fatty acid metabolism (desaturation, elongation and β-oxidation) in rainbow trout fed fish oil- or linseed oil-based diets[J]. British Journal of Nutrition, 2009, 102(1): 69-81. DOI:10.1017/S0007114508137874 |
| [14] |
刘伟, 王殿纯, 郭秀云, 等. 油脂的营养价值及其在畜牧业中的应用研究进展[J]. 饲料研究, 2019, 42(11): 104-108. |
| [15] |
陈忠琼, 黎晓敏. 大豆磷脂及大豆磷脂饲料的应用研究[J]. 饲料博览, 2011(5): 16-19. |
| [16] |
中国饲料成分及营养价值表(2019年第30版)[J].中国饲料, 2019(22): 111-116.
|
| [17] |
魏玉强, 李景伟, 毕宇霖, 等. 大豆磷脂理化性质及其在猪饲料中的应用[J]. 畜牧与饲料科学, 2016, 37(5): 16-18. |
| [18] |
KIM B, BANG H T, KIM K H, et al. Evaluation of black soldier fly larvae oil as a dietary fat source in broiler chicken diets[J]. Journal of Animal Science and Technology, 2020, 62(2): 187-197. DOI:10.5187/jast.2020.62.2.187 |
| [19] |
张勇, 李冰, 朱宇旌, 等. 卵磷脂对肉鸡小肠黏膜形态的影响[J]. 黑龙江畜牧兽医, 2009(6): 58-59. |
| [20] |
ZACHUT M, ARIELI A, LEHRER H, et al.Effects of increased supplementation of n-3 fatty acids to transition dairy cows on performance and fatty acid profile in plasma, adipose tissue, and milk fat[J].2010, 93(12): 5877-5889.
|
| [21] |
KETELS E, DE GROOTE G. Effect of ratio of unsaturated to saturated fatty acids of the dietary lipid fraction on utilization and metabolizable energy of added fats in young chicks[J]. Poultry Science, 1989, 68(11): 1506-1512. DOI:10.3382/ps.0681506 |
| [22] |
WISEMAN J. Fats in animal nutrition[M]. London: Butterworths, 1984: 265-275.
|
| [23] |
CRESPO N, ESTEVE-GARCIA E. Dietary polyunsaturated fatty acids decrease fat deposition in separable fat depots but not in the remainder carcass[J]. Poultry Science, 2002, 81(4): 512-518. DOI:10.1093/ps/81.4.512 |
| [24] |
李娟娟.油脂类型和日粮能量及其互作对肉仔鸡脂肪代谢的影响[D].硕士学位论文.北京: 中国农业科学院, 2008: 30-38.
|