2. 甘肃省肉羊繁育生物技术工程实验室, 民勤 733300;
3. 甘肃省农业科学院畜草与绿色农业研究所, 兰州 730070;
4. 景泰县草窝滩镇畜牧兽医站, 白银 730400
2. Engineering Laboratory of Mutton Sheep Breeding and Reproduction Biotechnology, Minqin 733300, China;
3. Institute of Animal & Pasture Science and Green Agriculture of Gansu Academy of Agricultural Science, Lanzhou 730070, China;
4. Animal Husbandry and Veterinary Station of Caowotan Town, Baiyin 730400, China
苜蓿属多年生豆科植物,与其他常用粗饲料相比,苜蓿营养价值较高,是含有高蛋白质、高可消化纤维的优质粗饲料之一[1]。王玲[2]研究表明,饲粮中添加一定量的苜蓿干草能够提高奶牛产奶量,并且在添加6 kg/d时经济效益最高。我国苜蓿种植面积约占全球总面积的15.1%,据统计,2017年我国苜蓿单产量为7 t/hm2,且总产量达2 933.6万t。其中,我国苜蓿种植区域主要集中在西北区域,产量约占全国产量的77.6%[3]。苜蓿干草资源丰富,利用传统的湿化学分析评定其营养价值耗时耗力,并且所用试剂对环境有一定的污染。如何高效合理的利用苜蓿资源是一个亟待解决的问题。
从20世纪90年代开始,近红外光谱(near infrared reflectance spectroscopy,NIRS)技术发展迅速,其具有绿色、便捷、无污染的特点,是快速评定饲料营养价值的方式之一[4]。根据待测物质中不同含氢基团化学键的泛频振动和转动,在近红外区域获得光谱信息,通过化学计量学手段建立光谱与营养成分含量之间的线性和非线性模型,从而实现光谱对待测营养成分含量的快速预测[5-6]。何云等[7]利用近红外光谱技术构建了粉碎苜蓿干草干物质(dry matter,DM)、粗蛋白质(crude protein,CP)、中性洗涤纤维(neutral detergent fiber,NDF)、酸性洗涤纤维(acid detergent fiber,ADF)、粗脂肪(ether extract,EE)和粗灰分(crude ash,Ash)等营养成分含量的近红外预测模型。为进一步探究粒径对苜蓿干草近红外预测模型预测准确性的影响,本研究以切短和粉碎苜蓿干草为研究对象,利用近红外光谱技术结合湿化学分析值分别建立样品常规营养成分含量的近红外预测模型,并且分析这2种处理方式下各营养成分含量预测模型的预测偏差,旨在为快速评定苜蓿干草营养价值提供便捷,也为生产实践中更高效合理地利用苜蓿资源提供理论依据。
1 材料与方法 1.1 样品的采集与制备于2018年10月至2019年10月在甘肃、宁夏、河北、江苏和陕西5个省份和自治区采集不同品种、不同茬次的苜蓿干草样品186份。采集的样品先用铡刀切成3~5 cm,装入采样袋,带回实验室,利用四分法将其分为2部分,一部分封存于真空包装袋用于近红外光谱仪(FOSS-DS2500,丹麦)扫描;另一部分用切割式粉碎机仪(CM100,北京格瑞德曼仪器设备有限公司)粉碎,过1 mm筛,封存于自封袋,用于近红外光谱仪扫描和湿化学分析。
1.2 苜蓿干草营养成分测定苜蓿干草DM和Ash含量分别按照GB/T 6435—2006和GB/T 6438—2007方法使用全自动水分灰分仪(prepASH-340,瑞士)测定[8],CP含量按照GB/T 6432—2018方法使用全自动凯氏定氮仪(FOSS-8400,丹麦)测定[9],NDF和ADF含量按照Van Soest等[10]方法使用全自动纤维仪(Ringbio R-2000,英国)测定,EE含量按照GB/T 6433—2006方法使用全自动脂肪仪(ANKOM XT-15i,美国)测定[11]。
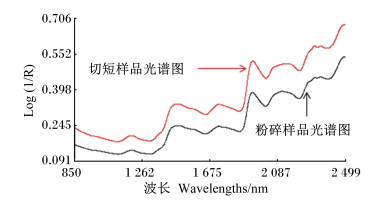
1.3 苜蓿干草近红外分析 1.3.1 苜蓿干草不同处理方式近红外光谱图的采集利用四分法将所采集到的切短为3~5 cm的苜蓿干草样品装入样品杯中(样品杯容积的1/3~2/3)扫描,重复装样扫描3次,取3次得到的平均光谱为该样品的原始光谱。粉碎过1 mm筛的苜蓿干草样品在自封袋中混匀,装入样品杯中(样品杯容积的1/3~2/3)扫描,重复装样扫描3次,取3次扫描得到的平均光谱为该样品的原始光谱。分别取所有切短和粉碎过1 mm筛苜蓿干草样品的平均光谱,如图 1所示,可知在某一特定的波长位置,近红外光对不同处理方式的苜蓿干草样品都有相似的吸收作用,但是吸收强度不同。在横轴上,同一苜蓿干草样品不同营养成分在不同波长处的吸收强度不同,有多处吸收峰,为定量分析各营养成分含量奠定了基础。

|
图 1 切短和粉碎苜蓿干草样品原始光谱图 Fig. 1 Original spectrogram of chopped and crushed alfalfa hay samples |
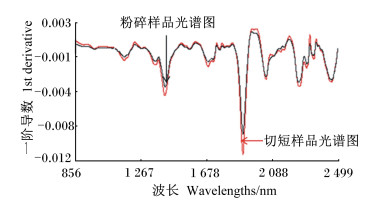
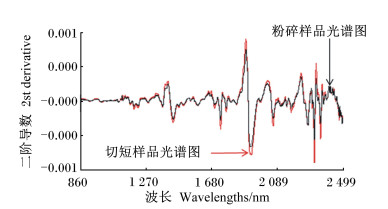
切短和粉碎样品一阶和二阶导数处理光谱图分别如图 2和图 3。由图可知,苜蓿干草样品不同处理方式所得近红外光谱图经一阶和二阶导数处理之后,特征谱峰增多,有消除背景信息和基线漂移等作用。此外,经一阶和二阶导数处理之后,在某一特定波长处切短苜蓿干草样品比粉碎苜蓿干草样品有更高峰值,解析出更多信息。

|
图 2 切短和粉碎苜蓿干草样品一阶导数处理光谱图 Fig. 2 First derivative processing spectrogram of chopped and crushed alfalfa hay samples |

|
图 3 切短和粉碎苜蓿干草样品二阶导数处理光谱图 Fig. 3 Second derivative processing spectrogram of chopped and crushed alfalfa hay samples |
利用WinISI Ⅲ软件对近红外光谱仪所采集到的切短和粉碎苜蓿干草样品的近红外原始光谱图进行处理,分别结合湿化学分析值构建各自的定标模型。各种营养成分在建立定标模型之前,其按照营养成分含量的升序排列,按照4 ∶ 1比例,将样品分为定标集(n=149)和验证集(n=37),利用主成分分析(principal component analysis,PCA)和改良偏最小二乘法(modified partial least squares,MPLS)相结合的方式建立各营养成分预测模型。
在建立模型过程中,使用全局距离(GH)≥3和T值(T)>2.5超常样品为剔除限,剔除超常样品。若GH>3,则表示该样品的偏差大于定标集样品偏差的3倍,进行剔除;若T>2.5,则表示预测结果和湿化学分析值的差大于定标误差的2.5倍,该样品进行剔除或者重新进行湿化学分析。为了消除无关因素的干扰,采用3种导数处理(0, 0, 1, 1、1, 4, 4, 1和2, 4, 4, 1)和7种散射校正相结合对原始光谱进行处理。7种散射校正包括:无处理(none)、标准正态变量变换(standard normal variate,SNV)、去散射(detrend only)、标准正态变量变换和散射处理(standard normal variate and detrend,SNV and detrend)、加权多元散射校正(weighted multiplicative scattering correction,weighted MSC)、标准多元散射校正(standard multiplicative scattering correction,standard MSC)、反向多元散射校正(inverse multiplicative scattering correction,inverse MSC)。然后以最大的交叉验证相关系数(1 minus the variance ration,1-VR)和最小的交叉验证标准误差(standard error of cross validation,SECV)为依据,确定各自最优定标模型。
对于所建立且筛选的各营养成分最优定标模型采用外部验证进一步确定模型的优劣。若预测决定系数(coefficient of determination for validation,RSQ)越接近于1,说明建立的预测模型的预测效果越好;若0<RSQ≤0.25,说明建立的预测模型不可用;若0.26≤RSQ≤0.49,说明建立的预测模型相关性较差;若0.50≤RSQ≤0.64,说明建立的预测模型可以粗略的筛选样品;若0.66≤RSQ≤0.81,说明建立的预测模型可以用于实际生产中的预测;若0.83≤RSQ≤0.90,说明建立的预测模型可以用于一些领域的精确预测;以上可以发现,RSQ的值域中,缺少0.65和0.82这2个值[12]。而外部验证相对分析误差(ratio of performance to deviation for validation,RPD)可更进一步验证该模型的优劣性。RPD在饲料行业范围描述如下:当RPD≥2.5时,说明建立的预测模型可以用于实际分析;当2.0≤RPD≤2.5时,说明建立的预测模型能力较弱,不能替代湿化学分析,但可用于大量样品的筛选分析;当RPD<2.0时,说明建立的预测模型预测效果较差[7, 13]。
1.4 数据统计分析利用Excel 2019统计数据,利用SPSS 25.0进行分析。2种处理方式下各营养成分含量近红外预测模型预测偏差采用独立样本t检验进行分析。分析结果表示方法为“平均值±标准差”。P<0.05为差异显著,P<0.01为差异极显著。
2 结果 2.1 苜蓿干草各营养成分含量湿化学分析由表 1可知,苜蓿干草定标集DM、Ash、CP、NDF、ADF、EE含量分别为88.73%~95.25%、5.88%~17.99%、9.22%~22.04%、33.47%~68.15%、21.64%~55.23%、1.08%~3.74%,平均值分别为92.98%、10.69%、16.11%、48.05%、34.84%、2.43%。苜蓿干草验证集DM、Ash、CP、NDF、ADF、EE含量分别为89.71%~94.79%、6.67%~14.99%、9.92%~24.44%、34.69%~72.65%、23.33%~57.22%、1.33%~3.40%,平均值分别为92.93%、10.55%、16.31%、48.32%、35.11%、2.40%。
|
|
表 1 苜蓿干草定标集和验证集各营养成分含量(干物质基础) Table 1 Nutritional component contents of calibration set and validation set of alfalfa hay (DM basis) |
利用WinISI Ⅲ软件将苜蓿干草6种营养成分湿化学分析值分别与切短、粉碎苜蓿干草近红外光谱数据相结合建立定标模型。以导数处理和去散射处理相结合方式对每种湿化学分析指标独立定标。切短和粉碎苜蓿干草6种营养成分定标最优组合分别见表 2和表 3。由表 2可知,不同营养成分最优光谱处理和导数处理的选择不同,定标之后有不同的1-VR和SECV。切短苜蓿干草DM、Ash、CP、NDF、ADF、EE的光谱处理和导数处理最优组合分别为SNV and detrend和1, 4, 4, 1、standard MSC和2, 4, 4, 1、detrend only和0, 0, 1, 1、SNV和1, 4, 4, 1、detrend only和2, 4, 4, 1、weighted MSC和2, 4, 4, 1。各营养成分定标模型的SECV和1-VR如下:DM为0.583 7和0.752 9,Ash为0.975 1和0.599 0,CP为1.619 8和0.668 8,NDF为3.631 2和0.721 1,ADF为3.051 0和0.758 4,EE为0.425 2和0.183 6。
|
|
表 2 切短苜蓿干草各营养成分最佳定标模型 Table 2 Optimal calibration models for nutrition components of chopped alfalfa hay |
|
|
表 3 粉碎苜蓿干草各营养成分最佳定标模型 Table 3 Optimal calibration models for nutrition components of crushed alfalfa hay |
由表 3可知,粉碎苜蓿干草DM、Ash、CP、NDF、ADF、EE的光谱处理和导数处理最优组合分别为none和1, 4, 4, 1、SNV and detrend和1, 4, 4, 1、weighted MSC和0, 0, 1, 1、weighted MSC和1, 4, 4, 1、detrend only和2, 4, 4, 1、standard MSC和1, 4, 4, 1。各营养成分定标模型的SECV和1-VR如下:DM为0.290 2和0.932 2,Ash为0.683 3和0.817 4,CP为1.230 8和0.807 9,NDF为2.152 7和0.902 6,ADF为1.592 9和0.934 7,EE为0.349 0和0.390 7。
2.3 切短和粉碎苜蓿干草各营养成分最优定标模型的验证切短和粉碎苜蓿干草各营养成分定标模型建立之后,需要用验证集样品对利用最优组合建立的定标模型进行验证。切短和粉碎苜蓿干草各营养成分外部验证结果见表 4和表 5。由表 4可知,切短苜蓿干草NDF最优定标模型RSQ和RPD分别为0.86和2.63,建立的定标模型可用于精确预测;DM、ADF最优定标模型RSQ和RPD分别为0.67和1.61、0.75和1.99,建立的定标模型可用于实际生产中的预测;Ash、CP最优定标模型RSQ和RPD分别为0.61和1.48、0.64和1.65,建立的定标模型只能粗略的筛选样品,不能用于实际生产中的预测;EE最优定标模型RSQ和RPD分别为0.13和1.07,定标模型不可用。
|
|
表 4 切短苜蓿干草各营养成分最佳定标模型外部验证结果 Table 4 External validation results of optimal calibration model for nutrition components of chopped alfalfa hay results |
|
|
表 5 粉碎苜蓿干草各营养成分最佳定标模型外部验证结果 Table 5 External validation results of optimal calibration model for nutrition components of crushed alfalfa hay results |
由表 5可知,粉碎苜蓿干草DM、NDF、ADF最优定标模型RSQ都高于0.83,且RPD高于2.50,建立的定标模型可用于精确预测;Ash最优定标模型RSQ高于0.66,且RPD高于2.00,建立的定标模型可用于实际生产中的预测;CP和EE最优定标模型RSQ高都于0.50,但RPD低于2.00,建立的定标模型只能粗略的筛选样品,不能用于实际生产中的预测。
由表 6可知,切短苜蓿干草和粉碎苜蓿干草的CP、NDF、ADF、EE、DM和Ash定标模型的预测偏差无显著差异(P>0.05)。
|
|
表 6 苜蓿干草不同处理方式近红外定标模型预测偏差分析 Table 6 Analysis of prediction deviation of near infrared calibration model for different treatment methods of alfalfa hay |
近红外光谱技术在分子水平上为饲料原料提供了光谱数据,可预测待测物的营养成分含量[14]。Norris等[15]建立的饲草常规营养成分近红外预测模型可预测其各营养成分含量,证实了利用近红外光谱技术可以快速有效地评定饲草营养价值的可行性。自此,近红外光谱技术在饲料营养价值评定领域得到广泛的应用。迄今为止,已广泛的用于预测饲料原料营养成分分析[16-20]、全混合日粮营养成分分析[21]、天然牧场新鲜饲草营养成分分析[22]和粪样的分析[23-25]等各个领域。Pérez-Vich等[26]以葵花籽、去壳葵花仁、葵花籽粉和葵花油为研究对象,测定了其脂肪含量和脂肪酸组成,利用近红外光谱技术建立不同处理方式预测模型,结果表明葵花籽的相关系数较低(0.76~0.85),去壳葵花仁、葵花籽粉和葵花油的相关系数相差不大,并且认为利用葵花籽测定可以最大限度的获得较高的准确性[27]。
样品散射系数与样品粒径有关,粒径越大,其散射系数越小。根据Kubellka-Munk函数,散射系数越小,吸光度越大,得到的样品的光谱会上移,因此得到的切短苜蓿干草的光谱会上移[28]。虽然同一样品不同粒径对近红外光的吸收不同,但是分别经过一阶导数和二阶导数处理之后,消除了苜蓿干草样品对近红外光有不同吸收程度的影响。切短和粉碎苜蓿干草的DM和Ash预测模型预测偏差无显著差异,但预测模型RSQ和RPD都低于粉碎苜蓿干草,且预测偏差都高于粉碎苜蓿干草近红外预测模型,因此利用近红外光谱技术可直接预测切短苜蓿干草的DM和Ash含量,但预测准确性低于粉碎苜蓿干草。切短苜蓿干草较粉碎苜蓿干草的CP、NDF、ADF和EE预测模型预测偏差无显著差异,与唐开婷[29]研究结果相同。粉碎苜蓿干草的CP、NDF和ADF预测模型预测准确性优于唐开婷[29]研究结果,而切短苜蓿干草的CP、NDF和ADF预测模型预测准确性低于唐开婷[29]研究结果,原因可能为近红外光对不同粒径的苜蓿干草的穿透能力和反射能力不同,粒径的变化致使近红外光在样品内部传播的光程发生变化,影响苜蓿干草对近红外光的吸收和散射[28]。
粉碎苜蓿干草的CP、NDF和ADF预测模型预测准确性优于切短碎苜蓿干草,原因可能为苜蓿干草中叶片所含蛋白质含量较茎秆高,约占粗蛋白质总含量的70%左右;茎秆所含中性洗涤纤维和酸性洗涤纤维含量较叶片高;将切短样品装入样品杯之后,叶片易在样品杯底部,而粉碎苜蓿干草茎叶经粉碎之后样品混合均匀,有利于样品对近红外光的吸收。粉碎和切短2种处理方式各自的EE预测模型的预测值与湿化学分析值的相关性都较差,与刘哲[30]研究结果一致。但粉碎苜蓿干草的EE预测模型RSQ高于切短苜蓿干草,可能的原因一方面为粉碎比切短处理样品混合更为均匀,对于近红外光对样品的漫反射影响较小,光谱能采集到的更多的数据信息;另一方面,本研究所用的湿化学分析样品为粉碎过1 mm筛,在利用4分法分切短至3~5 cm样品时,有一定的误差。建立近红外预测模型预测饲草营养成分含量不是一个简单的过程,而是需要不断地更新和优化[31]。
4 结论① 利用近红外光谱技术建立的切短苜蓿干草NDF预测模型可用于精确预测,DM和ADF预测模型可用于实际生产中的预测,Ash和CP预测模型只能用于粗略的筛选分析,EE预测模型不可用。
② 利用近红外光谱技术建立的粉碎苜蓿干草DM、NDF和ADF预测模型可用于精确预测,Ash预测模型可用于实际生产中的预测,CP和EE预测模型只能用于粗略的筛选分析。
③ 利用近红外光谱技术建立的切短苜蓿干草营养成分预测模型的预测偏差与粉碎苜蓿干草无显著差异,但RSQ和RPD低于粉碎苜蓿干草,说明切短苜蓿干草营养成分定标模型预测分析准确性低于粉碎苜蓿干草。
| [1] |
李洋, 蓝雅雪, 车利, 等. 非常规饲料替代苜蓿干草的研究进展及可行性分析[J]. 动物营养学报, 2020, 32(9): 3970-3978. LI Y, LAN Y X, CHE L, et al. Research progress and feasibility analysis of replacing alfalfa hay with unconventional feeds[J]. Chinese Journal of Animal Nutrition, 2020, 32(9): 3970-3978 (in Chinese). |
| [2] |
王玲. 苜蓿不同喂量对奶牛产奶量及品质的影响研究[J]. 中国牛业科学, 2018, 44(3): 20-23. WANG L. Effects of different feeding amount of alfalfa on milk yield and the quality of cows[J]. China Cattle Science, 2018, 44(3): 20-23 (in Chinese). DOI:10.3969/j.issn.1001-9111.2018.03.005 |
| [3] |
陶莎, 王玉庭, 张峭. 国内苜蓿草供需现状及中美贸易摩擦带来的影响与对策[J]. 畜牧与饲料科学, 2019, 40(10): 46-50. TAO S, WANG Y T, ZHANG Q. Situation of domestic alfalfa market and the impact from sino-us trade frictions and its countermeasures[J]. Animal Husbandry and Feed Science, 2019, 40(10): 46-50 (in Chinese). DOI:10.12160/j.issn.1672-5190.2019.10.009 |
| [4] |
STARR C, SUTTLE J, MORGAN A G, et al. A comparison of sample preparation and calibration techniques for the estimation of nitrogen, oil and glucosinolate content of rapeseed by near infrared spectroscopy[J]. The Journal of Agricultural Science, 1985, 104(2): 317-323. DOI:10.1017/S0021859600043987 |
| [5] |
徐广通, 袁洪福, 陆婉珍. 现代近红外光谱技术及应用进展[J]. 光谱学与光谱分析, 2000, 20(2): 134-142. XU G T, YUAN H F, LU W Z. Development of modern near infrared spectroscopic techniques and its applications[J]. Spectroscopy and Spectral Analysis, 2000, 20(2): 134-142 (in Chinese). DOI:10.3321/j.issn:1000-0593.2000.02.003 |
| [6] |
郭涛, 黄右琴, 兰贵生, 等. 利用近红外光谱技术分析玉米秸秆和小麦秸秆的营养成分[J]. 草业科学, 2020, 37(6): 1204-1213. GUO T, HUANG Y Q, LAN G S, et al. Quantitative analysis of nutrients in corn straw and wheat straw using near-infrared spectroscopy[J]. Pratacultural Science, 2020, 37(6): 1204-1213 (in Chinese). |
| [7] |
何云, 张亮, 武小姣, 等. 苜蓿干草常规营养成分含量近红外预测模型的建立[J]. 动物营养学报, 2019, 31(10): 4684-4690. HE Y, ZHANG L, WU X J, et al. Near infrared prediction model establishment for routine nutritional component contents of alfalfa hay[J]. Chinese Journal of Animal Nutrition, 2019, 31(10): 4684-4690 (in Chinese). |
| [8] |
天美(中国)科学仪器有限公司. 谷物中水分、灰分的全新测定方法——瑞士Precisa全自动水分灰分分析仪应用实例[J]. 食品安全导刊, 2013(13): 37-38. PRECISA. A new method for determining moisture and ash in grains: application example of Swiss Precisa automatic moisture and ash analyzer[J]. China Food Safety, 2013(13): 37-38 (in Chinese). |
| [9] |
国家市场监督管理总局, 国家标准化管理委员会. GB/T 6432—2018饲料中粗蛋白的测定凯氏定氮法[S]. 北京: 中国标准出版社, 2018. National Feed Industry Standardization Technical Committee. GB/T 6432—2018 Determination of crude protein in feeds-Kjeldahl method[S]. Beijing: Standards Press of China, 2018. (in Chinese) |
| [10] |
VAN SOEST P J, ROBERTSON J B, LEWIS B A. Methods for dietary fiber, neutral detergent fiber, and nonstarch polysaccharides in relation to animal Nutrition[J]. Journal of Dairy Science, 1991, 74(10): 3583-3597. DOI:10.3168/jds.S0022-0302(91)78551-2 |
| [11] |
中华人民共和国国家质量监督检验检疫总局, 中国国家标准化管理委员会. GB/T 6433—2006饲料中粗脂肪的测定[S]. 北京: 中国标准出版社, 2006. National Feed Industry Standardization Technical Committee. GB/T 6433—2006 Determination of crude fat in feeds[S]. Beijing: Standards Press of China, 2006. (in Chinese) |
| [12] |
KOVALENKO I V, RIPPKE G R, HURBURGH C R. Determination of amino acid composition of soybeans (Glycine max) by near-infrared spectroscopy[J]. Journal of Agricultural and Food Chemistry, 2006, 54(10): 3485-3491. DOI:10.1021/jf052570u |
| [13] |
李军涛. 近红外反射光谱快速评定玉米和小麦营养价值的研究[D]. 博士学位论文. 北京: 中国农业大学, 2014. LI J T. Study on the rapid evaluation of nutrient values of corn and wheat by near-infrared reflectance spectroscopy[D]. Ph. D. Thesis. Beijing: China Agricultural University, 2014. (in Chinese) |
| [14] |
李敬, CRIADO A, 席鹏彬. 重新审视饲料生产过程中蛋白质原料的评价方法[J]. 饲料工业, 2018, 39(16): 58-60. LI J, CRIADO A, XI P B. Review the evaluation method of protein-rich feedstuffs in feed processing[J]. Feed Industry, 2018, 39(16): 58-60 (in Chinese). |
| [15] |
NORRIS K H, BARNES R F, MOORE J E, et al. Predicting forage quality by infrared replectance spectroscopy[J]. Journal of Animal Science, 1976, 43(4): 889-897. DOI:10.2527/jas1976.434889x |
| [16] |
郝勇, 吴文辉, 商庆园. 饲料中粗脂肪和粗纤维含量的近红外光谱快速分析[J]. 光谱学与光谱分析, 2020, 40(1): 215-220. HAO Y, WU W H, SHANG Q Y. The research on quantitative analysis of feed crude fat and crude fiber based on near infrared spectroscopy and variables selection methods[J]. Spectroscopy and Spectral Analysis, 2020, 40(1): 215-220 (in Chinese). |
| [17] |
王勇生, 李洁, 王博, 等. 基于近红外光谱扫描技术对高粱中粗脂肪、粗纤维、粗灰分含量的测定方法研究[J]. 中国粮油学报, 2020, 35(3): 181-185. WANG Y S, LI J, WANG B, et al. Research on measurement of crude fat, crude fiber and ash contents in sorghum using near-infrared reflectance spectroscopy method[J]. Journal of the Chinese Cereals and Oils Association, 2020, 35(3): 181-185 (in Chinese). DOI:10.3969/j.issn.1003-0174.2020.03.029 |
| [18] |
常春, 侯向阳, 武自念, 等. 近红外光谱法测定羊草干草的9项品质指标[J]. 中国草地学报, 2019, 41(5): 47-52. CHANG C, HOU X Y, WU Z N, et al. Nine quality indexes determination of leymus chinensis hay by near infrared reflectance spectroscopy[J]. Chinese Journal of Grassland, 2019, 41(5): 47-52 (in Chinese). |
| [19] |
冯豆, 蔡阿敏, 薛宵, 等. 花生秧常规营养成分近红外反射光谱预测模型的建立[J]. 动物营养学报, 2019, 31(1): 452-458. FENG D, CAI A M, XUE X, et al. Prediction model establishment for routine nutrient of peanut vine by near-infrared reflectance spectroscopy[J]. Chinese Journal of Animal Nutrition, 2019, 31(1): 452-458 (in Chinese). DOI:10.3969/j.issn.1006-267x.2019.01.053 |
| [20] |
SAMADI, WAJIZAH S, MUNAWAR A A. Near infrared spectroscopy (NIRS) data analysis for a rapid and simultaneous prediction of feed nutritive parameters[J]. Data in Brief, 2020, 29: 105211. DOI:10.1016/j.dib.2020.105211 |
| [21] |
曹明月, 郑爱荣, 娄渊志, 等. 奶牛全混合日粮常规营养成分含量近红外快速检测模型的构建与应用[J]. 动物营养学报, 2020, 32(7): 3420-3427. CAO M Y, ZHENG A R, LOU Y Z, et al. Construction and application of near infrared reflectance spectroscope rapid detection model for routine nutritional components contents of total mixed ration in dairy cattle[J]. Chinese Journal of Animal Nutrition, 2020, 32(7): 3420-3427 (in Chinese). |
| [22] |
PARRINI S, ACCIAIOLI A, FRANCI O, et al. Near infrared spectroscopy technology for prediction of chemical composition of natural fresh pastures[J]. Journal of Applied Animal Research, 2019, 47(1): 514-520. DOI:10.1080/09712119.2019.1675669 |
| [23] |
SAKIRKIN S L P, MORGAN C L S, MACDONALD J C, et al. Effect of diet composition on the determination of ash and moisture content in solid cattle manure using visible and near-infrared spectroscopy[J]. Applied Spectroscopy, 2011, 65(9): 1056-1061. DOI:10.1366/11-06333 |
| [24] |
佟五宝. 泌乳期奶牛粪样常规成分近红外分析模型的建立及评价[D]. 硕士学位论文. 呼和浩特: 内蒙古农业大学, 2014. TONG W B. Establishment and evaluation of near-infrared reflectance spectroscopy model for lactating cows feces conventional components[D]. Master's Thesis. Hohhot: Inner Mongolia Agricultural University, 2014. (in Chinese) |
| [25] |
RIGHI F, SIMONI M, VISENTIN G, et al. The use of near infrared spectroscopy to predict faecal indigestible and digestible fibre fractions in lactating dairy cattle[J]. Livestock Science, 2017, 206: 105-108. DOI:10.1016/j.livsci.2017.10.006 |
| [26] |
PÉREZ-VICH B, VELASCO L, FERNÁNDEZ-MARTÍNEZ J M. Determination of seed oil content and fatty acid composition in sunflower through the analysis of intact seeds, husked seeds, meal and oil by near-infrared reflectance spectroscopy[J]. Journal of the American Oil Chemists' Society, 1998, 75(5): 547-555. DOI:10.1007/s11746-998-0064-1 |
| [27] |
汪磊, 谭美莲, 傅春玲, 等. 利用近红外技术预测向日葵籽仁品质性状[J]. 中国油料作物学报, 2020, 42(1): 147-153. WANG L, TAN M L, FU C L, et al. Prediction of qualitative characteristics of sunflower husked seed by near infrared spectroscopy[J]. Chinese Journal of Oil Crop Sciences, 2020, 42(1): 147-153 (in Chinese). |
| [28] |
王海东, 秦玉昌, 吕小文, 等. 近红外光谱技术(NIRS)测定玉米粉碎粒度的研究[J]. 饲料工业, 2008, 29(19): 41-44. WANG H D, QIN Y C, LV X W, et al. Study on the measurement of corn grinding particle size by near infrared spectroscopy (NIRS)[J]. Feed Industry, 2008, 29(19): 41-44 (in Chinese). DOI:10.3969/j.issn.1001-991X.2008.19.013 |
| [29] |
唐开婷. 便携式近红外光谱仪预测苜蓿干草品质模型建立与应用[D]. 硕士学位论文. 石河子: 石河子大学, 2018. TANG K T. Establishment and application of portable near infrared spectrometer date model for alfalfa hay[D]. Master's Thesis. Shihezi: Shihezi University, 2018. (in Chinese) |
| [30] |
刘哲. 天然牧草营养成分评定及近红外漫反射光谱定量分析[D]. 硕士学位论文. 洛阳: 河南科技大学, 2017. LIU Z. Evaluation of nutritional components of natural pasture and quantitative analysis of near infrared diffuse reflectance spectroscopy[D]. Master's Thesis. Luoyang: Henan University of Science and Technology, 2017. (in Chinese) |
| [31] |
PAYNE C E, WOLFRUM E J. Rapid analysis of composition and reactivity in cellulosic biomass feedstocks with near-infrared spectroscopy[J]. Biotechnology for Biofuels, 2015, 8: 43. DOI:10.1186/s13068-015-0222-2 |


