

1 材料与方法
1.1 试验材料
表1 甘蔗渣和发酵甘蔗渣营养水平和pH(干物质基础)Table 1 Nutrient levels and pH of sugarcane bagasse and fermented sugarcane bagasse (DM basis) |
| 项目 Items | 甘蔗渣 Sugarcane bagasse | 发酵甘蔗渣 Fermented sugarcane bagasse |
|---|---|---|
| 粗蛋白质 CP/% | 2.41 | 2.92 |
| 粗脂肪 EE/% | 0.47 | 0.51 |
| 粗灰分 Ash/% | 3.76 | 4.04 |
| 钙 Ca/% | 0.13 | 0.11 |
| 总磷 TP/% | 0.02 | 0.06 |
| 粗纤维 CF/% | 43.46 | 32.99 |
| 中性洗涤纤维 NDF/% | 81.83 | 55.34 |
| 酸性洗涤纤维 ADF/% | 54.77 | 39.30 |
| 酸性洗涤木质素 ADL/% | 13.50 | 10.71 |
| 可溶性碳水化合物 Water soluble carbohydrate/% | 4.45 | 7.02 |
| pH | 6.92 | 5.18 |
1.2 试验动物与试验设计
表2 饲粮组成及营养水平(干物质基础)Table 2 Composition and nutrient levels of diets (DM basis) % |
| 项目 Items | 含量 Content | |
|---|---|---|
| CON组 CON group | FSB组 FSB group | |
| 原料 Ingredients | ||
| 玉米 Corn | 23.05 | 23.05 |
| 豆粕 Soybean meal | 7.00 | 7.00 |
| 喷浆玉米皮 Corn gluten feed | 0.50 | 0.50 |
| 棉籽粕 Cottonseed meal | 1.50 | 1.50 |
| 缓释尿素 Slow-released urea | 0.35 | 0.35 |
| 玉米青贮 Corn silage | 45.00 | 45.00 |
| 甘蔗渣 Sugarcane bagasse | 20.00 | |
| 发酵甘蔗渣 Fermented sugarcane bagasse | 20.00 | |
| 石粉 Limestone | 0.90 | 0.90 |
| 磷酸氢钙 CaPHO4 | 0.20 | 0.20 |
| 氧化镁 MgO | 0.20 | 0.20 |
| 食盐 NaCl | 0.32 | 0.32 |
| 小苏打 NaHCO3 | 0.48 | 0.48 |
| 预混料 Premix1) | 0.50 | 0.50 |
| 合计 Total | 100.00 | 100.00 |
| 营养水平 Nutrient levels2) | ||
| 综合净能 NEmf/(MJ/kg) | 9.07 | 9.15 |
| 粗蛋白质 CP | 10.65 | 10.61 |
| 粗脂肪 EE | 2.53 | 2.55 |
| 中性洗涤纤维 NDF | 48.20 | 43.09 |
| 酸性洗涤纤维 ADF | 26.35 | 23.86 |
| 钙 Ca | 0.47 | 0.48 |
| 总磷 TP | 0.30 | 0.31 |
1)每千克预混料含有One kg of premix contained the following:VA 1 600 000 IU,VD3 60 000 IU,VE 6 000 IU,Cu 2 g,Fe 12 g,Mn 8 g,Zn 8 g,Se 60 mg,I 120 mg,Co 40 mg。 2)综合净能为计算值,其他营养水平为实测值。NEmf was a calculated value, while the other nutrient levels were measured values. |
1.3 饲养管理
1.4 测定指标和方法
1.4.1 饲粮养分含量测定
1.4.2 生长性能测定
1.4.3 养分表观消化率
1.4.4 瘤胃发酵参数测定
1.4.5 瘤胃菌群测定
1.5 数据处理与统计方法
2 结果
2.1 饲喂发酵甘蔗渣对肉牛生长性能的影响
表3 饲喂发酵甘蔗渣对肉牛生长性能的影响Table 3 Effects of feeding fermented sugarcane bagasse on growth performance of beef cattle |
| 项目 Items | 对照组 CON group | 发酵甘蔗渣组 FSB group | P值 P-value |
|---|---|---|---|
| 初始体重 Initial BW/kg | 363.59±10.63 | 364.08±8.96 | 0.926 |
| 终末体重 Final BW/kg | 430.77±10.54 | 439.21±8.60 | 0.125 |
| 干物质采食量 DMI/kg | 8.78±0.34 | 9.06±2.96 | 0.104 |
| 平均日增重 ADG/kg | 0.84±0.04b | 0.94±0.02a | <0.001 |
| 料重比 F/G | 10.43±0.18a | 9.65±0.19b | <0.001 |
同行数据肩标不同小写字母表示差异显著(P<0.05),无字母表示差异不显著(P>0.05)。下表同。 | |
In the same row, values with different small letter superscripts mean significant difference (P<0.05), while with no letter superscripts mean no significant difference (P>0.05). The same as below. |
2.2 饲喂发酵甘蔗渣对肉牛养分表观消化率的影响
表4 饲喂发酵甘蔗渣对肉牛养分表观消化率的影响Table 4 Effects of feeding fermented sugarcane bagasse on apparent digestibility of nutrients of beef cattle % |
| 项目 Items | 对照组 CON group | 发酵甘蔗渣组 FSB group | P值 P-value |
|---|---|---|---|
| 干物质 DM | 55.51±3.46b | 60.61±2.93a | 0.012 |
| 有机物 OM | 56.35±3.52b | 61.43±2.96a | 0.019 |
| 粗蛋白质 CP | 39.87±2.67b | 51.53±3.92a | <0.001 |
| 粗脂肪 EE | 69.09±4.75 | 70.95±3.53 | 0.421 |
| 中性洗涤纤维 NDF | 43.63±2.39b | 46.96±3.57a | 0.026 |
| 酸性洗涤纤维 ADF | 38.33±2.66 | 41.49±1.90 | 0.062 |
2.3 饲喂发酵甘蔗渣对肉牛瘤胃发酵特性的影响
表5 饲喂发酵甘蔗渣对肉牛瘤胃发酵特性的影响Table 5 Effects of feeding fermented sugarcane bagasse on rumen fermentation characteristics of beef cattle |
| 项目 Items | 对照组 CON group | 发酵甘蔗渣组 FSB group | P值 P-value |
|---|---|---|---|
| pH | 6.48±0.05 | 6.43±0.09 | 0.404 |
| 氨态氮 NH3-N/(mg/dL) | 11.97±0.50b | 13.02±0.62a | 0.038 |
| 菌体蛋白 MCP/(mg/mL) | 5.35±0.42b | 6.03±0.21a | 0.028 |
| 乙酸 Acetic acid/(mmol/L) | 49.89±1.56 | 55.49±4.61 | 0.061 |
| 丙酸 Propionic acid/(mmol/L) | 11.53±0.41b | 12.74±0.87a | 0.046 |
| 乙酸/丙酸 Acetic acid/propionic acid | 4.32±0.07 | 4.23±0.45 | 0.841 |
| 异丁酸 Isobutyric acid/(mmol/L) | 0.33±0.04b | 0.39±0.02a | 0.035 |
| 丁酸 Butyric acid/(mmol/L) | 5.18±0.79b | 6.63±0.55a | 0.024 |
| 异戊酸 Isopentanoic acid/(mmol/L) | 0.47±0.04 | 0.50±0.10 | 0.683 |
| 戊酸 Pentanoic acid/(mmol/L) | 0.43±0.07 | 0.43±0.09 | 0.983 |
| 总挥发性脂肪酸 TVFA/(mmol/L) | 67.84±2.21b | 76.18±5.76a | 0.035 |
2.4 饲喂发酵甘蔗渣对肉牛瘤胃细菌OTU数和Alpha多样性的影响
表6 饲喂发酵甘蔗渣对肉牛瘤胃细菌OTU数和Alpha多样性的影响Table 6 Effects of feeding fermented sugarcane bagasse on OTU number and Alpha diversity of rumen bacteria of beef cattle |
| 项目 Items | 对照组 CON group | 发酵甘蔗渣组 FSB group | P值 P-value |
|---|---|---|---|
| OTU数 OTU number | 2 562.50±129.95a | 2 140.00±130.09b | 0.004 |
| Shannon指数 Shannon index | 8.59±0.22a | 8.04±0.38b | 0.047 |
| Simpson指数 Simpson index | 0.98±0.00 | 0.98±0.01 | 0.510 |
| Chao1指数 Chao1 index | 2 633.23±126.06a | 2 206.40±130.54b | 0.003 |
| ACE指数 ACE index | 2 734.71±128.62a | 2 297.29±130.48b | 0.003 |
| 覆盖率 Goods_coverage/% | 98.93±0.06 | 99.03±0.10 | 0.130 |
2.5 饲喂发酵甘蔗渣对肉牛瘤胃门水平细菌相对丰度的影响
表7 饲喂发酵甘蔗渣对肉牛瘤胃门水平细菌相对丰度的影响Table 7 Effects of feeding fermented sugarcane bagasse on relative abundance of rumen bacteria at phylum level of beef cattle % |
| 项目 Items | 对照组 CON group | 发酵甘蔗渣组 FSB group | P值 P-value |
|---|---|---|---|
| 厚壁菌门 Firmicutes | 48.75±5.77 | 48.15±3.95 | 0.870 |
| 拟杆菌门 Bacteroidetes | 37.84±7.04 | 34.91±5.25 | 0.529 |
| 广古菌门 Euryarchaeota | 3.36±2.12 | 7.97±5.70 | 0.181 |
| 髌骨细菌门 Patescibacteria | 2.16±0.38 | 1.68±0.33 | 0.105 |
| 放线菌门 Actinobacteria | 0.45±0.20 | 0.61±0.27 | 0.389 |
| 变形菌门 Proteobacteria | 1.29±0.15a | 0.89±0.12b | 0.005 |
| 螺旋体门 Spirochaetes | 0.45±0.09 | 1.32±1.01 | 0.136 |
| 浮霉菌门 Planctomycetes | 0.98±0.36 | 0.50±0.19 | 0.054 |
| 软壁菌门 Tenericutes | 0.31±0.01 | 0.48±0.13 | 0.078 |
| Kiritimatiellaeota | 0.46±0.19 | 0.26±0.13 | 0.131 |
| 绿弯菌门 Chloroflexi | 0.26±0.18 | 0.15±0.08 | 0.280 |
| 纤维杆菌门 Fibrobacteres | 0.06±0.03b | 0.14±0.06a | 0.044 |
2.6 饲喂发酵甘蔗渣对肉牛瘤胃属水平细菌相对丰度的影响
表8 饲喂发酵甘蔗渣对肉牛瘤胃属水平细菌相对丰度的影响Table 8 Effects of feeding fermented sugarcane bagasse on relative abundance of rumen bacteria at genus level of beef cattle % |
| 项目 Items | 对照组 CON group | 发酵甘蔗渣组 FSB group | P值 P-value |
|---|---|---|---|
| 克里斯腾森菌科_R-7_群 Christensenellaceae_R-7_group | 13.43±3.56 | 9.42±0.46 | 0.108 |
| 普雷沃氏菌属_1 Prevotella_1 | 8.84±3.73 | 10.35±2.71 | 0.535 |
| 理研菌科_RC9_肠道群 Rikenellaceae_RC9_gut_group | 10.90±1.99a | 6.40±0.46b | 0.017 |
| 解琥珀酸菌属 Succiniclasticum | 3.48±1.12b | 8.60±0.63a | <0.010 |
| 甲烷短杆菌属 Methanobrevibacter | 3.31±2.11 | 7.86±5.64 | 0.209 |
| 瘤胃球菌属_2 Ruminococcus_2 | 3.57±1.13 | 2.81±0.89 | 0.336 |
| 瘤胃球菌科_NK4A214_群Ruminococcaceae_NK4A214_group | 2.29±0.73 | 2.03±0.36 | 0.540 |
| 候选单细胞生糖菌属Candidatus_Saccharimonas | 1.81±0.26 | 1.39±0.34 | 0.098 |
| 毛螺旋菌科_NK3A20_群 Lachnospiraceae_NK3A20_group | 2.25±0.88 | 1.54±0.44 | 0.198 |
| 普雷沃氏菌科_UCG-003 Prevotellaceae_UCG-003 | 2.44±0.59a | 1.50±0.24b | 0.025 |
| 产乙酸糖发酵菌属 Saccharofermentans | 2.12±0.52 | 1.45±0.27 | 0.064 |
| 瘤胃球菌科_UCG-014 Ruminococcaceae_UCG-014 | 1.45±0.28 | 1.31±0.36 | 0.574 |
| 普雷沃氏菌科_UCG-001 Prevotellaceae_UCG-001 | 1.37±0.21 | 1.30±0.50 | 0.817 |
| 丁酸弧菌属_2 Butyrivibrio_2 | 0.79±0.10 | 1.43±0.57 | 0.107 |
| 嗜果胶拟杆菌群 Bacteroides_pectinophilus_group | 0.19±0.09 | 2.10±3.49 | 0.355 |
| 粪杆菌真核菌群Eubacterium_coprostanoligenes_group | 1.32±0.18 | 0.96±0.24 | 0.051 |
2.7 指示物种分析
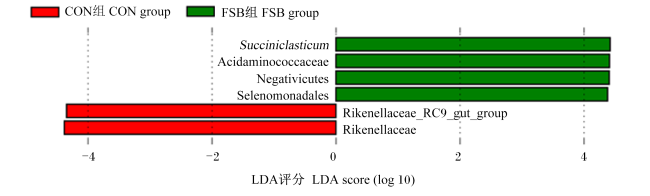
图1 CON组和FSB组瘤胃细菌LDA效应大小分析(LEfSe)Succiniclasticum:解琥珀酸菌属;Acidaminococcaceae:氨基酸球菌科;Negativicutes: 革兰氏阴性菌纲;Selenomonadales: 月形单胞菌目;Rikenellaceae_RC9_gut_group:理研菌科_RC9_肠道群;Rikenellaceae:理研菌科。 LDA评分代表了2组之间相对丰度的差异,指数倍数变化为10。The LDA score represents the difference in relative abundance between the two groups, with an exponential multiple change of 10. Fig.1 Analysis of LDA effect size (LEfSe) of rumen bacteria in CON and FSB groups |
2.8 瘤胃发酵参数与细菌属水平相对丰度之间的相关性
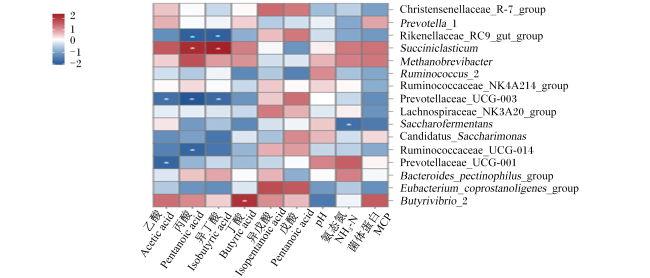
图2 饲喂甘蔗渣和发酵甘蔗的肉牛瘤胃菌群与发酵参数之间的相关性Christensenellaceae_R-7_group:克里斯腾森菌科_R-7_群; Prevotella_1:普雷沃氏菌属_1; Rikenellaceae_RC9_gut_group:理研菌科_RC9_肠道群; Succiniclasticum:解琥珀酸菌属; Methanobrevibacter:甲烷短杆菌属;Ruminococcus_2:瘤胃球菌属_2; Ruminococcaceae_NK4A214_group:瘤胃球菌科_NK4A214_群; Prevotellaceae_UCG-003:普雷沃氏菌科_UCG-003;Saccharofermentans:产乙酸糖发酵菌属; Lachnospiraceae_NK3A20_group:毛螺旋菌科_NK3A20_群;Candidatus_Saccharimonas:候选单细胞生糖菌属;Ruminococcaceae_UCG-014:瘤胃球菌科_UCG-014; Prevotellaceae_UCG-001:普雷沃氏菌科_UCG-001;Bacteroides_pectinophilus_group:嗜果胶拟杆菌群;Butyrivibrio_2:丁酸弧菌属_2; Eubacterium_coprostanoligenes_group:粪杆菌真核菌群。 *表示显著相关(P<0.05)。红色和蓝色表示强相关,1和2表示正相关(深红色),-1和-2表示负相关(深蓝色),弱相关性由白色表示。* indicated a significant association (P<0.05). Red and blue represent strong correlations, 1 and 2 represent positive correlations (dark red), -1 and -2 represent negative correlations (dark blue), and weak correlations are represented by white. Fig.2 Correlation between rumen microflora and fermentation parameters of beef cattle fed sugarcane bagasse and fermented sugarcane bagasse |
 京公网安备 11010802041926号


