

1 材料与方法
1.1 试验材料
1.2 试验设计
1.3 样品采集与指标测定
1.3.1 成活率和平均增重测定
存活率(%)=100×终末鱼尾数/初始鱼尾数;
平均增重(g)=终末平均体重-初始平均体重。
1.3.2 肠道菌群分析
1.4 变形假单胞菌的生长抑制试验
1.5 统计分析
2 结果与分析
2.1 大黄鱼的存活和生长
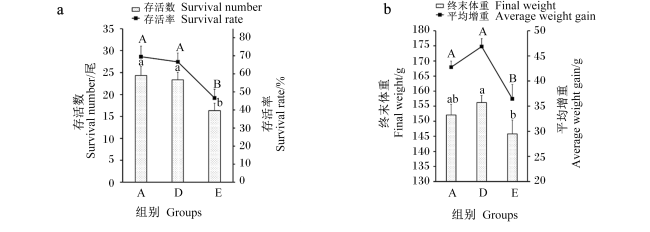
图1 海藻酶解物对大黄鱼存活和生长的影响a:海藻酶解物对大黄鱼存活的影响;b:海藻酶解物对大黄鱼生长的影响。数据柱或数据点显示为“平均值±标准误”(n=3)。数据柱标注不同小写字母表示差异显著(P<0.05),数据点标注不同大写字母表示差异显著(P<0.05)。 Fig.1 Effects of seaweeds enzymatic hydrolysate on survival and growth of Larimichthys crocea a: the effects of seaweeds enzymatic hydrolysate on survival of Larimichthys crocea; b: the effects of dietary seaweeds enzymatic hydrolysateon growth of Larimichthys crocea. Data columns or data points display as “mean± SE” (n=3). Data columns with different small letters mean significant difference (P<0.05), and data points with different capital letters mean significant difference (P<0.05). |
2.2 肠道菌群结构特征
2.2.1 肠道菌群分组差异性分析
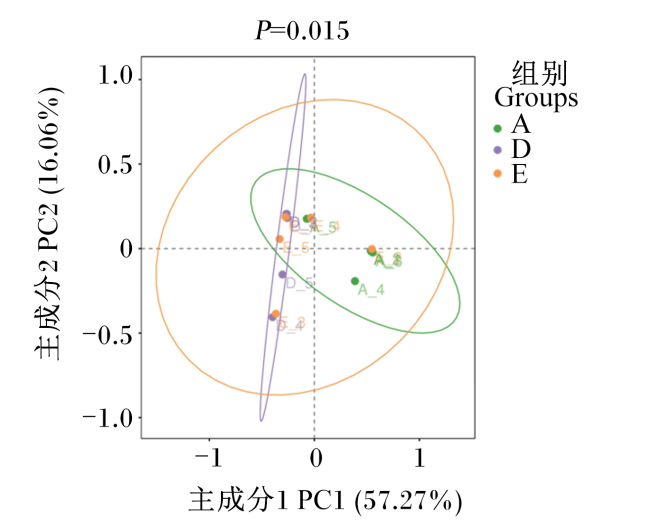
图2 基于Weighted Unifrac距离的PCoA图中的每个点表示1个样本,同一个组的样本使用同一种颜色表示,颜色区域代表置信区间。 A_1~5为A组的5个样本;D_1~5为D组的5个样本;E_1~5为E组的5个样本。图3、图5和图9同。 Fig.2 PCoA based on Weighted Unifrac distance Each point in the figure represents a sample, the samples of the same group are represented by the same color, and the color area represents the confidence interval. A_1 to 5 are five samples from A group; D_1 to 5 are five samples from D group; E_1 to 5 are five samples from E group. The same as Fig.3, Fig.5 and Fig.9. |
2.2.2 肠道菌群特征和变化
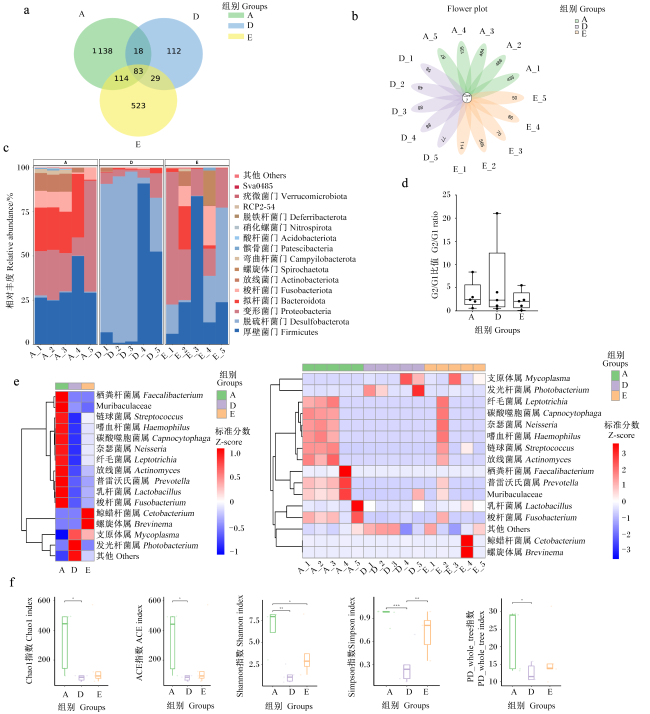
图3 海藻酶解物对大黄鱼肠道菌群的影响a、b:基于ASVs的韦恩图;c:肠道菌群优势菌门相对丰度分析;d:G2/G1比值分析,其中G1(功能组1)为变形菌门相对丰度,G2(功能组2)为梭杆菌门、厚壁菌门和拟杆菌门相对丰度之和;e:各组和各样本肠道菌群属水平物种丰度热图;f:α多样性分析。图中*表示P<0.05,**表示P<0.01,***表示P<0.001。 Fig.3 Effects of seaweeds enzymatic hydrolysate on intestinal microflora of Larimichthys crocea a, b: Venn diagram based ASVs; c: relative abundance analysis of dominant bacterial phyla in intestinal microflora; d: G2/G1 ratio, where G1 (functional group 1) is the relative abundance of Proteobacteria, and G2 (functional group 2) is the sum of relative abundances of Fusobacteria, Firmicutes and Bacteroidetes; e: heatmap of species abundance at genus level of intestinal microflora for each sample and each group; f: α diversity analysis. In the figure, * mean P<0.05, ** mean P<0.01, and *** mean P<0.001. |
2.2.3 差异菌群分析
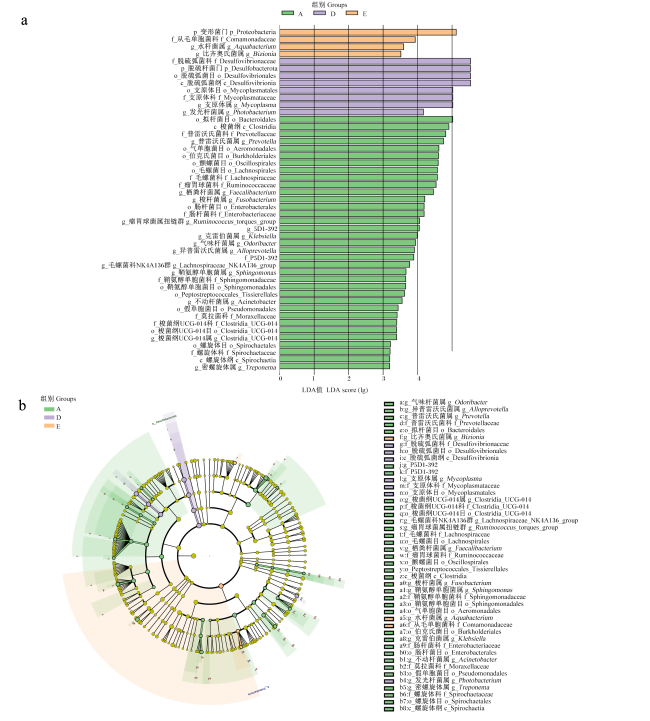
图4 LEfSe分析确定不同组中的生物标志物LDA值分布柱状图(图a)主要展示了LDA值大于预设值(less strict设为2;more strict设为4)的物种,即具有统计学差异的生物标志物;柱状图的颜色代表各自的组别,长短代表的是LDA值,即不同组间差异显著物种的影响程度。在进化分支图(图b)中,由内至外辐射的圆圈代表了由界(单个圆圈)至属(或种)的分类级别,不同分类级别上的每一个小圆圈代表该水平下的一个分类,小圆圈直径大小与物种相对丰度大小成正比;无显著差异的物种统一着色为黄色,差异显著的物种跟随组别进行着色,不同颜色表示在各自组别中起到重要作用的微生物类群。生物标志物对应的物种名展示在右侧,字母编号与图中对应。 Fig.4 LEfSe analysis identified the biomarkers in different groups The LDA score distribution histogram (figure a) mainly displays the species with LDA scores greater than the preset values (less strict sets as 2; more strict sets as 4), indicates that the biomarker has statistical difference; the color of the bar represents their respective groups, while the length represents the LDA score, which is the degree of influence of species with significant differences between different groups. In the cladogram (figure b), the circle radiating from inside to outside in the diagram represents the classification level from kingdom (single circle) to genus (or species); each small circle at different classification levels represents a classification at that level, and the diameter of the small circle is proportional to the relative abundance. Species with no significant differences are uniformly colored yellow, while species with significant differences are colored according to the group. Different colors represent the microbial groups that play an important role in each group. The species names corresponding to biomarker are displayed on the right, and the letter number correspond to the figure. |
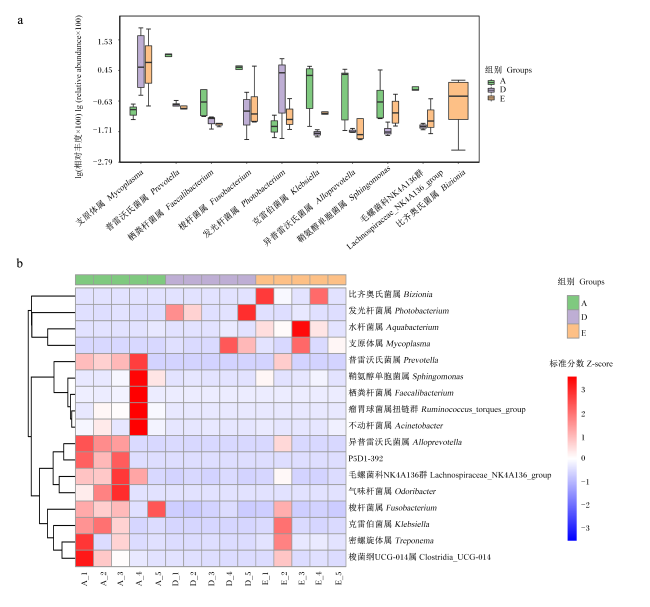
图5 海藻酶解物对大黄鱼肠道菌群差异菌属(生物标志物)相对丰度的影响a:组间排名前10的差异菌属(生物标志物)的相对丰度箱体图;b:样本间排名前15的差异菌属(生物标志物)相对丰度热图。 Fig.5 Effects of seaweeds enzymatic hydrolysate on relative abundances of differential bacteria genus (biomarkers) in intestinal microflora of Larimichthys crocea a: box diagram of relative abundance of the top 10 differential bacterial genus (biomarkers) among groups; b: heatmap of relative abundance of the top 15 differential bacterial genus (biomarkers) among samples. |
2.3 特定菌群分析
2.3.1 丁酸合成相关细菌
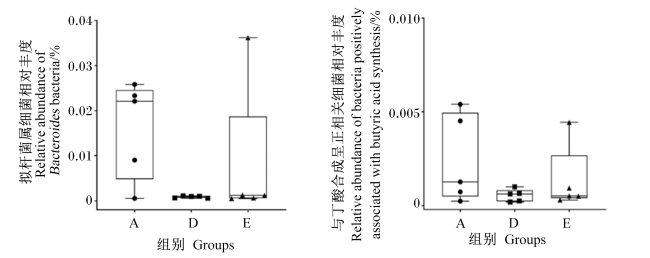
2.3.2 假单胞菌属细菌
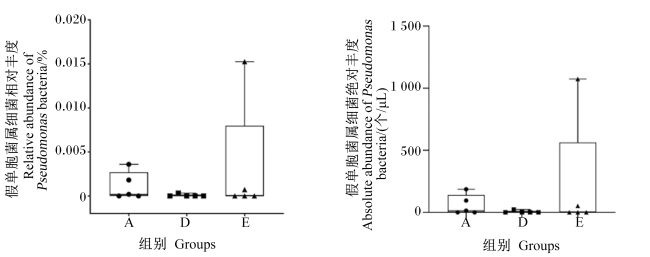
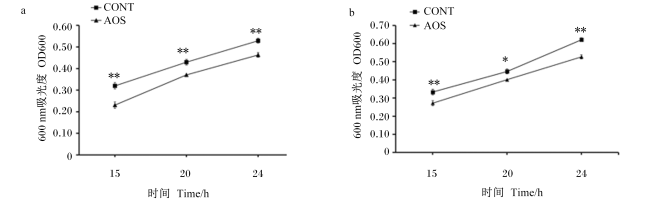
图8 褐藻寡糖抑制体外变形假单胞菌生长a:变形假单胞菌Pp-01;b:变形假单胞菌Pp-02。CONT:空白对照组;AOS:添加0.5%褐藻寡糖的试验组。数据点显示为“平均值±标准误”(n=4)。CONT数据点标注“*”表示与AOS相比差异显著(P<0.05),标注“**”表示与AOS相比差异极显著(P<0.01)。培养条件:营养肉汤培养基,接种量0.7×10⁷ CFU/mL,有氧、25 ℃、100 r/min条件下培养。 Fig.8 Alginate oligosaccharide inhibits Pseudomonas plecoglossicida growth in vitro a: Pseudomonas plecoglossicida Pp-01; b: Pseudomonas plecoglossicida Pp-02. CONT: blank control group; AOS: test group with 0.5% alginate oligosaccharide added. The data points display as “mean±SE” (n=4). Data points of CONT marked with “*” indicate significant difference compared with AOS (P<0.05), while marked with “**” indicate extremely significant difference compared with AOS (P<0.01). Culture conditions: nutrient broth culture medium, inoculum density 0.7×10⁷ CFU/mL and cultured under aerobic condition at 25 ℃ and 100 r/min. |
2.4 肠道菌群功能差异
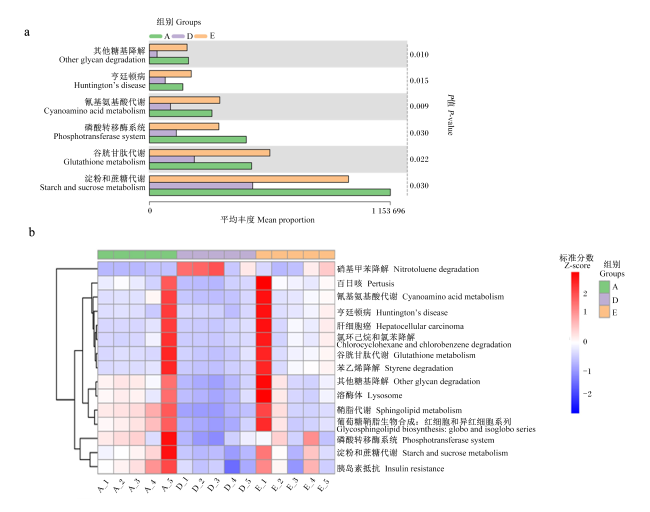
图9 基于大黄鱼肠道菌群16S的KEGG功能预测a:Kruskal-Wallis统计组间差异显著的KEGG预测结果;b:样本间丰度有显著差异的前15个KEGG预测结果的热图。 Fig.9 KEGG function prediction based on 16S of Larimichthys crocea intestinal flora a: KEGG prediction results with significant differences among groups using Kruskal-Wallis method; b: the heatmap of top 15 mean proportion of predicted KEGG results with significant differences among difference samples. |
 京公网安备 11010802041926号


