

1 材料与方法
1.1 试验材料
1.2 试验设计
1.2.1 小鼠肠道炎症损伤模型建立
1.2.2 试验分组及处理
1.3 样品采集及指标测定
1.3.1 结肠长度
1.3.2 血清炎症因子含量
1.3.3 肝脏和脾脏指数
1.3.4 肝脏、脾脏和结肠组织病理结构
1.3.5 结肠内容物样品采集及测定
1.4 数据统计与分析
2 结果与分析
2.1 小鼠急性肠炎损伤模型的构建
表1 不同浓度LPS腹腔注射后小鼠状态Table 1 State in mice after intraperitoneal injection of LPS at different concentrations |
| LPS浓度 LPS concentrations/(mg/kg BW) | 死亡数 Death count/只 | 精神状态 Mental state | 粪便形态 Fecal morphology |
|---|---|---|---|
| 0 (对照Control) | 0 | 活泼 | 颗粒状正常粪便 |
| 2.0 | 0 | 1只活动减少 | 2只软便成型 |
| 2.5 | 0 | 精神沉郁 | 均肛门污秽,1只血便 |
| 3.0 | 1 | 2只精神沉郁 | 1只肛门污秽,2只血便 |
| 4.0 | 3 | 全部死亡 | 肛门污秽,血便 |
| 5.0 | 3 | 全部死亡 | 肛门污秽,血便 |
2.2 戊酸钠对LPS诱导急性肠炎损伤小鼠体重和结肠长度的影响
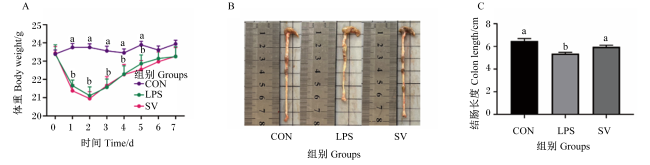
图1 戊酸钠对LPS诱导急性肠炎损伤小鼠体重和结肠长度的影响A:0~7 d体重变化 weight changes from 0 to 7 days;B:结肠长度形态 colon length morphology;C:结肠长度比较 colon length comparison. 折线和数据柱形标注不同小写字母表示差异显著(P<0.05)。Different lowercase letters on broken lines and data bars indicated significant differences (P<0.05). Fig.1 Effects of sodium valerate on body weight and colon length in mice with LPS-induced acute enteritis injury |
2.3 戊酸钠对LPS诱导急性肠炎损伤小鼠血清炎症因子含量的影响
表2 戊酸钠对LPS诱导急性肠炎损伤小鼠血清炎症因子含量的影响Table 2 Effect of sodium valerate on serum inflammatory factor contents in mice with LPS-induced acute enteritis injury pg/mL |
| 项目 Items | 组别Groups | P值 P-value | ||
|---|---|---|---|---|
| CON | LPS | SV | ||
| 白细胞介素-1β IL-1β | 281.70±12.67b | 357.30±44.90a | 227.40±47.74b | 0.03 |
| 肿瘤坏死因子-α TNF-α | 3.98±0.53ab | 5.79±1.80a | 2.35±1.27b | 0.01 |
同行数据肩标无字母或相同字母表示差异不显著(P>0.05),不同字母表示差异显著(P<0.05)。下表同。 | |
In the same row, values with no letter or the same letter superscripts mean no significant difference (P>0.05), while with different letter superscripts mean significant difference (P<0.05). The same as below. |
2.4 戊酸钠对LPS诱导急性肠炎损伤小鼠肝脏和脾脏指数的影响
表3 戊酸钠对LPS诱导急性肠炎损伤小鼠肝脏和脾脏指数的影响Table 3 Effect of sodium valerate on liver and spleen indices in mice with LPS-induced acute enteritis injury % |
| 项目 Items | 组别Groups | P值 P-value | ||
|---|---|---|---|---|
| CON | LPS | SV | ||
| 肝脏指数Liver index | 3.98±0.53 | 5.79±1.80 | 2.35±1.27 | 0.07 |
| 脾脏指数Spleen index | 0.24±0.02c | 0.40±0.08a | 0.34±0.06b | <0.01 |
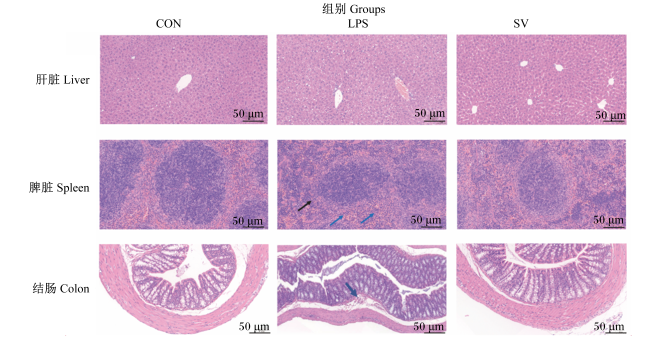
2.5 戊酸钠对LPS诱导急性肠炎损伤小鼠肝脏、脾脏和结肠组织病理结构的影响
2.6 戊酸钠对LPS诱导急性肠炎损伤小鼠结肠SCFA含量的影响
表4 戊酸钠对LPS诱导急性肠炎损伤小鼠结肠SCFA含量的影响Table 4 Effects of sodium valerate on SCFA content in colon in mice with LPS-induced acute enteritis injurymmol/L |
| 项目 Items | 组别Groups | P值 P-value | ||
|---|---|---|---|---|
| CON | LPS | SV | ||
| 乙酸Acetic acid | 3.12±0.92a | 2.00±0.72b | 3.09±0.52a | 0.02 |
| 丙酸Propionic acid | 0.42±0.12a | 0.26±0.09b | 0.33±0.06ab | 0.02 |
| 丁酸Butyric acid | 0.19±0.08a | 0.10±0.04b | 0.14±0.02ab | 0.02 |
| 戊酸Valeric acid | 0.03±0.02a | 0.01±0.01b | 0.02±0.02a | 0.02 |
| 异丁酸Isobutyric acid | 0.06±0.02 | 0.00±0.03 | 0.04±0.01 | 0.28 |
| 异戊酸Isovaleric acid | 0.08±0.03 | 0.07±0.03 | 0.07±0.01 | 0.33 |
| 总短链脂肪酸Total SCFA | 3.95±1.19a | 2.46±0.87b | 3.68±0.60a | 0.02 |
2.7 戊酸钠对LPS诱导急性肠炎损伤小鼠结肠菌群的影响
2.7.1 小鼠结肠菌群操作分类单元(OTU)分析
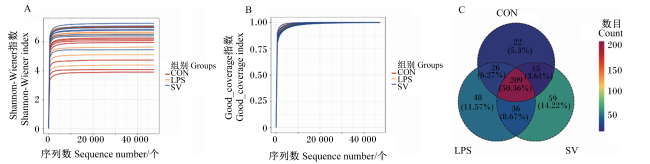
2.7.2 小鼠结肠菌群alpha多样性分析
表5 戊酸钠对LPS诱导肠炎损伤小鼠结肠菌群alpha多样性的影响Table 5 Effects of sodium valerate on alpha-diversity of colonic microflora in mice with LPS-induced acute enteritis injury |
| 项目 Items | 组别Groups | P值 P-value | ||
|---|---|---|---|---|
| CON | LPS | SV | ||
| Chao1指数Chao1 index | 787.86±255.93 | 815.13±145.59 | 865.72±314.58 | 0.80 |
| Shannon指数Shannon index | 5.54±1.14b | 6.15±0.99ab | 6.69±0.57a | 0.02 |
| Simpson指数Simpson index | 0.85±0.11b | 0.91±0.10ab | 0.95±0.02a | 0.01 |
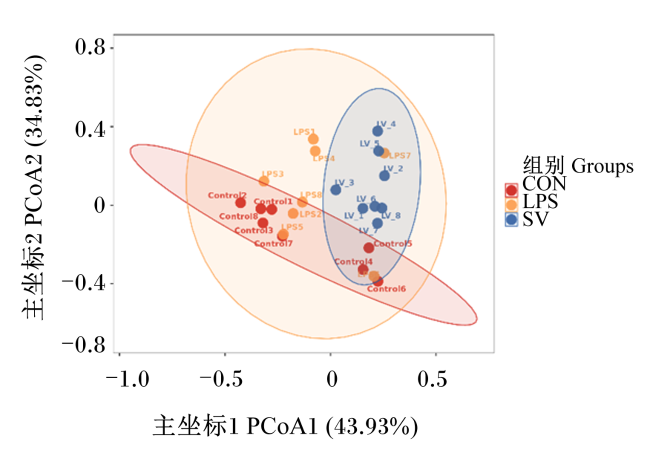
2.7.3 小鼠结肠菌群beta多样性分析
2.7.4 戊酸钠对LPS诱导急性肠炎损伤小鼠结肠菌群组成的影响
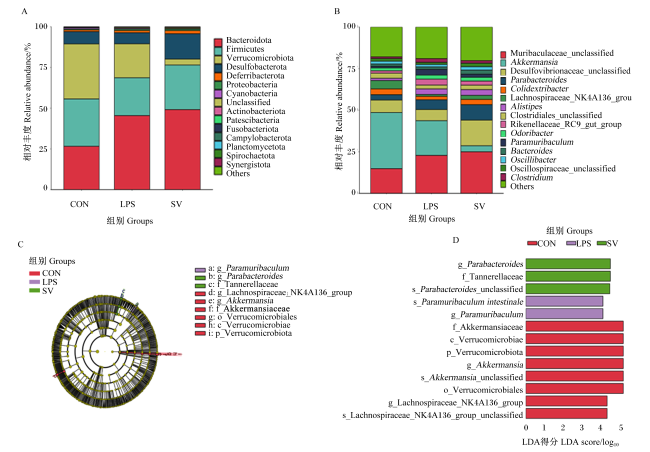
图5 小鼠结肠菌群在门(A)和属(B)水平上的组成和LEfSe分析分布图(C和D)p_:门 phylum;c_:纲 class;o_:目 order;f_:科 family;g_:属 genus;s_:种 species;Bacteroidota:拟杆菌门;Firmicutes:厚壁菌门;Verrucomicrobiota:疣微菌门;Desulfobacterota:脱硫杆菌门;Deferribacterota:脱铁杆菌门;Proteobacteria:变形菌门;Cyanobacteria:蓝藻菌门;Unclassified:未分类菌门;Actinobacteriota:放线菌门;Patescibacteria:髌骨菌门;Fusobacteriota:梭杆菌门;Campylobacterota:弯曲菌门;Planctomycetota:浮霉菌门;Spirochaetota:螺旋菌门;Synergistota:互养菌门;Others:其他;Akkermansia:阿克曼菌属;Desulfovibrionaceae_unclassified:脱硫弧菌科未分类属;Parabacteroides:副拟杆菌属;Lachnospiraceae_NK4A136_group:毛螺菌科NK4A136群;Alistipes:另枝菌属;Clostridiales_unclassified:梭菌目未分类属;Rikenellaceae_RC9_gut_group:理研菌科RC9肠道群;Bacteroides:拟杆菌属;Oscillibacter:颤杆菌属;Oscillospiraceae_unclassified:颤螺菌科未分类属;Clostridium:梭菌属;Tannerellaceae:坦纳菌科;Akkermansiaceae:阿克曼菌科;Verrucomicrobiales:疣微菌目;Verrucomicrobiae:疣微菌纲。图7同 the same as Fig.7。 Fig.5 Composition of colonic microflora in mice at phylum (A) and genus (B) levels and distribution diagram of LEfSe analysis (C and D) |
表6 戊酸钠对LPS诱导急性肠炎损伤小鼠结肠菌群相对丰度的影响Table 6 Effects of sodium valerate on relative abundance of colonic microflora in mice with LPS-induced acute enteritis injury % |
| 项目 Items | 组别Groups | P值 P-value | |||||||
|---|---|---|---|---|---|---|---|---|---|
| CON | LPS | SV | |||||||
| 门水平Phylum level | |||||||||
| 拟杆菌门Bacteroidota | 26.62±6.16b | 45.46±16.11a | 49.14±20.89ab | 0.03 | |||||
| 厚壁菌门Firmicutes | 29.09±13.87 | 23.23±16.54 | 27.37±10.51 | 0.69 | |||||
| 疣微菌门Verrucomicrobiota | 33.75±15.11a | 20.85±19.08a | 3.66±4.82b | <0.01 | |||||
| 总相对丰度Total relative abundance | 89.46±3.62 | 89.54±13.57 | 80.17±22.75 | 0.96 | |||||
| 属水平Genus level | |||||||||
| Muribaculaceae_unclassified | 14.88±5.65 | 22.85±9.67 | 25.00±11.92 | 0.11 | |||||
| 阿克曼菌属Akkermansia | 33.75±15.11a | 20.85±19.08a | 3.66±4.82b | <0.01 | |||||
| 脱硫弧菌科未分类属Desulfovibrionaceae_unclassified | 7.46±4.06ab | 6.74±4.96b | 15.44±9.88a | 0.04 | |||||
| 副拟杆菌属Parabacteroides | 3.23±0.89b | 5.85±4.04ab | 9.22±3.37a | <0.01 | |||||
| Colidextribacter | 3.51±1.62 | 2.07±1.48 | 3.19±1.64 | 0.18 | |||||
| 毛螺菌科NK4A136群Lachnospiraceae_NK4A136_group | 4.99±3.09a | 1.10±1.07b | 2.45±1.66ab | 0.01 | |||||
| 另枝菌属Alistipes | 1.38±0.38b | 3.36±1.78a | 3.42±1.96a | 0.03 | |||||
| 梭菌目未分类属Clostridiales_unclassified | 3.07±1.48 | 2.33±2.78 | 2.72±1.74 | 0.78 | |||||
| 理研菌科RC9肠道群Rikenellaceae_RC9_gut_group | 1.44±0.56 | 3.54±2.02 | 2.42±1.65 | 0.05 | |||||
| Odoribacter | 1.76±0.80 | 2.48±2.02 | 2.32±1.61 | 0.58 | |||||
| 总相对丰度Total relative abundance | 75.47±10.06 | 71.17±7.96 | 70.86±7.55 | 0.99 | |||||
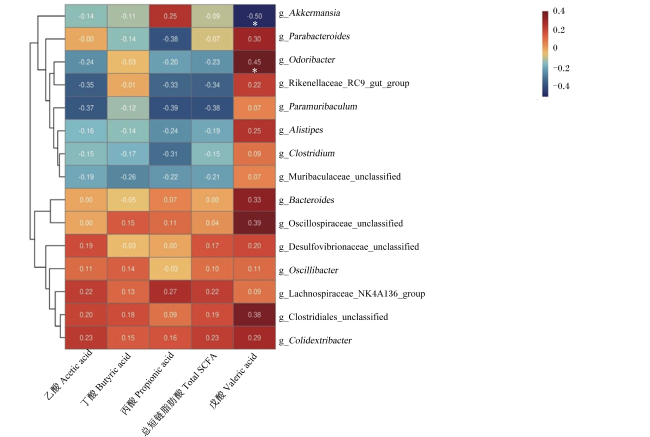
图6 小鼠结肠菌群相对丰度与SCFA含量相关性分析颜色强度代表相关程度,红色表示正相关,蓝色表示负相关;数值表示相关系数,*表示显著相关(P<0.05)。 Fig.6 Correlation analysis of colonic microflora relative abundance and SCFA content in mice Color intensity represented correlation degree, with red representing positive correlation and blue representing negative correlation; value was correlation coefficient, and * mean significant correlation (P<0.05). |
 京公网安备 11010802041926号


