研究论文

锤片式粉碎模式下不同粉碎粒度对全株玉米淀粉含量近红外光谱预测模型质量的影响

  • 魏杰 , 1 ,
  • 程柳洋 1 ,
  • 钟荣珍 2 ,
  • 李婷玉 1 ,
  • 王硕 1 ,
  • 沈维政 3 ,
  • 张广宁 1 ,
  • 辛杭书 , 1, *
展开
  • 1 东北农业大学动物科学技术学院,哈尔滨 150030
  • 2 中国科学院东北地理与农业生态研究所,吉林省草地畜牧重点实验室,吉林省饲料加工与草食家畜精准饲养跨区域合作科技创新中心,长春 130102
  • 3 东北农业大学电气与信息学院,哈尔滨 150030
*辛杭书,教授,博士生导师,E-mail:

魏杰(2000—),女,内蒙古赤峰人,硕士研究生,研究方向为反刍动物营养。E-mail:

Copy editor: 田艳明

收稿日期: 2025-04-13

  网络出版日期: 2025-11-14

基金资助

黑龙江省自然科学基金联合重点项目(ZL2024C016)

Effects of Different Particle Sizes on Quality of Near-Infrared Spectroscopy Prediction Models for Starch Content in Whole-Plant Corn under Hammer Mill Grinding Mode

  • WEI Jie , 1 ,
  • CHENG Liuyang 1 ,
  • ZHONG Rongzhen 2 ,
  • LI Tingyu 1 ,
  • WANG Shuo 1 ,
  • SHEN Weizheng 3 ,
  • ZHANG Guangning 1 ,
  • XIN Hangshu , 1, *
Expand
  • 1 College of Animal Science and Technology, Northeast Agricultural University, Harbin 150030, China
  • 2 Jilin Province Feed Processing and Precision Feeding for Grassland Livestock Inter-Regional Cooperation Science and Technology Innovation Center, Jilin Province Key Laboratory of Grassland Animal Husbandry, Northeast Institute of Geography and Agroecology, Chinese Academy of Sciences, Changchun 130102, China
  • 3 College of Electrical Engineering and Information, Northeast Agricultural University, Harbin 150030, China
*professor, E-mail:

Received date: 2025-04-13

  Online published: 2025-11-14

摘要

本试验旨在探究在锤片式粉碎模式下,不同粉碎粒度对全株玉米淀粉含量近红外光谱(NIRS)预测模型质量的影响。试验共采集来自全国各地具有代表性的180份全株玉米样本,风干后分别进行4种粉碎处理:旋风式粉碎至1.0 mm(对照)以及锤片式粉碎至2.0、3.0和4.0 mm。首先对各处理样品进行NIRS扫描,随后采用湿化学法测定其淀粉含量,以评估粉碎粒度对预测模型构建效果的影响。结果表明:锤片式2.0 mm处理下建立的淀粉含量NIRS预测模型性能最优,其关键评价指标分别为预测均方根误差(RMSEP)=1.208、预测标准差(SEP)=1.207、斜率(Slope)=1.026、预测决定系数( R p 2)=0.969、实测值与预测值的平均偏差(Bias)=-0.048、相对分析误差(RPD)=3.843以及SEP/交叉验证标准误差(SECV)=0.807,优于锤片式3.0 mm(RMSEP=1.277、SEP=1.277、Slope=0.999、 R p 2=0.965、Bias=0.008、RPD=3.635以及SEP/SECV=0.807)和锤片式4.0 mm(RMSEP=1.907、SEP=1.896、Slope=1.118、 R p 2=0.927、Bias=-0.198、RPD=2.324以及SEP/SECV=1.023)。由此可见,在锤片式粉碎模式下,选用2.0 mm粉碎粒度进行样品预处理,可有效提高NIRS技术对全株玉米淀粉含量的定量分析精度,具有良好的应用前景。

本文引用格式

魏杰 , 程柳洋 , 钟荣珍 , 李婷玉 , 王硕 , 沈维政 , 张广宁 , 辛杭书 . 锤片式粉碎模式下不同粉碎粒度对全株玉米淀粉含量近红外光谱预测模型质量的影响[J]. 动物营养学报, 2025 , 37(11) : 7924 -7932 . DOI: 10.12418/CJAN2025.644

Abstract

This study aimed to investigate the effects of different particle sizes on the quality of near-infrared spectroscopy (NIRS) prediction models for starch content in whole-plant corn under a hammer mill grinding mode. A total of 180 representative whole-plant corn samples from diverse regions in China were collected. After air-drying, each sample was subjected to four processing methods: grinding to 1.0 mm using a cyclone mill (control), and grinding to 2.0, 3.0 and 4.0 mm using a hammer mill. NIRS scanning was performed on each processed sample, followed by wet chemical analysis of starch content to evaluate the impact of grinding particle size on the construction effect of the prediction models. The results demonstrated that the NIRS prediction model for starch content established under the hammer mill grinding to 2.0 mm treatment had the best performance, with the key evaluation indicators as root mean square error of prediction (RMSEP)=1.208, standard error of prediction (SEP)=1.207, slope=1.026, determination coefficient of prediction ( R p 2)=0.969, average deviation between the measured value and the predicted value (Bias)=-0.048, relative percent deviation (RPD)=3.843, and SEP/standard error of cross-validation (SECV)=0.807, respectively, which was superior to hammer mill grinding to 3.0 mm (RMSEP=1.277, SEP=1.277, slope=0.999, R p 2=0.965, Bias=0.008, RPD=3.635, and SEP/SECV=0.807) and hammer mill grinding to 4.0 mm (RMSEP=1.907, SEP=1.896, slope=1.118, R p 2=0.927, Bias=-0.198, RPD=2.324, and SEP/SECV=1.023). It can be seen from this that in the hammer mill grinding mode, choosing a particle size of 2.0 mm for sample pretreatment can effectively improve the quantitative analysis accuracy of the starch content in whole-plant corn by NIRS technology, and has a good application prospect.

全株玉米是指将玉米果穗连同茎、叶、穗轴及花等营养器官一并收割的作物,具有可溶性碳水化合物含量高、营养丰富和消化率高等特点[1]。2024—2025年,我国玉米种植面积为 44   886   k h m 2 [ 2 ]。随着《粮改饲工作实施方案》的推进,全株玉米作为优质青贮饲料的地位日益突出,广泛应用于奶牛养殖中。全株玉米青贮不仅为奶牛提供了优质的能量来源,也为畜牧业健康、可持续发展提供了饲料保障[3]
淀粉含量是评价全株玉米营养价值和定价的关键指标之一,对奶牛能量供给及产奶性能影响显著[4]。因此,建立快速、准确的淀粉含量评估手段显得尤为必要。近年来,近红外光谱(near-infrared spectroscopy,NIRS)分析技术凭借其快速、无损、绿色及操作简便等优势,在饲料、食品和农业等领域广泛应用[5]。在饲料营养分析中,NIRS可用于高通量检测、现场评估和在线监控,是提高饲料质量控制效率的有效工具[6]。然而,样品水分是NIRS检测质量的重要干扰因素。鲜玉米样品中水分含量高,会降低模型的预测精度[7],因此,将鲜玉米全株样品进行干燥并制备为标准粉末样品,是提升NIRS分析准确性的关键[8]
粉碎设备和处理方式对干燥样品的均一性、表征性及光谱响应特性均有显著影响[9]。国际上[如美国国家粗饲料测试协会(NFTA)]普遍推荐使用旋风式粉碎机制备粒径为1.0 mm的样品,用于NIRS分析建模。但是,该设备价格高、维修难,在牧场和中小型检测机构中普及受限。锤片式粉碎机结构简单、价格低、实用性强,能较好地粉碎全株玉米,广泛应用于牧场[10]。然而,目前尚缺乏系统研究评估基于锤片式粉碎机制备的干燥样本在NIRS预测建模中的最佳粉碎粒度。因此,亟需探讨锤片式粉碎模式下,不同粉碎粒度样本的光谱响应特性与建模精度之间的关系,为其在实际生产中的推广应用提供理论依据与技术支撑。
本研究基于实际生产需求,围绕锤片式粉碎模式,探索其制备的全株玉米风干样品在NIRS预测模型中的应用可行性。依据ISO 6498:2012动物饲料制备标准,锤片式粉碎时需维持样本完整性,最大粒径宜为4~6 mm。当粒径降至1 mm时样本完整性显著受损,故本研究选定2~4 mm粒径范围[11]。同时,本试验采用偏最小二乘法建立不同粉碎粒度(2.0、3.0和4.0 mm)下全株玉米淀粉含量的NIRS预测模型,筛选适用于NIRS分析的最佳粉碎粒度,为在资源受限的条件下实现全株玉米营养快速评估提供技术路径与数据参考。

1 材料与方法

1.1 试验材料

全株玉米样本于2023年采集自宁夏、云南、北京、黑龙江和内蒙古等地,样本来源信息见表1。每份样本采集700~1 000 g进行真空包装,并在4 ℃条件下冷链运输至实验室。鉴于水分含量的关键影响,供试鲜全株玉米初始水分含量为60%~80%。本研究统一采用55 ℃烘干至恒重的全株玉米风干样品,其干物质含量稳定于93%~95%。为防止样品吸湿回潮,所有处理步骤均集中于样品制备后30 d内完成,并控制环境温度为20~25 ℃、相对湿度为35%~55%下进行。
表1 全株玉米样本来源信息

Table 1 Source information of samples 个

项目
Items
牧场数量
Ranch
number
样本数量
Sample
number
宁夏Ningxia 4 83
云南Yunnan 5 37
北京Beijing 1 22
内蒙古Inner Mongolia 10 19
黑龙江Heilongjiang 7 19
样品制备参照ISO 6498:2012进行,样品使用强制通风干燥箱55 ℃烘干24 h,分别于2和12 h时进行翻样,后室温平衡2 h制得风干样品,密封常温保存。粉碎前,将风干样品置于-18 ℃下冷冻24 h;随后使用锤片式粉碎机粗粉碎过4.0 mm筛片,并使用旋转式分样器分成4等份。选取其中3份子样样品分别进行以下处理:2份样品锤片式粉碎机分别过2.0和3.0 mm筛片,另1份样品旋风式粉碎机过1.0 mm筛片。最终获得4种粉碎样品:旋风式1.0 mm(对照)、锤片式2.0 mm、锤片式3.0 mm和锤片式4.0 mm,用于后续的NIRS分析与湿化学测定。

1.2 试验仪器和设备

主要仪器和设备包括:强制通风干燥箱(型号:精宏101-2D,容积71 L),锤片式粉碎机(型号:鼎厉DLF-20),旋转式分样器(型号:Retsch PT100,德国),旋风式粉碎机(型号:Foss CT293,丹麦),极光手持NIRS分析仪(Carl Zeiss Spectroscopy GmbH,德国)

1.3 试验方法

采用极光手持NIRS分析仪进行光谱数据采集,样品扫描操作参照前人的方法及流程[11-13],具体步骤如下:1)机器预热30 min,样本置于室温平衡30 min;2)约50 g样品采用对角线法混合11次;3)设备竖直置于样本上扫描2 s;4)清洁镜头,重新混合样本,采集另一面光谱;5)重复步骤3和步骤4,共扫描12次;6)扫描后,将样本立即倒入样本瓶(聚丙烯,250 mL)中,4 ℃保存。
淀粉含量测定依据ISO 6498:2012要求粉碎粒度为0.5 mm,采用AOAC 2014.09—2014酶解法测定[14],主要步骤如下:样品经脱脂、去糖和糊化后,用淀粉酶水解为麦芽糖,后经酸水解成为葡萄糖,测定葡萄糖含量即可换算出淀粉含量。每个样品设2个平行重复,同时,每批次检测均包含质控样本,确保数据稳定可靠。

1.4 数据处理

采用极光手持NIRS分析仪进行光谱采集,采集软件为InProcess,化学计量学分析使用UCAL 4.0软件(Unity Scientific,Brookfield,美国)。数据处理包括:1)定标集与预测集的划分。采用“等间隔划分法”对样本进行定标集和预测集的分组[15]。2)异常样本剔除。通过蒙特卡洛交叉验证(Monte Carlo cross validation,MCCV)算法识别并剔除定标集中的异常样本[16]。3)光谱预处理。通过InProcess软件对每个样品进行12次光谱扫描,并对扫描结果进行平均处理[17],平均光谱经吸光度转换后导入UCAL 4.0软件。4)定标模型建立。采用偏最小二乘法,在950~1 650 nm全波段范围内建立预测模型。5)粉碎粒度对光谱的影响分析。通过对不同粉碎粒度下的原始光谱图、预处理后光谱图、主成分分析(PCA)图、光谱重复性及吸光度平均值进行比较,系统评估粉碎粒度对NIRS的影响。6)预测模型性能评价。模型性能评价指标包括校正决定系数( R c 2)、校正标准误差(SEC)、交叉验证决定系数( R c v 2)、交叉验证标准误差(SECV)、预测决定系数( R p 2)、预测标准差(SEP)、预测均方根误差(RMSEP)、相对分析误差(RPD)、SEP/SECV和斜率(Slope)。
相关评价指标计算公式如下:
t= Y a c t u a l - Y p r e d i c t e d S E M;
决定系数(R2)=1- i = 1 n ( Y a c t u a l - Y p r e d i c t e d ) 2   i = 1 n ( Y a c t u a l - Y a c t u a l ) 2;
SEC= [ i = 1 n ( Y a c t u a l - Y p r e d i c t e d ) 2 ] / ( n - 1 );
SECV= [ i = 1 n ( Y a c t u a l - Y p r e d i c t e d ) 2 ) ] / ( n - 1 );
SEP= [ i = 1 n ( Y a c t u a l - Y p r e d i c t e d ) 2 ] / ( m - 1 );
RMSEP= [ i = 1 n ( Y a c t u a l - Y p r e d i c t e d - B i a s ) 2 ] / ( m - 1 );
RPD= S D S E P;
Slope= S y y ^ S y ^ 2
式中:tt统计量;SEM为均值标准误;Yactual为湿化学实测值;Ypredicted为NIRS预测值;n为定标集样本数量;m为预测集样本数量;Bias为实测值与预测值的平均偏差,其数值越接近0,表明模型不存在系统性偏差[18];SD为定标集样本标准差; S y y ^为预测值与实测值的协方差; S y ^ 2为预测值的方差。

2 结果与分析

2.1 全株玉米淀粉含量分析

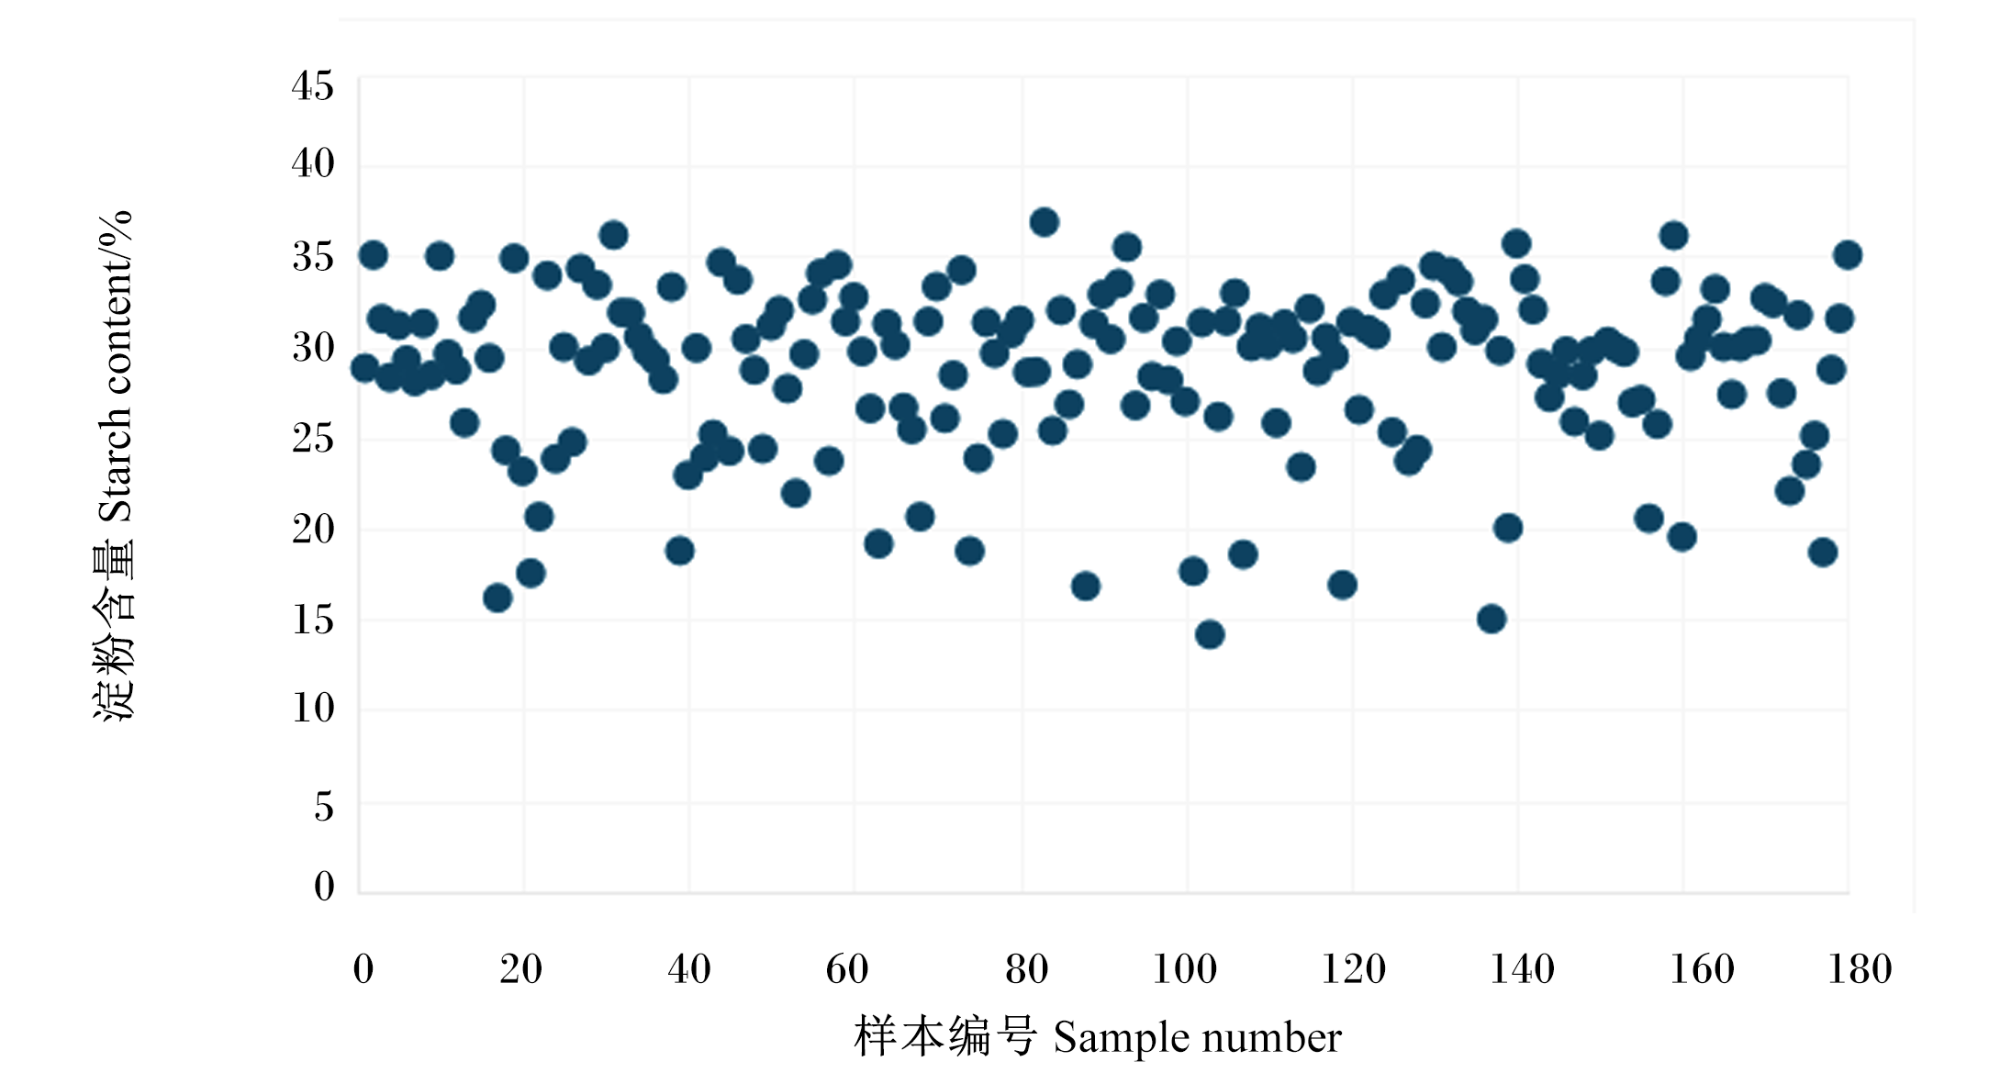
图1表2可知,全株玉米总样本的淀粉含量平均值为28.80%,最大值为36.91%,最小值为14.17%,中位值为29.96%,极差为22.74%,标准差为4.68%。其中,定标集样本的淀粉含量平均值为28.88%,最大值为36.91%,最小值为14.17%,中位值为29.86%,极差为22.74%,标准差为4.64%;预测集样本的平均值为28.50%,最大值为36.91%,最小值为16.84%,中位值为30.14%,极差为19.36%,标准差为4.88%。
图1 全株玉米淀粉含量散点图

Fig.1 Scatter plot of starch content in whole-plant corn (n=180)

表2 全株玉米淀粉含量样本集划分结果

Table 2 Results of sample set division of starch content in whole-plant corn

项目
Items
样本数量
Sample number/个
最小值
Min/%
最大值
Max/%
中位值
Median/%
极差
Range/%
平均值
Mean/%
标准差
SD/%
总有效样本Total valid sample 177 14.17 36.91 29.96 22.74 28.80 4.68
定标集Calibration set 142 14.17 36.91 29.86 22.74 28.88 4.64
预测集Prediction set 35 16.84 36.19 30.14 19.36 28.50 4.88

样本总数量为180个,剔除3个异常样本,有效样本数量为177个。

The total number of samples was 180, after excluding 3 abnormal samples, the number of valid samples was 177.

2.2 不同粉碎粒度全株玉米淀粉含量定标模型的建立

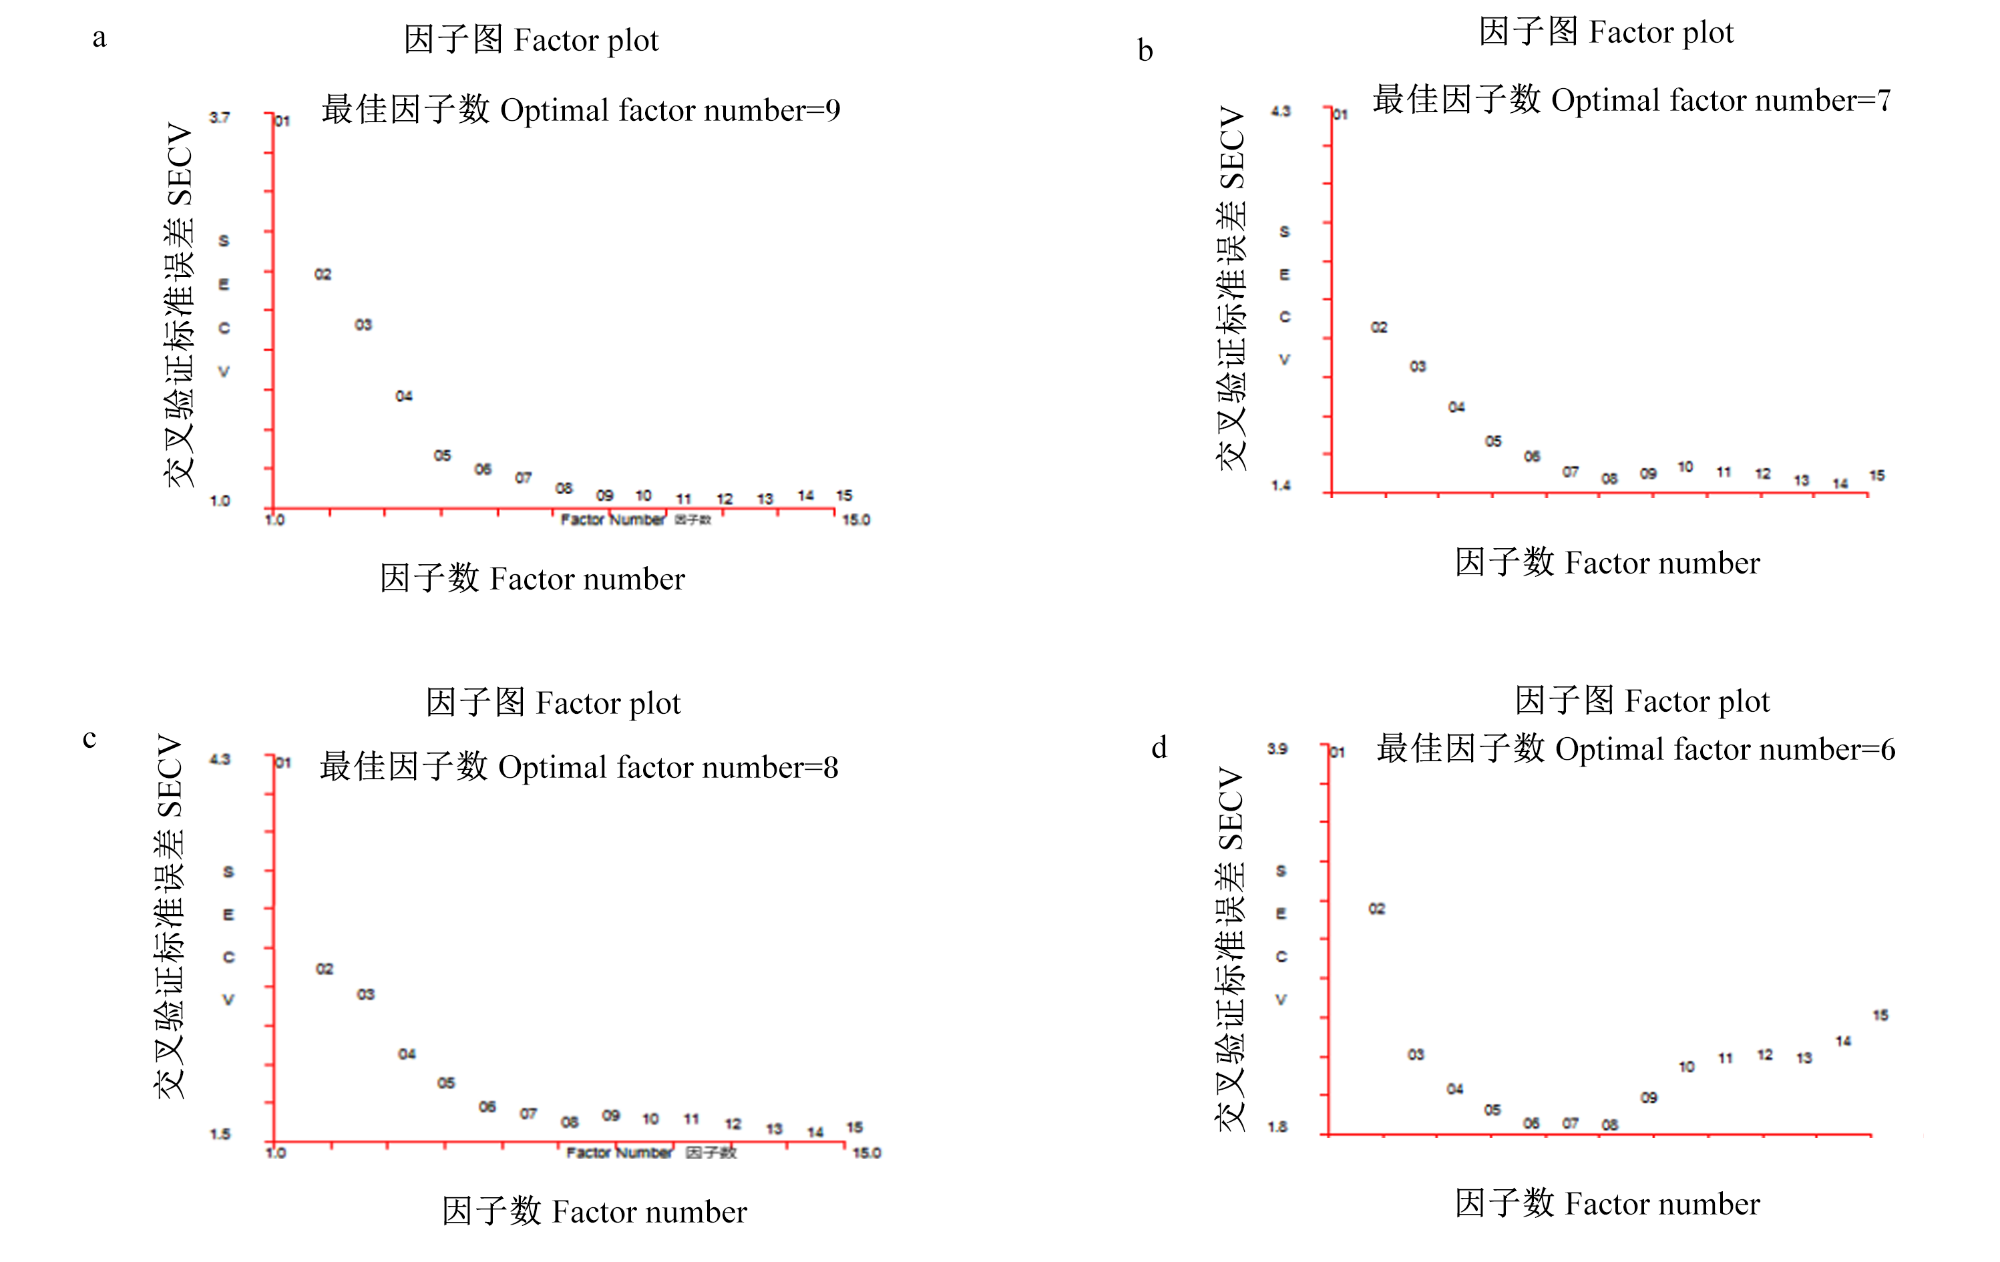
图2所示,旋风式1.0 mm、锤片式2.0 mm、锤片式3.0 mm和锤片式4.0 mm粉碎的全株玉米淀粉含量定标模型最佳因子数分别为9、7、8和6。
图2 不同粉碎粒度全株玉米淀粉含量定标模型因子图

a:旋风式1.0 mm cyclone 1.0 mm;b:锤片式2.0 mm hammer 2.0 mm;c:锤片式3.0 mm hammer 3.0 mm;d:锤片式4.0 mm hammer 4.0 mm。

Fig.2 Calibration model factor plot for starch content in whole-plant corn with different grinding particle sizes

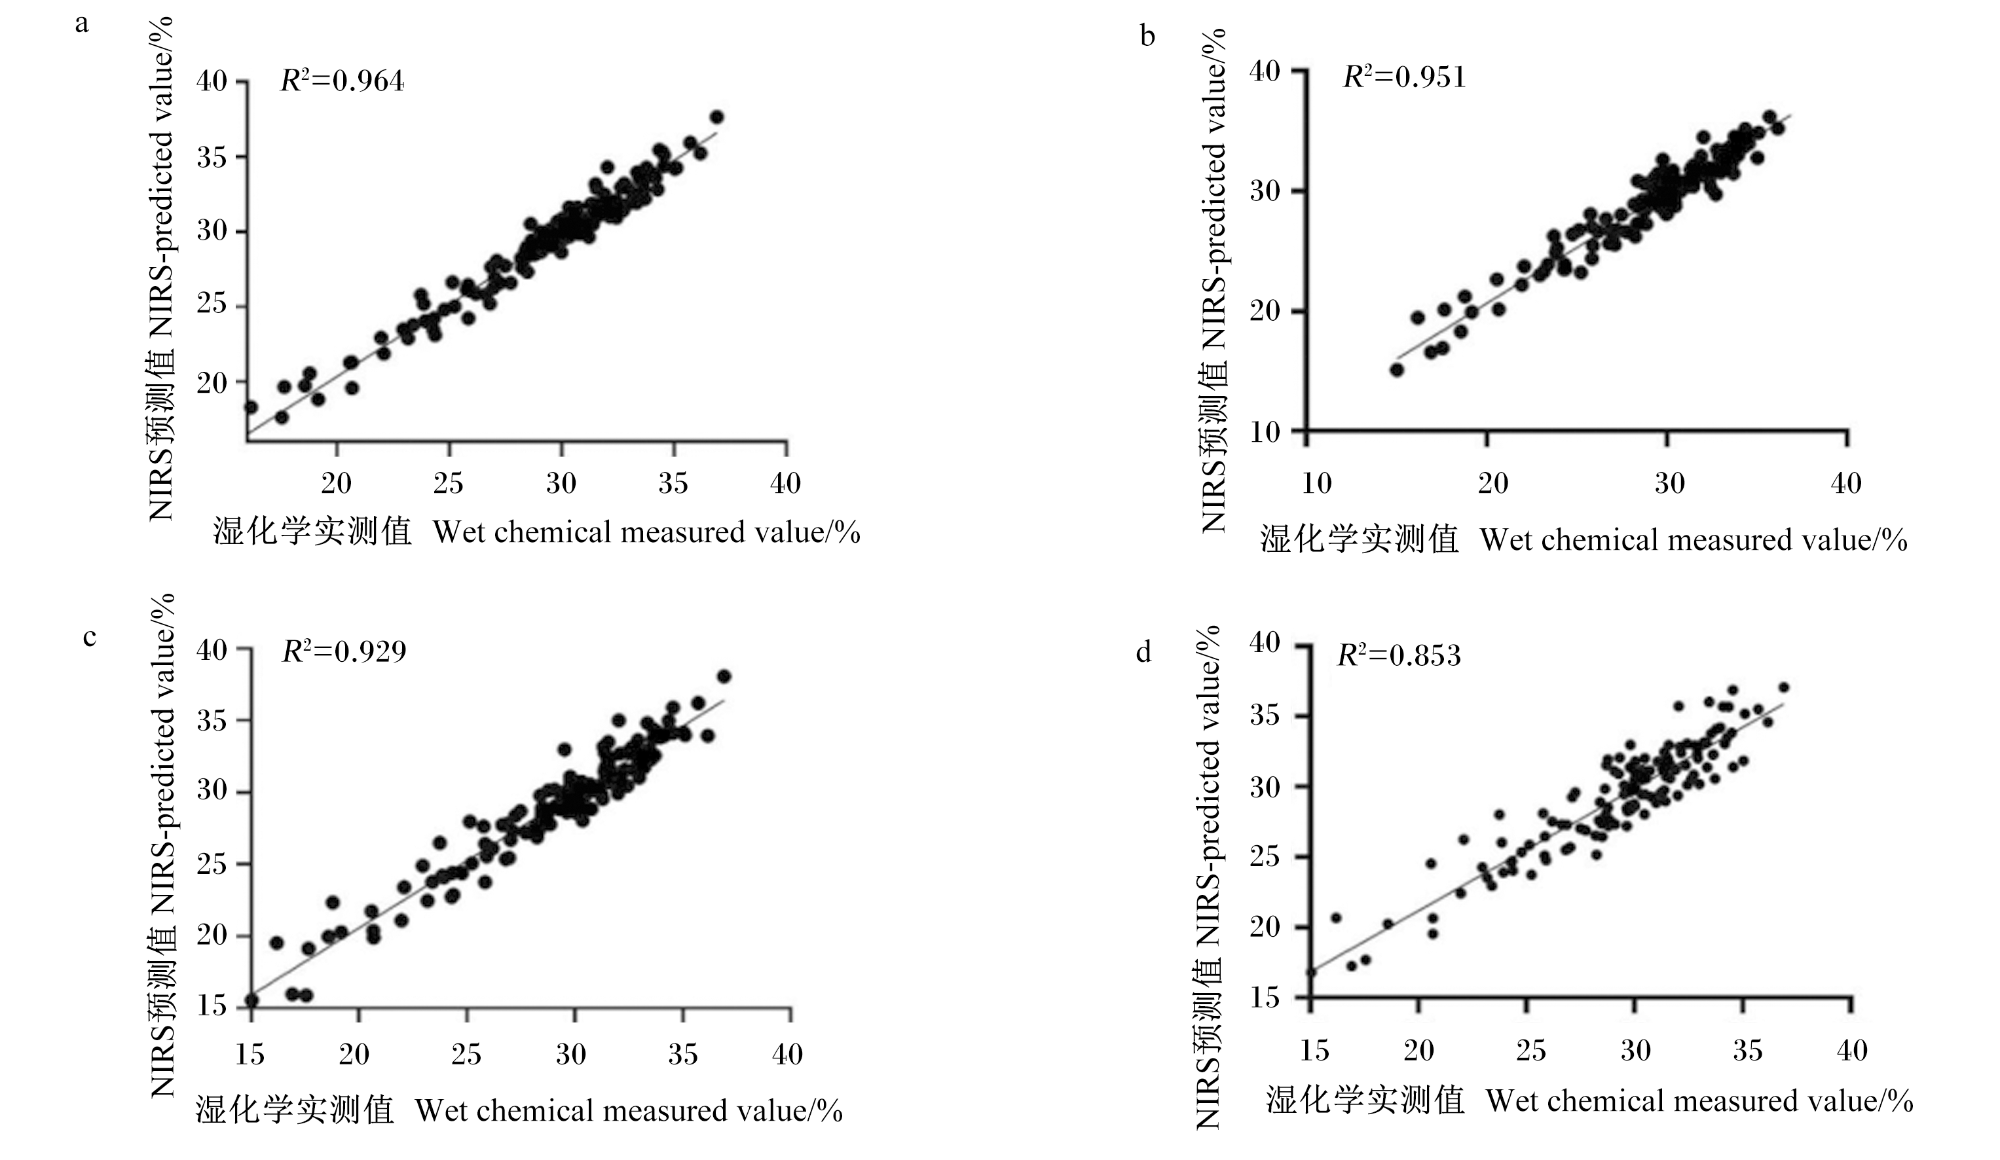
表3图3可知,在全株玉米淀粉含量定标模型构建过程中,旋风式1.0 mm、锤片式2.0 mm和锤片式3.0 mm的建模样本数量均为142个,锤片式4.0 mm的建模样本数为139个。各组淀粉含量定标模型参数如下:旋风式1.0 mm、锤片式2.0 mm、锤片式3.0 mm和锤片式4.0 mm的SEC分别为0.834、1.190、1.187和1.612, R c 2分别为0.968、0.934、0.935和0.868,SECV分别为1.052、1.496、1.582和1.853, R c v 2分别为0.944、0.879、0.873和0.810。
表3 不同粉碎粒度全株玉米淀粉含量最佳定标模型参数

Table 3 Optimal calibration model parameters for starch content in whole-plant corn with different grinding particle sizes

项目
Items
建模样本数
Modeling sample
number/个
因子数
Factor
number
校正标
准误差
SEC
校正决
定系数
R c 2
交叉验证
标准误差
SECV
交叉验证
决定系数
R c v 2
旋风式1.0 mm Cyclone 1.0 mm 142 9 0.834 0.968 1.052 0.944
锤片式2.0 mm Hammer 2.0 mm 142 7 1.190 0.934 1.496 0.879
锤片式3.0 mm Hammer 3.0 mm 142 8 1.187 0.935 1.582 0.873
锤片式4.0 mm Hammer 4.0 mm 139 6 1.612 0.868 1.853 0.810
图3 不同粉碎粒度全株玉米淀粉含量湿化学实测值与NIRS预测值相关关系

a:旋风式1.0 mm cyclone 1.0 mm;b:锤片式2.0 mm hammer 2.0 mm;c:锤片式3.0 mm hammer 3.0 mm;d:锤片式4.0 mm hammer 4.0 mm。

Fig.3 Correlation between wet chemical measured values and NIRS-predicted values of starch content in whole-plant corn with different grinding particle sizes

2.3 不同粉碎粒度全株玉米淀粉含量定标模型的验证

表4可知,旋风式1.0 mm、锤片式2.0 mm、锤片式3.0 mm和锤片式4.0 mm的RMSEP分别为0.950、1.208、1.277和1.907,SEP分别为0.885、1.207、1.277和1.896,Slope分别为1.028、1.026、0.999和1.118, R p 2分别为0.984、0.969、0.965和0.927,Bias分别为-0.343、-0.048、0.008和-0.198。
表4 不同粉碎粒度全株玉米淀粉含量定标模型外部验证结果

Table 4 External validation result of calibration model for starch content in whole-plant corn with different grinding particle sizes

项目
Items
预测均
方根误差
RMSEP
预测
标准差
SEP
斜率
Slope
预测决
定系数
R p 2
实测值与预
测值的
平均偏差
Bias
相对分
析误差
RPD
预测标准差/
交叉验证标
准误差
SEP/SECV
旋风式1.0 mm
Cyclone 1.0 mm
0.950 0.885 1.028 0.984 -0.343 4.884 0.841
锤片式2.0 mm
Hammer 2.0 mm
1.208 1.207 1.026 0.969 -0.048 3.843 0.807
锤片式3.0 mm
Hammer 3.0 mm
1.277 1.277 0.999 0.965 0.008 3.635 0.807
锤片式4.0 mm
Hammer 4.0 mm
1.907 1.896 1.118 0.927 -0.198 2.324 1.023

3 讨论

NIRS属于分子振动光谱,主要检测样品中含氢官能团(如C—H、N—H、O—H)所引起的倍频和合频吸收[19]。在NIRS区域,淀粉的吸收特征相对水分较弱,但仍在1 200~1 400 nm和2 100~2 300 nm波段存在明显吸收峰。其中,1 200~1 400 nm波段主要与C—H键的组合振动相关,而2 100~2 300 nm波段则反映C—H键的伸缩与弯曲复合振动[20]。本研究选用950~1 650 nm波段进行建模,其中淀粉含量定标模型主要基于1 200~1 400 nm波段建立。在该波段范围内,锤片式2.0 mm与锤片式3.0 mm处理下的原始光谱差异较小,预处理后的光谱曲线基本重合,表明在该粒度条件下的光谱稳定性较好。由于使用相同的湿化学实测值建模,锤片式2.0 mm与锤片式3.0 mm的定标模型在SEC、 R c 2、SECV和 R c v 2及其相应的外部验证指标(SEP、Slope、 R p 2和Bias)上的差异较小。然而,不同粉碎粒度对模型预测性能仍存在显著影响。
在玉米淀粉含量定标模型建立过程中,SEC、SECV、SEP和RMSEP值越低,表明模型误差越小[21]。本研究中,锤片式2.0 mm上述参数值(SEC=1.190,SECV=1.496,SEP=1.207,RMSEP=1.208)均低于锤片式3.0 mm和锤片式4.0 mm,且满足SEC<SEP<1.2×SEC,表明其模型质量较高[22]。值得注意的是,锤片式2.0 mm和锤片式3.0 mm的SEP/SECV值虽同为0.807,但前者的SEP更低且更接近SECV,说明锤片式2.0 mm模型具有良好的预测能力和稳定性[23]。这与Ramalho等[24]在粉碎粒度对木炭化学成分预测模型影响的研究中发现的粉碎粒度较小的样品光谱对化学成分预测更为准确的结果一致。与曹明月等[25]的研究(影响因子数=7, R p 2=0.88,SEC=1.909)相比,本试验中锤片式2.0 mm在保持相同影响因子数的基础上, R p 2提升至0.969,SEC降低至1.190,证实该粉碎粒度对淀粉定量分析具有更优的预测精度。进一步参照Pucetti等[26]建立的模型评价标准( R c 2=0.93, R c v 2=0.88, R p 2=0.91,RMSEP=2.900),本研究中锤片式2.0 mm在保持相同 R c 2(0.93)和 R c v 2(0.88)的基础上, R p 2提高至0.97,RMSEP降低至1.208,证明该粉碎参数下模型的预测准确性得到提升。RPD用于衡量模型的预测能力:当RPD>3.0时,表示模型具备较高的预测可靠性;当2.5≤RPD≤3.0时,表示模型可靠但仍需优化;当RPD<2.5时,表示模型预测性能较弱[27]。本研究中,锤片式2.0 mm和锤片式3.0 mm的RPD分别为3.843和3.635,低于旋风式1.0 mm的RPD(4.884),表明样品粉碎粒度对NIRS预测精度具有一定影响,该结果与Ge等[28]的研究结果一致。此外,沙米西努尔·牙森等[29]通过扫描电镜观察发现,全株玉米淀粉颗粒呈现不规则多面体结构,且表面较为光滑,该特征可能影响NIRS的散射特性,进而影响其光谱响应。旋风式1.0 mm处理下的玉米样品因粒度更小、表面更加光滑且趋于球形,可能减少了光散射带来的干扰,从而提高了模型预测能力[30]。值得注意的是,锤片式3.0 mm处理下的玉米淀粉含量预测模型,其Bias高于锤片式2.0 mm和锤片式4.0 mm模型, R p 2高于锤片式4.0 mm模型,该结果与刘梦等[31]在小麦样品研究中发现的总淀粉含量随粉碎粒度变化而呈现波动趋势的结果一致。推测其原因可能是因为在3.0 mm粒度下样品的破碎程度适中,破损淀粉比例较低,导致光谱吸收信号更接近真实淀粉含量,从而提升了Bias和 R p 2

4 结论

本研究在所设定的建模条件下,锤片式粉碎粒度对全株玉米淀粉含量NIRS的采集质量及模型预测性能具有显著影响。其中,锤片式2.0 mm粉碎粒度处理下的模型表现出较优的稳定性和预测精度(RMSEP=1.208,SEP=1.207)。综合模型评价指标分析,建议在利用NIRS技术对全株玉米进行淀粉含量进行定量分析时,优先选择2.0 mm粉碎粒度作为样品预处理标准。
[1]
CUI Y L, LIU H, GAO Z M, et al. Whole-plant corn silage improves rumen fermentation and growth performance of beef cattle by altering rumen microbiota[J]. Applied Microbiology and Biotechnology, 2022, 106(11):4187-4198.

[2]
中华人民共和国农业农村部. 2024年5月中国农产品供需形势分析(CASDE-No.95)[EB/OL]. (2024-05-10)[2025-03-15]. http://www.scs.moa.gov.cn/jcyj/202405/t20240510_6455153.htm.

Ministry of Agriculture and Rural Affairs of the People's Republic of China. Analysis of the supply and demand situation of agricultural products in China in May 2024 (CASDE-No.95)[EB/OL]. (2024-05-10)[2025-03-15]. http://www.scs.moa.gov.cn/jcyj/202405/t20240510_6455153.htm. (in Chinese)

[3]
赵碧刚. 青贮饲料营养价值及其在反刍动物生产中的应用[J]. 畜牧兽医科学(电子版), 2019(13):155-156.

ZHAO B G. The nutritional value of silage and its application in ruminant production[J]. Graziery Veterinary Sciences (Electronic Version), 2019(13):155-156. (in Chinese)

[4]
SUN X D, WANG Z H, AYDIN H, et al. First step for hand-held NIRS instrument field use:table grape quality assessment consideration of temperature and sunlight chemometrics correction[J]. Postharvest Biology and Technology, 2023,201:112374.

[5]
孙通, 徐惠荣, 应义斌. 近红外光谱分析技术在农产品/食品品质在线无损检测中的应用研究进展[J]. 光谱学与光谱分析, 2009, 29(1):122-126.

SUN T, XU H R, YING Y B. Progress in application of near infrared spectroscopy to nondestructive on-line detection of products/food quality[J]. Spectroscopy and Spectral Analysis, 2009, 29(1):122-126. (in Chinese)

[6]
王爽. 应用近红外反射光谱技术对中国奶牛主产区常用粗饲料的品质分析[D]. 硕士学位论文. 长春: 吉林农业大学, 2018.

WANG S. The analysis of the nutrition of common roughage in main dairy production area of China using near-infrared reflectance spectroscopy[D]. Master's Thesis. Changchun: Jilin Agricultural University, 2018. (in Chinese)

[7]
于海燕, 应义斌, 刘燕德. 农产品品质近红外光谱分析结果影响因素研究综述[J]. 农业工程学报, 2005, 21(11):160-163.

YU H Y, YING Y B, LIU Y D, et al. Research progress of factors affecting the determination of the inner quality of agricultural products by near infrared reflectance spectroscopy[J]. Transactions of the Chinese Society of Agricultural Engineering, 2005, 21(11):160-163. (in Chinese)

[8]
ZHANG M Q, ZHAO C, SHAO Q J, et al. Determination of water content in corn stover silage using near-infrared spectroscopy[J]. International Journal of Agricultural and Biological Engineering, 2019, 12(6):143-148.

[9]
FERNANDO S, MANTHEY F A. Effect of different mills on the physical and flow properties of selected black bean flour particle size fractions[J]. Cereal Chemistry, 2022, 99(4):751-761.

[10]
胡宏. 秸秆粉碎机开发及关键部件研究[D]. 硕士学位论文. 昆明: 昆明理工大学, 2017.

HU H. Development of straw crusher and study on key components[D]. Master's Thesis. Kunming: Kunming University of Science and Technology, 2017. (in Chinese)

[11]
CIURCZAK E W, TORLINI R P, DEMKOWICZ M P. Determination of particle size of pharmaceutical raw materials using near-infrared reflectance spectroscopy[J]. Spectroscopy, 1986, 1(7):36-39.

[12]
BERZAGHI P, CHERNEY J H, CASLER M D. Prediction performance of portable near infrared reflectance instruments using preprocessed dried,ground forage samples[J]. Computers and Electronics in Agriculture, 2021,182:106013.

[13]
周鹏, 王炜超, 杨玮, 等. 土壤粒度对基于近红外离散波长土壤全氮预测精度影响[J]. 光谱学与光谱分析, 2021, 41(12):3682-3687.

ZHOU P, WANG W C, YANG W, et al. Effect of soil particle size on prediction of soil total nitrogen using discrete wavelength NIR spectral data[J]. Spectroscopy and Spectral Analysis, 2021, 41(12):3682-3687. (in Chinese)

[14]
TEIXEIRA R S S, DA SILVA A S, FERREIRA-LEITÃO V S, et al. Amino acids interference on the quantification of reducing sugars by the 3,5-dinitrosalicylic acid assay mislead carbohydrase activity measurements[J]. Carbohydrate Research, 2012,363:33-37.

[15]
张朱珊莹, 顾瀚文, 谢凯文, 等. 基于近红外光谱的预处理及组合方法[J]. 激光与光电子学进展, 2021, 58(16):1617001.

ZHANG Z S Y, GU H W, XIE K W, et al. Pretreatment and combined method based on near infrared spectroscopy[J]. Laser & Optoelectronics Progress, 2021, 58(16):1617001. (in Chinese)

[16]
MORAIS C L M, SANTOS M C D, LIMA K M G, et al. Improving data splitting for classification applications in spectrochemical analyses employing a random-mutation Kennard-Stone algorithm approach[J]. Bioinformatics, 2019, 35(24):5257-5263.

[17]
杨盛杰. 机载式谷物水分近红外光谱检测系统原理样机开发与试验研究[D]. 硕士学位论文. 杭州: 浙江大学, 2018.

YANG S J. Development and experimental research on the principle prototype of vehicular grain moisture detection system using near infrared spectroscopy[D]. Master's Thesis. Hangzhou: Zhejiang University, 2018. (in Chinese)

[18]
康晓凤. 气候变化下不同发育模式在东北和华北玉米产区的适用性比较研究[D]. 硕士学位论文. 杨凌: 西北农林科技大学, 2022.

KANG X F. Applicability of phenological models in the main maize planting regions of Northeast and North China under climate change[D]. Master's Thesis. Yangling: Northwest A&F University, 2022. (in Chinese)

[19]
PASQUINI C. Near infrared spectroscopy:a mature analytical technique with new perspectives-a review[J]. Analytica Chimica Acta, 2018,1026:8-36.

[20]
BAO Y D, MI C X, WU N, et al. Rapid classification of wheat grain varieties using hyperspectral imaging and chemometrics[J]. Applied Sciences, 2019, 9(19):4119.

[21]
于旭峰, 李红梅, 卓伟, 等. 基于近红外光谱技术的马铃薯叶片含水率高效预测[J]. 光学仪器, 2020, 42(4):7-13.

YU X F, LI H M, ZHUO W, et al. Efficient determination of water content in potato leaves based on spectroscopy technology[J]. Optical Instruments, 2020, 42(4):7-13. (in Chinese)

[22]
陈帅帅. 近红外光谱用于快速分析制浆木片材性的研究[D]. 硕士学位论文. 南京: 南京林业大学, 2017.

CHEN S S. Application of near infrared spectroscopy to rapid analysis of pulp wood-chips properties[D]. Master's Thesis. Nanjing: Nanjing Forestry University, 2017. (in Chinese)

[23]
HEIN P R G, CAMPOS A C M, MENDES R F, et al. Estimation of physical and mechanical properties of agro-based particleboards by near infrared spectroscopy[J]. European Journal of Wood and Wood Products, 2011, 69(3):431-442.

[24]
RAMALHO F M G, SIMETTI R, ARRIEL T G, et al. Influence of particles size on NIR spectroscopic estimations of charcoal properties[J]. Florestae Ambiente, 2019, 26(1):e20180397.

[25]
曹明月, 李贤, 黄好强, 等. 近红外光谱检测青贮饲料的营养成分[J]. 现代牧业, 2020, 4(1):42-45.

CAO M Y, LI X, HUANG H Q, et al. Study on the nutritional components of silage with near infrared spectroscopy[J]. Modern Animal Husbandry, 2020, 4(1):42-45. (in Chinese)

[26]
PUCETTI P, VALADARES FILHO S D C, ROQUE J V, et al. Predicting ruminal degradability and chemical composition of corn silage using near-infrared spectroscopy and multivariate regression[J]. PLoS One, 2024, 19(4):e0296447.

[27]
DE BLEYE C, CHAVEZ P F, MANTANUS J, et al. Critical review of near-infrared spectroscopic methods validations in pharmaceutical applications[J]. Journal of Pharmaceutical and Biomedical Analysis, 2012,69:125-132.

[28]
GE R, QIAN X J, SUN B H, et al. In vitro starch digestibility of maize flour and maize extruded noodles based on different particle-size effects[J]. Journal of Cereal Science, 2023,114:103814.

[29]
沙米西努尔·牙森, 李晓荣, 蔡大润, 等. 玉米淀粉含量测定影响因素分析[J]. 新疆农业科学, 2023, 60(2):301-308.

SHAMIXINUER Y S, LI X R, CAI D R, et al. Analysis of influencing factors on corn starch content determination[J]. Xinjiang Agricultural Sciences, 2023, 60(2):301-308. (in Chinese)

[30]
PATIL M B. Radiation heat transfer in a particulate medium using a ray tracing method[D]. Master's Thesis. Baton Rouge: Louisiana State University and Agricultural & Mechanical College, 2015.

[31]
刘梦, 温纪平, 周文卓. 粒度与小麦粉品质关系的研究[J]. 食品研究与开发, 2022, 43(11):49-55.

LIU M, WEN J P, ZHOU W Z. Study of the relationship between particle size and wheat flour quality[J]. Food Research and Development, 2022, 43(11):49-55. (in Chinese)

文章导航

/