

1 材料与方法
1.1 试验动物与饲粮
表1 基础饲粮组成及营养水平(风干基础)Table 1 Composition and nutrient levels of the basal diet (air-dry basis) % |
| 项目Items | 含量Content | ||
|---|---|---|---|
| 原料Ingredients | |||
| 玉米Corn | 52.00 | ||
| 豆粕Soybean meal | 22.00 | ||
| 麸皮Bran | 10.00 | ||
| 菜籽粕Rapeseed meal | 3.00 | ||
| 磷酸氢钙CaHPO4 | 2.69 | ||
| 石粉Limestone | 8.85 | ||
| 食盐NaCl | 0.30 | ||
| 赖氨酸Lys | 1.02 | ||
| DL-蛋氨酸DL-Met | 0.10 | ||
| 预混料Premix1) | 0.04 | ||
| 合计Total | 100.00 | ||
| 营养水平Nutrient levels2) | |||
| 代谢能ME/(MJ/kg) | 10.50 | ||
| 粗蛋白质CP | 16.32 | ||
| 钙Ca | 3.62 | ||
| 总磷TP | 0.53 | ||
| 赖氨酸Lys | 0.83 | ||
| 蛋氨酸Met | 0.41 |
1)预混料为每千克饲粮提供The premix provided the following per kg of the diet:VA 2 000 IU,VD3 3 700 IU,VE 12.00 mg,VK 0.55 mg,VB1 0.55 mg,VB2 1.2 mg,VB6 0.85 mg,VB12 0.004 mg,烟酰胺 nicotinamide 8 mg,泛酸钙 calcium pantothenate 2 mg,生物素 biotin 0.025 mg,叶酸 folic acid 0.25 mg,胆碱 choline 80 mg,Fe 12 mg,Cu 2.2 mg,Mn 16 mg,Zn 14.5 mg,I 0.27 mg,Se 0.08 mg。 2)代谢能为计算值,其他营养水平为实测值。ME was a calculated value,while the other nutrient levels were measured values. |
1.2 指标测定
1.2.1 蛋壳质量常规测定
1.2.2 蛋壳超微结构测定
1.3 数据统计与分析
2 结果与分析
2.1 青壳蛋和白壳蛋蛋壳质量性状的比较
表2 蛋壳质量性状测定结果Table 2 Results of eggshell quality traits |
| 项目Items | 青壳蛋Green-shelled egg | 白壳蛋White-shelled egg | P值P-value |
|---|---|---|---|
| 蛋重EW/g | 73.29±5.63a | 71.34±4.40b | <0.001 |
| 蛋形指数ESI | 1.33±0.06 | 1.33±0.06 | 0.941 |
| 蛋壳厚度EST/mm | 0.36±0.00 | 0.36±0.00 | 0.360 |
| 蛋壳强度ESS/(kg/cm2) | 4.10±0.61a | 3.70±0.85b | <0.001 |
2.2 青壳蛋和白壳蛋蛋壳超微结构的比较
2.2.1 蛋壳内表面、外表面和横截面的超微结构
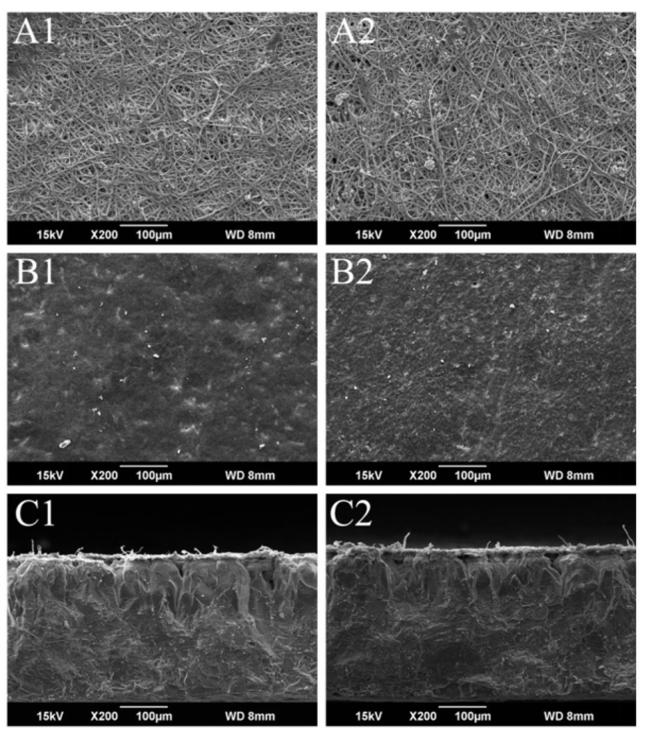
图1 蛋壳内表面、外表面和横断面电镜图A1:绿壳蛋蛋壳内表面;A2:白壳蛋蛋壳内表面;B1:绿壳蛋蛋壳外表面;B2:白壳蛋蛋壳外表面;C1:绿壳蛋蛋壳横截面;C2:白壳蛋蛋壳横截面。 Fig.1 Electron microscope images of inner surface, outer surface and cross section of eggshells (200×) A1: inner surface of green-shelled eggshell; A2: inner surface of white-shelled eggshell; B1: outer surface of green-shelled eggshell; B2: outer surface of white-shelled eggshell; C1: cross section of green-shelled eggshell; C2: cross section of white-shelled eggshell. |
2.2.2 蛋壳乳突层顶部、栅栏层和晶体层的超微结构
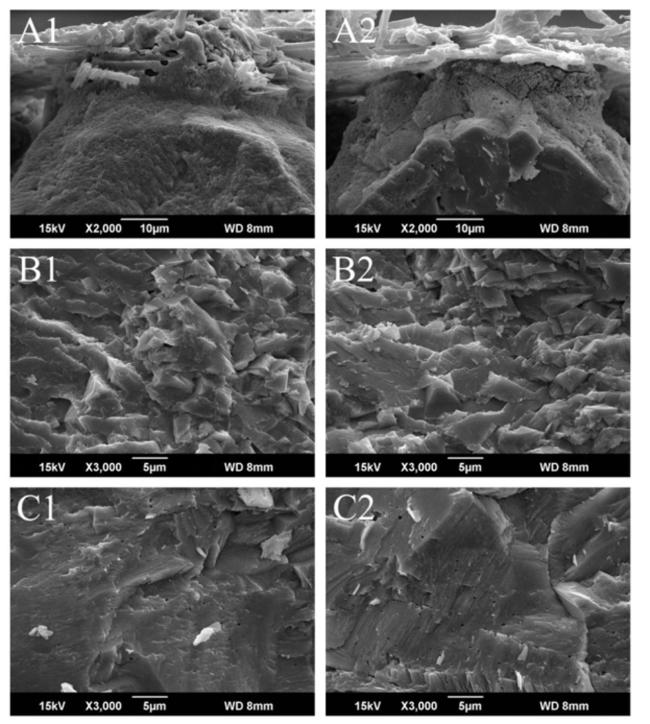
图2 蛋壳乳突层顶部、栅栏层和晶体层电镜图A1:绿壳蛋蛋壳乳突层顶部(2 000×);A2:白壳蛋蛋壳乳突层顶部(2 000×);B1:绿壳蛋蛋壳栅栏层(3 000×);B2:白壳蛋蛋壳栅栏层(3 000×);C1:绿壳蛋蛋壳晶体层(3 000×);C2:白壳蛋蛋壳晶体层(3 000×)。 Fig. 2 Electron microscope images of top of mastoid layer, palisade layer and crystal layer of eggshells A1: top of mastoid layer of green-shelled eggshell (2 000×); A2: top of mastoid layer of white-shelled eggshell (2 000×); B1: palisade layer of green-shelled eggshell (3 000×); B2: palisade layer of white-shelled eggshell (3 000×); C1: crystal layer of green-shelled eggshell (3 000×); C2: crystal layer of white-shelled eggshell (3 000×). |
表3 2种蛋壳超微结构的比较Table 3 Comparison of ultrastructure of two eggshells μm |
| 项目Items | 青壳蛋Green-shelled egg | 白壳蛋White-shelled egg | P值P-value |
|---|---|---|---|
| 乳突间隙MG | 52.39±13.70b | 61.48±12.48a | <0.001 |
| 有效厚度ET | 288.97±18.95a | 266.41±24.07b | <0.001 |
2.3 蛋壳质量性状相关性分析
表4 蛋壳质量性状相关性分析结果Table 4 Results of correlation analysis of eggshell quality traits |
| 种类 Types | 性状 Traits | 统计量 Statistics | 蛋壳强度 ESS | 乳突间隙 MG | 有效厚度 ET |
|---|---|---|---|---|---|
青壳蛋 Green-shelled egg | 蛋壳强度 ESS | r P | 1.000 | -0.781** <0.001 | 0.848** <0.001 |
| 乳突间隙 MG | r P | 1.000 | -0.593** <0.001 | ||
| 有效厚度 ET | r P | 1.000 | |||
白壳蛋 White-shelled egg | 蛋壳强度 ESS | r P | 1.000 | -0.657** <0.001 | 0.708** <0.001 |
| 乳突间隙 MG | r P | 1.000 | -0.515** <0.001 | ||
| 有效厚度 ET | r P | 1.000 |
r:相关系数;P:P值。“**”表示显著相关(P<0.05)。 | |
r: correlation coefficient; P: P-value. “**” indicated significant correlation (P<0.05). |
 京公网安备 11010802041926号


