

1 材料与方法
1.1 试验材料
1.2 试验设计
表1 基础饲粮组成及营养水平(干物质基础)Table 1 Composition and nutrient levels of the basal diet (DM basis) % |
| 项目Items | 含量Content | ||
|---|---|---|---|
| 原料Ingredients | |||
| 玉米Corn | 23.94 | ||
| 全棉籽Whole cottonseed | 4.84 | ||
| 膨化大豆Expand soybean | 3.68 | ||
| 青贮玉米Corn silage | 20.18 | ||
| 苜蓿Alfalfa hay | 15.76 | ||
| 燕麦草Oat grass | 5.04 | ||
| 啤酒糟Brewers grain | 2.91 | ||
| 焦糖Caramel | 0.89 | ||
| 甜菜粕Sugar beet meal | 3.52 | ||
| 豆粕Soybean meal | 12.91 | ||
| 菜籽粕Rapeseed meal | 1.15 | ||
| 玉米干酒糟及其可溶物Corn DDGS | 2.32 | ||
| 脂肪酸钙Fatty acid calcium | 0.41 | ||
| 预混料Premix1) | 0.91 | ||
| 磷酸氢钙CaHPO4 | 0.42 | ||
| 小苏打NaHCO3 | 0.64 | ||
| 食盐NaCl | 0.42 | ||
| 石粉Limestone | 0.06 | ||
| 合计Total | 100.00 | ||
| 营养水平Nutrient levels2) | |||
| 代谢能ME/(MJ/kg) | 11.35 | ||
| 泌乳净能NEL/(MJ/kg) | 7.31 | ||
| 粗蛋白质CP | 17.10 | ||
| 中性洗涤纤维NDF | 34.00 | ||
| 酸性洗涤纤维ADF | 19.59 | ||
| 粗脂肪EE | 5.56 | ||
| 粗灰分Ash | 7.73 | ||
| 钙Ca | 0.65 | ||
| 磷P | 0.45 |
1)预混料为每千克饲粮提供 Premix provided the following per kg of the diet: VA 5 130 IU, VD3 1 283 IU, VE 26 mg, 生物素 biotin 0.05 mg, β-胡萝卜素 β-carotene 0.10 mg, Mn 12 mg, S 0.85 mg, Zn 64 mg, Se 0.4 mg, Co 0.19 mg。 | |
2) 代谢能和产奶净能根据NRC(2001)计算得出,其余为测量值。粗蛋白质含量参照GB/T 6432—2018中方法测定,中性洗涤纤维含量参照GB/T 20806—2022中方法测定,酸性洗涤纤维含量参照NY/T 1459—2022中方法测定,粗脂肪含量参照GB/T 6433—2025中方法测定,粗灰分含量参照GB/T 6438—2025中方法测定,钙含量参照GB/T 6436—2018中方法测定,磷含量参照GB/T 6437—2018中方法测定。ME and NEL were calculated according to NRC (2001), while the others were measured. CP content was determined according to the method specified in GB/T 6432—2018, NDF content was determined according to the method specified in GB/T 20806—2022, ADF content was determined according to the method specified in NY/T 1459—2022, EE content was determined according to the method specified in GB/T 6433—2025, Ash content was determined according to the method specified in GB/T 6438—2025, Ca content was determined according to the method specified in GB/T 6436—2018, P content was determined according to the method specified in GB/T 6437—2018. |
1.3 样品采集及测定方法
1.3.1 产奶量及乳品质测定
1.3.2 血清生化及抗氧化指标测定
1.3.3 瘤胃发酵参数和16S rRNA检测
1.4 数据统计与分析
2 结果与分析
2.1 复合微生态氨同化菌剂对奶牛产奶性能的影响
表2 复合微生态氨同化菌剂对奶牛产奶性能的影响Table 2 Effects of a complex microecological ammonia-assimilating bacterial agent on milk production performance of dairy cows |
| 项目 Items | 复合微生态氨同化菌剂添加量 Dosage of complex microecological ammonia-assimilating bacterial agent/(mL/d) | P值P-value | ||||||
|---|---|---|---|---|---|---|---|---|
| 0(对照 Control) | 100 | 200 | 300 | PT | PL | PQ | ||
| 日产奶量 Daily milk yield/kg | 41.80±0.42b | 45.17±0.48a | 42.93±0.41b | 42.67±0.33b | 0.013 | 0.004 | 0.524 | |
| 乳脂率 Milk fat percentage/% | 3.86±0.07 | 3.90±0.05 | 3.77±0.07 | 3.80±0.03 | 0.834 | 0.909 | 0.545 | |
| 乳蛋白率 Milk protein percentage/% | 3.12±0.01b | 3.11±0.01b | 3.11±0.01b | 3.19±0.01a | 0.022 | 0.004 | 0.685 | |
| 乳糖率 Lactose percentage/% | 5.00±0.05 | 4.95±0.05 | 4.95±0.04 | 4.98±0.05 | 0.832 | 0.970 | 0.599 | |
| 总固形物含量 Total solid content/(mg/L) | 11.93±0.17 | 11.87±0.10 | 11.80±0.21 | 11.87±0.19 | 0.918 | 0.843 | 0.968 | |
| 尿素氮含量 Urea nitrogen content/(mmol/mL) | 11.91±0.19 | 11.64±0.35 | 12.10±0.33 | 13.51±3.50 | 0.764 | 0.440 | 0.990 | |
| 体细胞数 Somatic cell count/ (×103个/mL) | 193.88±79.68 | 128.18±16.02 | 186.90±55.83 | 87.92± 21.38 | 0.119 | 0.039 | 0.447 | |
同行数据肩标不同字母表示差异显著(P<0.05)。PT、PL和PQ分别表示单因素方差分析、一次线性效应和二次曲线效应的P值。下表同。 | |
In the same row, values with different letter superscripts mean significant difference (P<0.05). PT, PL, and PQ represented the P-values for one-way ANOVA, linear effect, and quadratic effect, respectively. The same as below. |
2.2 复合微生态氨同化菌剂对奶牛血清生化指标的影响
表3 复合微生态氨同化菌剂对奶牛血清生化指标的影响Table 3 Effects of a complex microecological ammonia-assimilating bacterial agent on serum biochemical indices of dairy cows |
| 项目 Items | 复合微生态氨同化菌剂添加量 Dosage of complex microecological ammonia-assimilating bacterial agent/(mL/d) | P值P-value | ||||||
|---|---|---|---|---|---|---|---|---|
| 0(对照 Control) | 100 | 200 | 300 | PT | PL | PQ | ||
| 总蛋白TP/(g/L) | 78.36±1.98b | 88.46±2.15a | 80.12±1.67b | 78.61±1.69b | 0.001 | <0.001 | 0.832 | |
| 白蛋白ALB/(g/L) | 28.66±0.73b | 32.09±0.59a | 30.59±0.65a | 30.85±0.53a | <0.001 | <0.001 | 0.890 | |
| 球蛋白GLB/(g/L) | 50.49±1.88ab | 55.22±1.91a | 47.88±1.62b | 45.39±1.32b | 0.001 | 0.004 | 0.037 | |
| 白球比White globule ratio | 0.56±0.02b | 0.57±0.02b | 0.66±0.02a | 0.64±0.02a | 0.006 | 0.009 | 0.763 | |
| 葡萄糖GLU/(mmol/L) | 3.51±0.10 | 3.66±0.08 | 3.63±0.08 | 3.62±0.06 | 0.552 | 0.348 | 0.960 | |
2.3 复合微生态氨同化菌剂对奶牛血清抗氧化指标的影响
表4 复合微生态氨同化菌剂对奶牛血清抗氧化指标的影响Table 4 Effects of a complex microecological ammonia-assimilating bacterial agent on serum antioxidant indices of dairy cows |
| 项目 Items | 复合微生态氨同化菌剂添加量 Dosage of complex microecological ammonia-assimilating bacterial agent/(mL/d) | P值P-value | ||||||
|---|---|---|---|---|---|---|---|---|
| 0(对照 Control) | 100 | 200 | 300 | PT | PL | PQ | ||
| 丙二醛MDA/(nmol/mL) | 2.75±0.08a | 2.64±0.07a | 2.30±0.08b | 2.44±0.05b | <0.001 | <0.001 | 0.231 | |
| 谷胱甘肽过氧化物酶 GSH-Px/(U/mL) | 244.65±5.86 | 232.28±7.09 | 238.56±5.89 | 225.09±7.91 | 0.160 | 0.052 | 0.774 | |
2.4 复合微生态氨同化菌剂对奶牛瘤胃发酵参数的影响
表5 复合微生态氨同化菌剂对奶牛瘤胃发酵参数的影响Table 5 Effects of a complex microecological ammonia-assimilating bacterial agent on rumen fermentation parameters of dairy cows |
| 项目 Items | 复合微生态氨同化菌剂添加量 Dosage of complex microecological ammonia-assimilating bacterial agent/(mL/d) | P值P-value | ||||||
|---|---|---|---|---|---|---|---|---|
| 0(对照 Control) | 100 | 200 | 300 | PT | PL | PQ | ||
| 乙酸Acetic acid/% | 59.97±1.41 | 56.86±1.40 | 59.49±1.53 | 56.77±3.35 | 0.167 | 0.128 | 0.875 | |
| 丙酸Propionic acid/% | 19.17±0.41b | 23.24±1.30a | 19.79±1.40ab | 23.73±2.38a | 0.031 | 0.008 | 0.642 | |
| 异丁酸Isobutyric acid/% | 8.16±0.45 | 7.92±0.14 | 8.21±0.24 | 7.30±0.72 | 0.377 | 0.201 | 0.897 | |
| 丁酸Butyric acid/% | 1.27±0.04a | 0.99±0.09b | 1.33±0.21a | 1.01±0.07b | 0.014 | 0.003 | 0.595 | |
| 异戊酸Isovaleric acid/% | 1.04±0.05 | 1.13±0.07 | 1.03±0.07 | 1.21±0.20 | 0.487 | 0.207 | 0.979 | |
| 戊酸Pentanoic acid/% | 10.38±1.47 | 10.28±1.26 | 10.15±0.53 | 9.99±1.51 | 0.986 | 0.854 | 0.950 | |
| 乙丙比 Acetic acid/propionic acid | 3.14±0.12a | 2.33±0.11b | 3.06±0.30a | 2.48±0.43ab | 0.017 | 0.003 | 0.241 | |
2.5 复合微生态氨同化菌剂对奶牛瘤胃微生物丰富度和多样性的影响
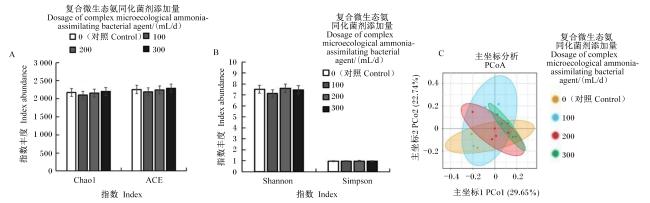
图1 复合微生态氨同化菌剂对奶牛瘤胃微生物alpha多样性(A、B)和beta多样性(C)的影响数据柱标注无字母表示差异不显著(P>0.05)。The absence of letters in the data column labels indicated an insignificant difference (P>0.05). Fig.1 Effects of a complex microecological ammonia-assimilating bacterial agent on alpha diversity (A, B) and beta diversity (C) of rumen microorganisms of dairy cows |
2.6 复合微生态氨同化菌剂对奶牛瘤胃微生物组成的影响
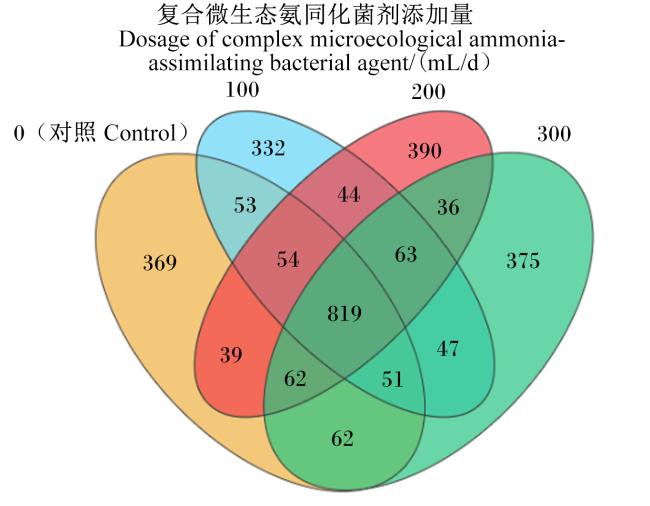
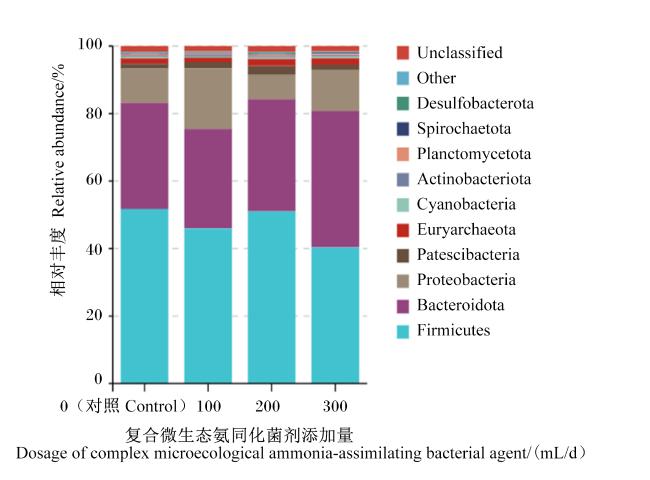
图3 门水平微生物组成柱形图(相对丰度>1%)Unclassified:未分类;Other:其他;Desulfobacterota:脱硫杆菌门;Spirochaetota:螺旋体门;Planctomycetota:浮霉菌门;Actinobacteriota:放线菌门;Cyanobacteria:蓝藻门;Euryarchaeota:广古菌门;Patescibacteria:袖珍菌门;Proteobacteria:变形菌门;Bacteroidota:拟杆菌门;Firmicutes:厚壁菌门。 Fig.3 Histogram of microbial composition at phylum level (relative abundance>1%) |
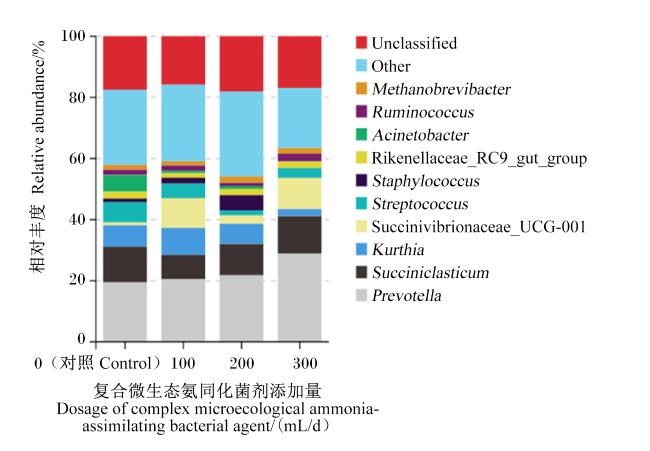
图4 属水平微生物组成柱形图(相对丰度>1%)Unclassified:未分类;Other:其他;Methanobrevibacter:短甲烷杆菌属;Ruminococcus:瘤胃球菌属;Acinetobacter:不动杆菌属;Rikenellaceae_RC9_gut_group:理研菌科RC9肠道群;Staphylococcus:葡萄球菌属;Streptococcus:链球菌属;Succinivibrionaceae_UCG-001:琥珀振动杆菌科UCG-001;Kurthia:库尔特氏菌属;Succiniclasticum:琥珀酸分解菌属;Prevotella:普雷沃氏菌属。 Fig.4 Histogram of microbial composition at genus level (relative abundance>1%) |
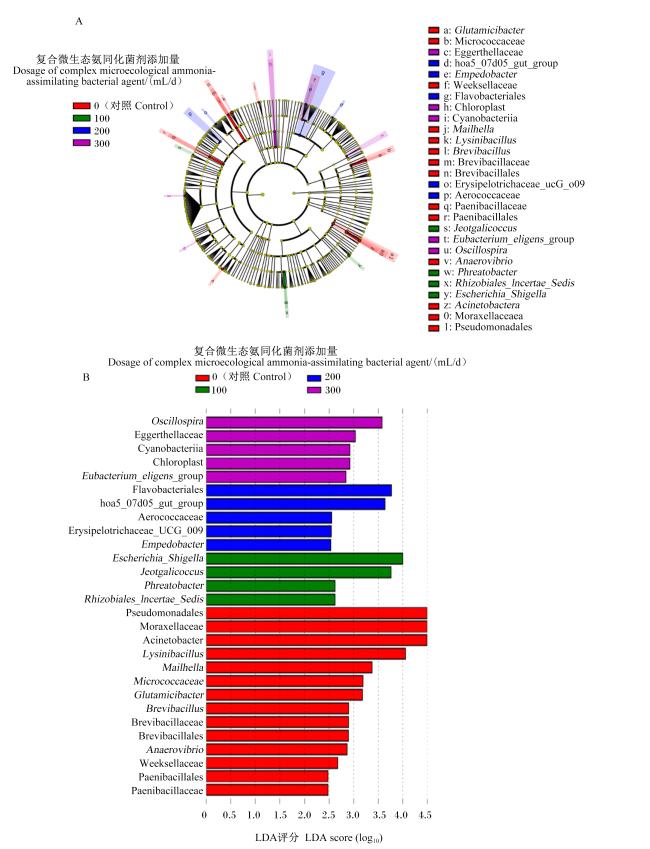
图5 奶牛瘤胃LEfSe分析的进化分支图(A)和差异物种柱状图(B)Glutamicibacter:谷氨酸杆菌属;Micrococcaceae:微球菌科;Eggerthellaceae:埃格特氏菌科;hoa5_07d05_gut_group: hoa5_07d05肠道群;Empedobacter:埃姆佩多杆菌属;Weeksellaceae:维克氏菌科;Flavobacteriales:黄杆菌目;Chloroplast:叶绿体;Cyanobacteria:蓝藻门;Mailhella:马伊尔氏菌属;Lysinibacillus:溶杆菌属;Brevibacillus:短杆菌属;Brevibacillaceae:短杆菌科;Brevibacillales:短杆菌目;Erysipelotrichaceae_UCG_009:丹毒丝菌科UCG_009;Aerococcaceae:气球球菌科;Paenibacillaceae:类芽孢杆菌科;Paenibacillales:类芽孢杆菌目;Jeotgalicoccus:腌制球菌属;Eubacterium_eligens_group:真杆菌eligens群;Oscillospira:振荡螺旋菌属;Anaerovibrio:厌氧弯菌属;Phreatobacter:地下水杆菌属;Rhizobiales_Incertae_Sedis:根瘤菌目未定属;Escherichia_Shigella: 埃希氏菌-志贺氏菌属;Acinetobacter:不动杆菌属;Moraxellaceae:莫拉菌科;Pseudomonadales:假单胞菌目。 Fig.5 Cladogram (A) and differential species histogram (B) of rumen LEfSe analyses of dairy cows |
2.7 复合微生态氨同化菌剂对奶牛瘤胃微生物功能代谢通路的影响
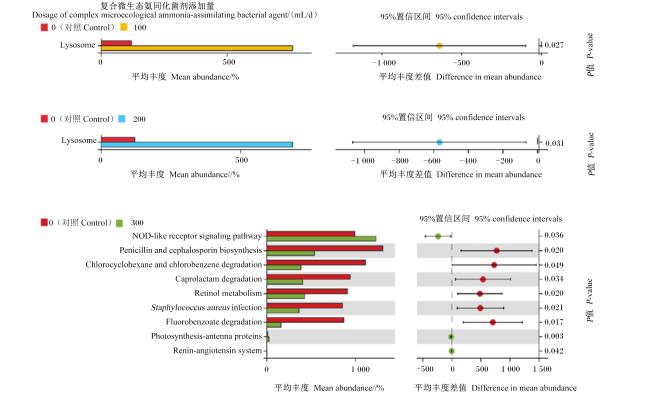
图6 KEGG Level 3差异代谢通路的平均丰度和差异代谢通路平均丰度的差异比较Lysosome:溶酶体;NOD-like receptor signaling pathway:NOD样受体信号通路;Penicillin and cephalosporin biosynthesis:青霉素和头孢菌素生物合成;Chlorocyclohexane and chlorobenzene degradation:氯环己烷和氯苯降解;Caprolactam degradation:己内酰胺降解;Retinol metabolism:视黄醇代谢;Staphylococcus aureus infection:金黄色葡萄球菌感染;Fluorobenzoate degradation:氟苯甲酸降解;Photosynthesis-antenna proteins:光合作用-天线蛋白;Renin-angiotensin system:肾素-血管紧张素系统。 P<0.05表示该通路在对照组与试验组之间差异显著。P<0.05 indicated a significant difference in this pathway between the control group and the experimental group. Fig.6 Comparison of mean abundance of KEGG Level 3 differential metabolic pathways and differences in mean abundance of differential metabolic pathways |
 京公网安备 11010802041926号


