

1 材料与方法
1.1 试验材料
1.2 试验设计
1.3 试验方法
1.3.1 细胞培养
1.3.2 细胞活力的测定
1.3.3 细胞内ROS水平的测定
1.3.4 细胞形态观察
1.3.5 细胞内抗氧化指标的测定
1.3.6 细胞内HSP70和HSP90含量的测定
1.3.7 细胞内热应激相关基因表达的检测
1.3.7.1 引物设计与合成
表1 引物信息Table 1 Primer information |
| 基因 Genes | 登录号 Accession number | 正向引物 Forward primer (5'—3') | 反向引物 Reverse primer (5'—3') | 产物长度 Product length/bp |
|---|---|---|---|---|
| 热休克蛋白A6 HSPA6 | NM_002155.5 | GGGGAGGACAAGGCGTTTTA | CCCACCCAGGTCGAAAATGA | 282 |
| 热休克蛋白A1A HSPA1A | NM_203322.3 | TTGATCCTGTGGGCCGTTTT | CTGGTCGTTGGCGATGATCT | 163 |
| 热休克蛋白AA1 HSPAA1 | NM_001012670.2 | GTTATGACTGCATGTGCCAGG | ACCTTTCCAGCGGCTTTACA | 164 |
| 热休克蛋白A8 HSPA8 | NM_174345.4 | TTGGTGGCTCAACCCGTATC | CTGCGTCTGCTTGGTAGGAA | 269 |
| 甘油醛-3-磷 酸脱氢酶 GADPH | NM_001034034.2 | GGTCACCAGGGCTGCTTTTA | CCAGCATCACCCCACTTGAT | 222 |
1.3.7.2 总RNA提取与cDNA合成
1.3.7.3 荧光定量PCR
1.4 数据统计与分析
2 结果与分析
2.1 不同处理温度及时间对细胞活力的影响
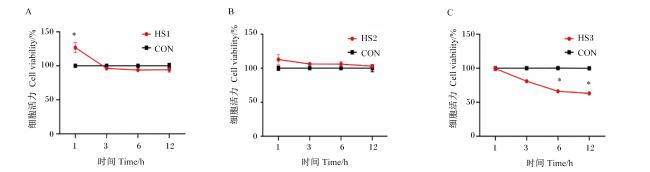
图1 不同处理温度及时间对细胞活力的影响CON:CON组;HS1:HS1组;HS2:HS2组;HS3:HS3组。下图同。41和42 ℃下,各处理时间的细胞活力均高于90%;43 ℃下,处理6~12 h时细胞活力低于80%。“*”表示差异显著(P<0.05)。 Fig.1 Effects of different treatment temperatures and time on cell viability (n=3) CON: CON group; HS1: HS1 group; HS2: HS2 group; HS3: HS3 group. The same as below. Under both 41 and 42 ℃, the cell viability remains above 90% at all time points. However, under 43 ℃, the cell viability drops below 80% at 6 and 12 h. “*” indicates a significant difference (P<0.05). |
2.2 不同处理温度及时间对细胞内ROS水平的影响
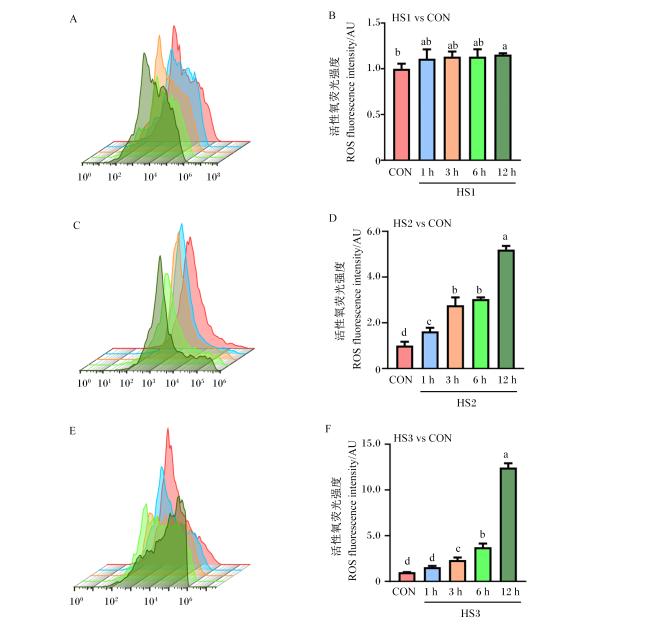
图2 不同处理温度及时间对细胞内ROS水平的影响图A、C和E为不同温度下的流式细胞仪图,图B、D和F为ROS荧光强度统计分析图(流式图A、C和E中的荧光强度峰面积分别对应统计图B、D和F中相应颜色数据柱)。数据柱标相同小写字母表示差异不显著(P>0.05),不同小写字母表示差异显著(P<0.05)。 Fig.2 Effects of different treatment temperatures and time on ROS level in cells (n=3) Figures A, C, and E are flow cytometry graphs under different temperatures. Figures B, D, and F are statistical analysis graphs of ROS fluorescence intensity (the fluorescence intensity peak area in the flow cytometry graphs A, C, and E corresponds to the respective color data column in the statistical graphs B, D, and F). The same lowercase letters on the data bars indicate no significant difference (P>0.05), while different lowercase letters indicate significant difference (P<0.05). |
2.3 43 ℃下不同处理时间对细胞形态的影响
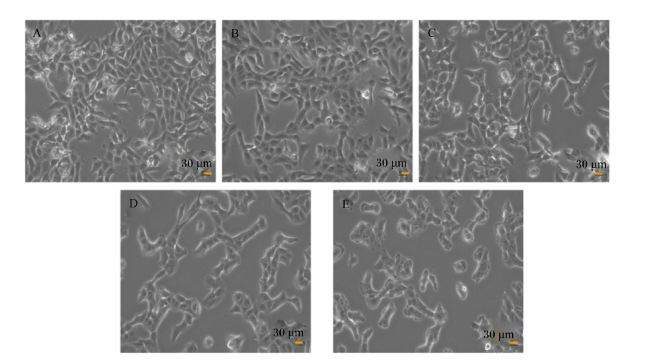
图3 43 ℃下不同处理时间对细胞形态的影响图A为未进行热应激处理(37 ℃,CON组)的细胞形态,图B为43 ℃下处理1 h的细胞形态,图C为43 ℃下处理3 h的细胞形态,图D为43 ℃下处理6 h的细胞形态,图E为43 ℃下处理12 h的细胞形态。细胞图像在显微镜下拍摄,比例尺为30 μm。 Fig.3 Effects of different treatment time on cell morphology at 43 ℃ Figure A shows the cell morphology without heat stress treatment (at 37 ℃, CON group), figure B shows the cell morphology after treatment at 43 ℃ for 1 h, figure C shows the cell morphology after treatment at 43 ℃ for 3 h, figure D shows the cell morphology after treatment at 43 ℃ for 6 h, and figure E shows the cell morphology after treatment at 43 ℃ for 12 h. The cell images were obtained under a microscope with a scale bar of 30 μm. |
2.4 热应激对细胞内抗氧化指标的影响
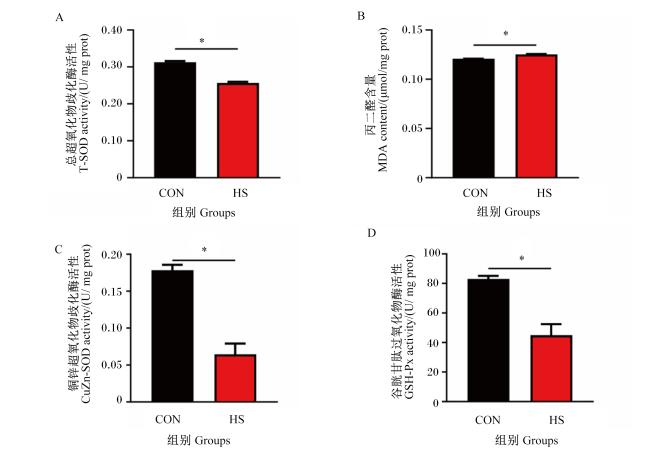
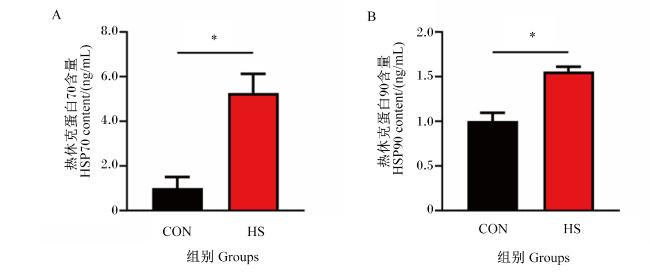
图4 热应激对细胞内抗氧化指标的影响CON组细胞维持在37 ℃,HS组细胞在43 ℃下处理6 h。*表示差异显著(P<0.05)。图5、图7同。 Fig.4 Effects of heat stress on antioxidant indexes in cells (n=3) Cells in the CON group were maintained at 37 ℃, while those in the HS group were treated at 43 ℃ for 6 h. “*” indicates a significant difference (P<0.05). The same as Fig.5 and Fig.7. |
2.5 热应激对细胞内HSP70和HSP90含量的影响
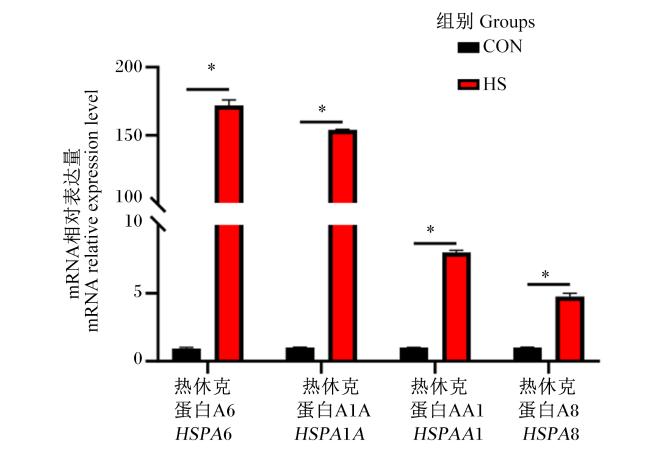
2.6 热应激对细胞内热应激相关基因表达的影响
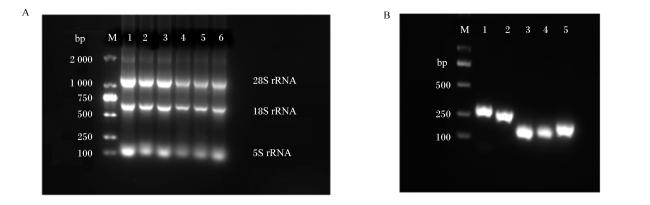
图6 总RNA电泳图及实时荧光定量PCR扩增结果图A中,泳道M为2000 DNA Marker,泳道1~3为CON组(37 ℃),泳道4~6为HS组(43 ℃,6 h);图B中,泳道M为2000 DNA Marker;泳道1为HSPA6,泳道2为HSPA8,泳道3为HSPAA1,泳道4为HSPA1A,泳道5为GAPDH。 Fig.6 Total RNA electropherogram and RT-qPCR amplification results In figure A, lane M is 2000 DNA Marker, lanes 1 to 3 stand for CON group (37 ℃), and lanes 4 to 6 stand for HS group (43 ℃, 6 h); In figure B, lane M stand for 2000 DNA Marker, lane 1 stand for HSPA6, lane 2 stand for HSPA8, lane 3 stand for HSPA1A, lane 4 stand for HSPA1A, and lane 5 stand for GAPDH. |
 京公网安备 11010802041926号


