

1 材料与方法
1.1 伦理声明
1.2 试验设计
1.3 饲养管理
1.4 样品采集与指标测定
1.4.1 瘤胃液的采集与前处理
1.4.2 瘤胃发酵参数测定
1.4.3 瘤胃菌群结构测定
1.5 数据统计与分析
2 结果与分析
2.1 白蒺藜副产物对滩羊瘤胃发酵参数的影响
表1 白蒺藜副产物对滩羊瘤胃发酵参数的影响Table 1 Effects of Tribulus terrestris by-products on rumen fermentation parameters of Tan sheep (n=6) |
| 项目 Items | 对照组 Control group | 试验Ⅰ组 Trial group Ⅰ | 试验Ⅱ组 Trial group Ⅱ | 试验Ⅲ组 Trial group Ⅲ | P值 P-value |
|---|---|---|---|---|---|
| pH | 6.31±0.18 | 6.57±0.13 | 6.74±0.25 | 6.53±0.47 | 0.121 |
| 氨态氮NH3-N/(mg/dL) | 8.70±0.59Cc | 10.96±2.08Cc | 13.91±2.65Bb | 17.56±1.90Aa | <0.001 |
| 总挥发性脂肪酸TVFA/(mmol/L) | 68.04±4.22Aa | 65.38±1.70Aa | 37.29±0.74Cc | 54.47±1.72Bb | <0.001 |
| 各挥发性脂肪酸的摩尔比例Molar ratio of each VFA/% | |||||
| 乙酸Acetate | 64.24±2.10Bb | 65.42±1.72Bb | 74.06±0.74Aa | 72.45±1.93Aa | <0.001 |
| 丙酸Propionate | 25.26±1.54Bb | 27.64±1.58Aa | 17.31±0.83Cc | 18.35±1.65Cc | <0.001 |
| 丁酸Butyrate | 8.64±0.85Aa | 5.83±0.52Cc | 7.13±0.21Bb | 7.65±0.41Bb | <0.001 |
| 异丁酸Isobutyrate | 0.54±0.10Aa | 0.36±0.05Bb | 0.35±0.01Bb | 0.50±0.06Aa | <0.001 |
| 戊酸Valerate | 0.72±0.06Bb | 0.48±0.02Dd | 0.82±0.03Aa | 0.54±0.02Cc | <0.001 |
| 异戊酸Isovalerate | 0.61±0.33a | 0.27±0.04c | 0.33±0.01bc | 0.51±0.19ab | 0.020 |
| 乙酸/丙酸Acetate/propionate | 2.56±0.23Bb | 2.38±0.20Bb | 4.29±0.25Aa | 3.98±0.47Aa | <0.001 |
同行数据肩标无字母或相同小写字母表示差异不显著(P>0.05),不同小写字母表示差异显著(P<0.05),不同大写字母表示差异极显著(P<0.01)。下表同。 | |
In the same row, values with no letter or the same small letter superscripts mean no significant difference (P>0.05), while with different small letter superscripts mean significant difference (P<0.05), and with different capital letter superscripts mean extremely significant difference (P<0.01). The same as below. |
2.2 白蒺藜副产物对滩羊瘤胃菌群结构的影响
2.2.1 瘤胃液样本测序数据
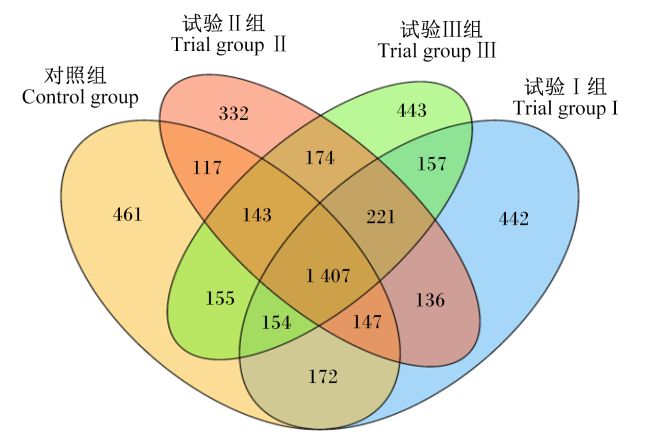
2.2.2 瘤胃菌群多样性分析
2.2.2.1 Alpha多样性
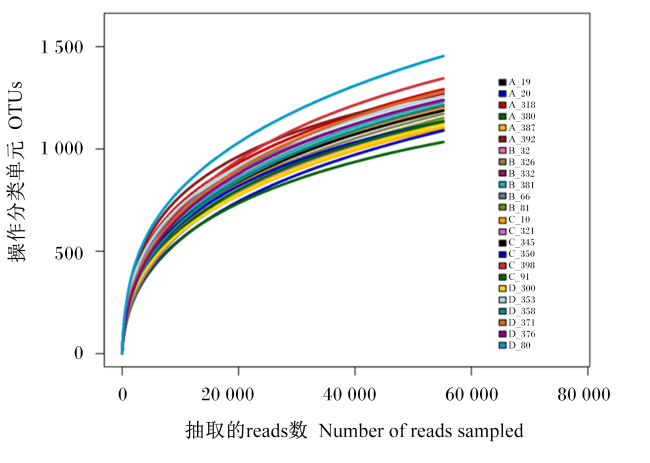
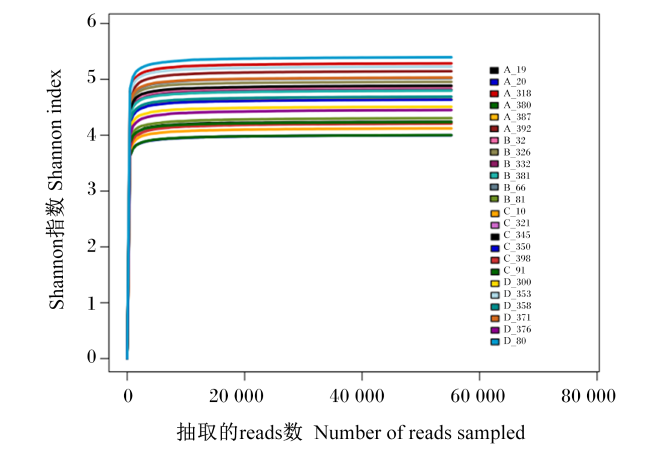
2.2.2.2 Beta多样性
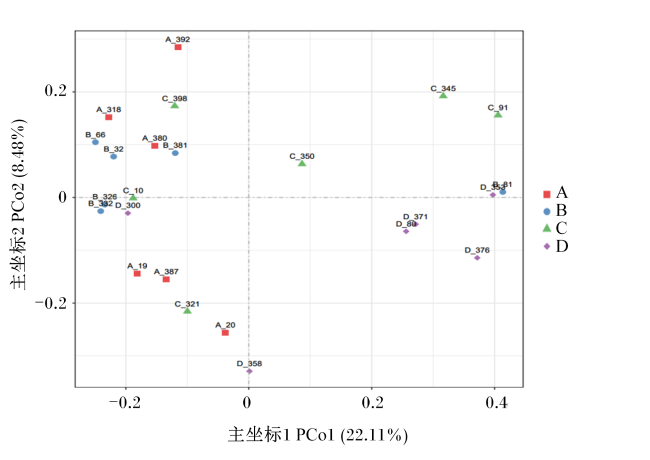
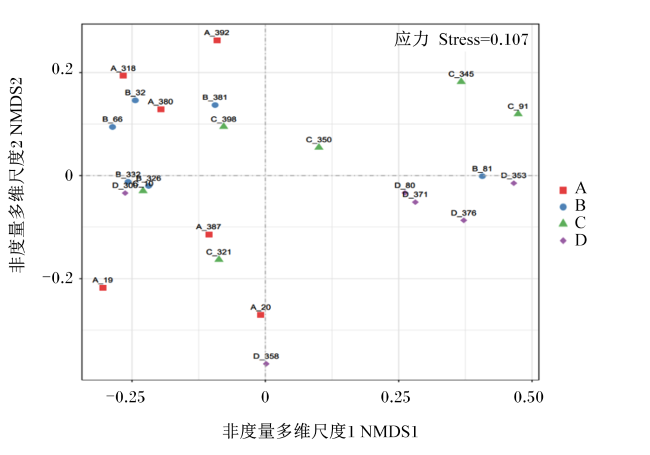
表2 白蒺藜副产物对滩羊瘤胃菌群Alpha多样性指数的影响Table 2 Effects of Tribulus terrestris by-products on rumen microflora Alpha diversity indexes of Tan sheep |
| 项目 Items | 对照组 Control group | 试验Ⅰ组 Trial group I | 试验Ⅱ组 Trial group Ⅱ | 试验Ⅲ组 Trial group Ⅲ | P值 P-value |
|---|---|---|---|---|---|
| Observed_species指数 Observed_species index | 1 148.48±105.33 | 1 211.63±46.24 | 1 188.15±82.37 | 1 261.43±109.63 | 0.206 |
| Chao1指数Chao1 index | 1 491.38±153.70 | 1 581.22±46.71 | 1 534.12±92.69 | 1 642.59±176.73 | 0.235 |
| Shannon指数Shannon index | 6.57±0.82 | 6.92±0.37 | 6.33±0.44 | 7.04±0.57 | 0.154 |
| Simpson指数Simpson index | 0.96±0.03 | 0.98±0.01 | 0.96±0.02 | 0.98±0.01 | 0.099 |
| PD_whole_tree指数 PD_whole_tree index | 109.57±10.52 | 117.66±8.31 | 110.11±9.37 | 114.93±5.90 | 0.333 |
| 覆盖度Coverage | 0.99±0.00 | 0.99±0.00 | 0.99±0.00 | 0.99±0.00 | 0.990 |
2.2.3 瘤胃菌群物种组成分析
2.2.3.1 门水平菌群物种组成
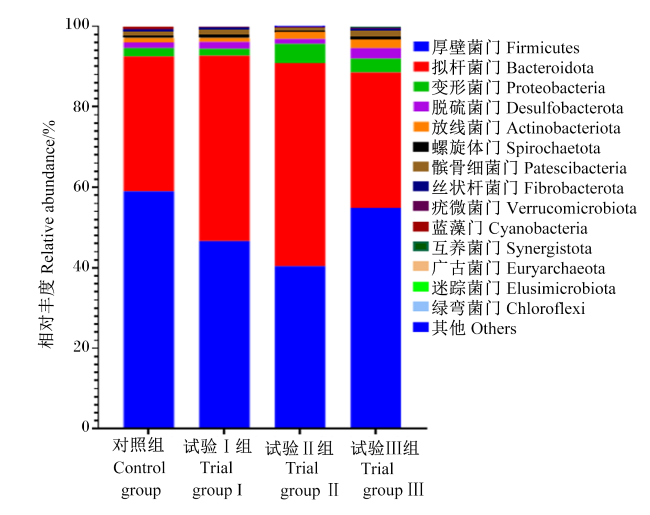
图6 滩羊瘤胃菌群门水平组成柱形图Fig.6 Histogram of composition of rumen microflora at phylum level of Tan sheep |
表3 白蒺藜副产物对滩羊瘤胃菌群门水平相对丰度的影响Table 3 Effects of Tribulus terrestris by-products on relative abundance of rumen microflora at phylum level of Tan sheep % |
| 项目 Items | 对照组 Control group | 试验Ⅰ组 Trial group Ⅰ | 试验Ⅱ组 Trial group Ⅱ | 试验Ⅲ组 Trial group Ⅲ | P值 P-value |
|---|---|---|---|---|---|
| 厚壁菌门Firmicutes | 59.03±12.47a | 46.68±4.78ab | 40.40±9.94b | 54.92±14.18a | 0.035 |
| 拟杆菌门Bacteroidota | 33.47±12.12b | 46.05±4.72ab | 50.46±9.71a | 33.63±13.21b | 0.020 |
| 变形菌门Proteobacteria | 2.09±1.19b | 1.68±0.55b | 4.76±2.15a | 3.41±2.46ab | 0.027 |
| 脱硫菌门Desulfobacterota | 1.38±0.90 | 1.73±0.67 | 1.23±0.78 | 2.61±1.27 | 0.078 |
| 放线菌门Actinobacteriota | 1.14±1.14 | 0.98±0.75 | 1.77±1.73 | 2.15±1.84 | 0.470 |
| 髌骨细菌门Patescibacteria | 1.07±0.58 | 1.24±0.98 | 0.57±0.40 | 1.57±1.04 | 0.211 |
| 螺旋体门Spirochaetota | 0.59±0.22 | 0.83±0.68 | 0.38±0.34 | 0.61±0.29 | 0.364 |
| 丝状杆菌门Fibrobacterota | 0.30±0.21 | 0.35±0.32 | 0.20±0.19 | 0.42±0.30 | 0.517 |
| 疣微菌门Verrucomicrobiota | 0.38±0.26 | 0.24±0.23 | 0.06±0.04 | 0.28±0.19 | 0.077 |
| 蓝藻门Cyanobacteria | 0.32±0.32 | 0.05±0.05 | 0.05±0.05 | 0.14±0.13 | 0.052 |
| 互养菌门Synergistota | 0.08±0.04 | 0.12±0.08 | 0.10±0.06 | 0.19±0.08 | 0.062 |
| 广古菌门Euryarchaeota | 0.12±0.11 | 0.05±0.04 | 0.05±0.04 | 0.04±0.02 | 0.101 |
| 迷踪菌门Elusimicrobiota | 0.01±0.01 | 0.00±0.00 | 0.02±0.02 | 0.02±0.01 | 0.094 |
| 绿弯菌门Chloroflexi | 0.01±0.01 | 0.01±0.00 | 0.01±0.01 | 0.00±0.00 | 0.576 |
| 其他Others | 0.01±0.01 | 0.01±0.00 | 0.01±0.01 | 0.00±0.00 | 0.482 |
2.2.3.2 属水平菌群物种组成
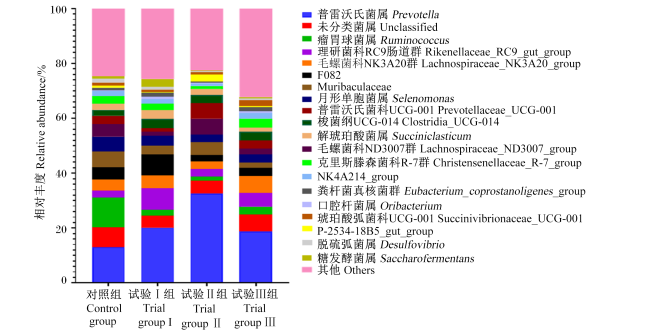
图7 滩羊瘤胃菌群属水平组成柱形图Fig.7 Histogram of composition of rumen microflora at genus level of Tan sheep |
表4 白蒺藜副产物对滩羊瘤胃菌群属水平相对丰度的影响Table 4 Effects of Tribulus terrestris by-products on relative abundance of rumen microflora at genus level of Tan sheep % |
| 项目 Items | 对照组 Control group | 试验Ⅰ组 Trial group Ⅰ | 试验Ⅱ组 Trial group Ⅱ | 试验Ⅲ组 Trial group Ⅲ | P值 P-value |
|---|---|---|---|---|---|
| 普雷沃氏菌属Prevotella | 12.95±9.29 | 20.12±12.19 | 32.60±18.55 | 18.82±14.28 | 0.133 |
| 未分类菌属Unclassified | 7.27±2.70 | 4.32±0.85 | 4.64±3.03 | 6.05±3.36 | 0.232 |
| 瘤胃球菌属Ruminococcus | 10.92±5.28Aa | 2.25±1.77Bb | 1.49±1.02Bb | 2.90±1.39Bb | <0.001 |
| 理研菌科RC9肠道群 Rikenellaceae_RC9_gut_group | 2.55±1.06 | 7.77±5.18 | 2.82±1.67 | 5.06±4.76 | 0.078 |
| 毛螺菌科NK3A20群 Lachnospiraceae_NK3A20_group | 3.90±1.96 | 4.70±1.59 | 2.77±1.41 | 6.08±3.57 | 0.119 |
| F082 | 4.58±2.95 | 7.69±5.68 | 2.20±1.93 | 3.02±1.24 | 0.053 |
| Muribaculaceae | 5.63±3.95 | 3.19±2.41 | 4.78±2.05 | 1.84±0.96 | 0.084 |
| 月形单胞菌属Selenomonas | 5.46±3.61 | 3.63±2.41 | 2.77±2.29 | 3.09±2.20 | 0.336 |
| 普雷沃氏菌科UCG-001 Prevotellaceae_UCG-001 | 4.58±3.19 | 1.40±0.92 | 5.81±5.28 | 2.04±2.03 | 0.100 |
| 梭菌纲UCG-014 Clostridia_UCG-014 | 3.09±2.24 | 1.24±0.87 | 5.59±5.22 | 2.98±2.20 | 0.142 |
| 解琥珀酸菌属Succiniclasticum | 2.10±0.76 | 3.42±2.56 | 2.95±2.20 | 3.24±1.93 | 0.674 |
| 毛螺菌科ND3007群 Lachnospiraceae_ND3007_group | 2.28±1.38 | 3.23±2.39 | 2.30±1.58 | 1.43±1.01 | 0.349 |
| 克里斯滕森菌科R-7群 Christensenellaceae_R-7_group | 2.68±2.55 | 2.28±1.81 | 1.04±0.60 | 3.33±3.18 | 0.369 |
| NK4A214_group | 1.93±1.08 | 1.83±0.78 | 0.85±0.72 | 1.99±1.70 | 0.286 |
| 粪杆菌真核菌群 Eubacterium_coprostanoligenes_group | 0.93±0.35 | 1.56±1.24 | 0.56±0.37 | 1.49±0.58 | 0.085 |
| 口腔杆菌属Oribacterium | 1.12±1.02b | 1.01±1.01b | 0.85±0.31b | 2.13±0.49a | 0.041 |
| 琥珀酸弧菌科UCG-001 Succinivibrionaceae_UCG-001 | 0.04±0.03Bb | 0.12±0.09Bb | 3.34±1.73Aa | 2.25±1.41Aa | <0.001 |
| P-2534-18B5_gut_group | 0.29±0.25 | 0.81±0.74 | 0.25±0.21 | 0.61±0.50 | 0.162 |
| 脱硫弧菌属Desulfovibrio | 1.02±0.87 | 1.18±0.56 | 0.84±0.47 | 2.19±1.28 | 0.057 |
| 糖发酵菌属Saccharofermentans | 0.96±0.85Bb | 2.86±1.38Aa | 0.17±0.11Bb | 0.55±0.49Bb | <0.001 |
| 其他Others | 25.73±9.66 | 25.41±3.63 | 21.39±7.36 | 28.92±5.93 | 0.346 |
2.2.4 生物标志物的筛选结果
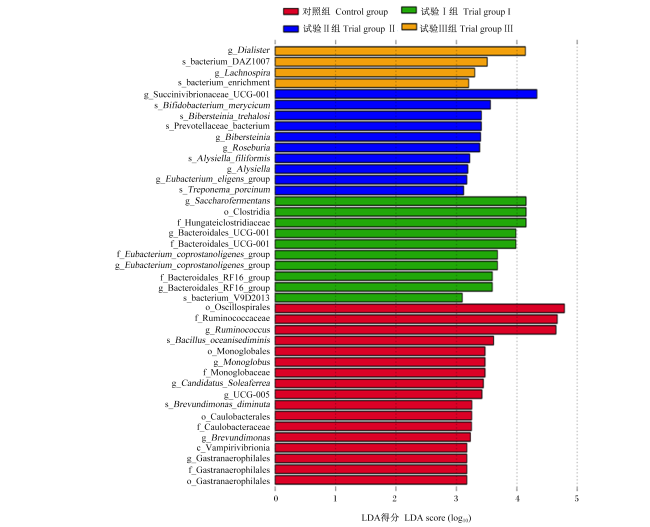
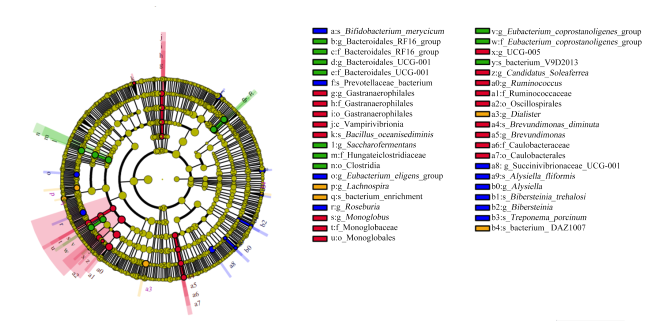
图8 瘤胃菌群LDA得分分布柱状图g_Dialister:g_戴阿利斯特杆菌属;s_bacterium_DAZ1007:s_细菌DAZ1007;g_Lachnospira:g_毛螺菌属;s_bacterium_enrichment:s_富集细菌;g_Succinivibrionaceae_UCG-001:g_琥珀酸弧菌科UCG-001;s_Bifidobacterium_merycicum:s_反刍双歧杆菌;s_Bibersteinia_trehalosi:s_海藻糖比伯斯坦菌;s_Prevotellaceae_bacterium:s_普雷沃氏菌科细菌;g_Bibersteinia:g_比伯斯坦菌属;g_Roseburia:g_罗氏菌属;s_Alysiella_filiformis:s_丝状小链菌;g_Alysiella:g_小链菌属;g_Eubacterium_eligens_group:g_挑剔真杆菌群;s_Treponema_porcinum:s_猪密螺旋体;g_Saccharofermentans:g_糖发酵菌属;o_Clostridia:o_梭菌纲;f_Hungateiclostridiaceae:f_亨盖特梭菌科;g_Bacteroidales_UCG-001:g_拟杆菌目UCG-001;f_Bacteroidales_UCG-001:f_拟杆菌目UCG-001;f_Eubacterium_coprostanoligenes_group:f_粪固醇真杆菌群;g_Eubacterium_coprostanoligenes_group:g_粪固醇真杆菌群;f_Bacteroidales_RF16_group:f_拟杆菌目RF16群;g_Bacteroidales_RF16_group:g_拟杆菌目RF16群;s_bacterium_V9D2013:s_V9D2013细菌;o_Oscillospirales:o_颤螺旋菌目;f_Ruminococcaceae:f_瘤胃球菌科;g_Ruminococcus:g_瘤胃球菌属;s_Bacillus_oceanisediminis:s_居海芽孢杆菌;o_Monoglobales:o_单球菌目;g_Monoglobus:g_单球菌属;f_Monoglobaceae:f_单球菌科;g_Candidatus_Soleaferrea:g_候选铁鞋菌属;g_UCG-005:g_UCG-005属;s_Brevundimonas_diminuta:s_微小短波单胞菌;o_Caulobacterales:o_柄杆菌目;f_Caulobacteraceae:f_柄杆菌科;g_Brevundimonas:g_短波单胞菌属;c_Vampirivibrionia:c_吸血鬼弧菌纲;g_Gastranaerophilales:g_胃厌氧菌目;f_Gastranaerophilales:f_胃厌氧菌目;o_Gastranaerophilales:o_胃厌氧菌目。图9同 the same as Fig.9。 Fig.8 Histogram of LDA score distribution of rumen microflora |
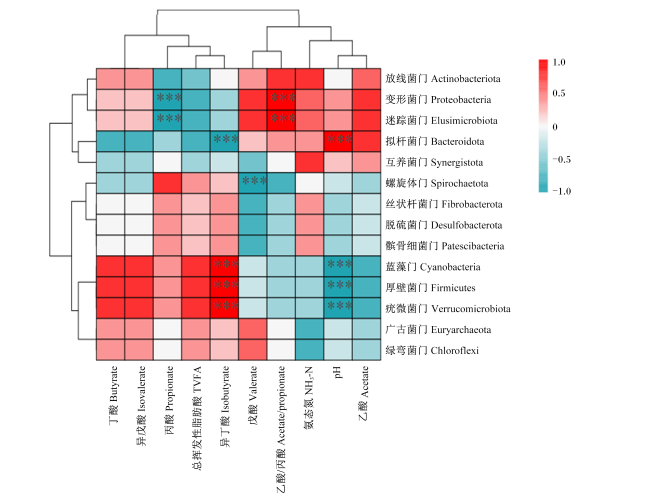
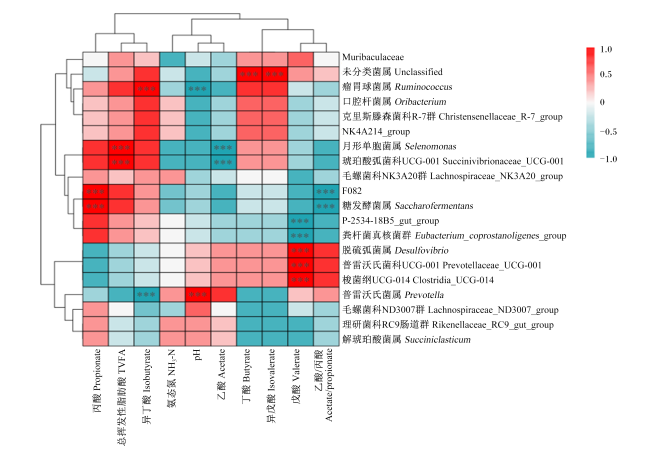
2.3 瘤胃菌群与瘤胃发酵参数之间的相关性
2.4 瘤胃菌群功能预测分析
表5 基于KEGG数据库的滩羊瘤胃菌群功能通路丰度(二级通路排名前10)Table 5 Abundance of functional pathways in rumen microbiota of Tan sheep based on KEGG database (top 10 secondary pathways) |
| 一级通路 Primary pathways | 二级通路 Secondary pathways | 对照组 Control group | 试验Ⅰ组 Trial group Ⅰ | 试验Ⅱ组 Trial group Ⅱ | 试验Ⅲ组 Trial group Ⅲ | P值 P-value | ||||
|---|---|---|---|---|---|---|---|---|---|---|
新陈代谢 Metabolism | 辅因子和维生素的代谢 Metabolism of cofactors and vitamins | 125 068.77 ±5 913.35 | 126 437.53 ±3 142.42 | 126 837.09 ±5 202.99 | 123 600.74 ±5 008.57 | 0.665 | ||||
| 氨基酸代谢 Amino acid metabolism | 137 570.405 ±3 766.90 | 134 091.32 ±4 957.99 | 133 952.41 ±1 551.05 | 134 273.11 ±6 783.77 | 0.493 | |||||
| 碳水化合物代谢 Carbohydrate metabolism | 129 172.75 ±4 259.84 | 126 401.45 ±4 548.73 | 126 136.05 ±3 660.01 | 125 149.25 ±7 440.52 | 0.584 | |||||
| 其他氨基酸代谢 Metabolism of other amino acids | 85 867.89 ±1 086.44 | 84 971.99 ±1 513.37 | 84 872.48 ±2 355.34 | 83 894.37 ±1 753.65 | 0.304 | |||||
| 其他次级代谢产物的生物合成 Biosynthesis of other secondary metabolites | 79 716.02 ±4 088.85 | 79 727.20 ±2 868.97 | 80 855.91 ±2 581.50 | 77 507.39 ±2 591.30 | 0.325 | |||||
| 糖链的生物合成与代谢 Glycan biosynthesis and metabolism | 64 720.34 ±8 969.81b | 66 940.56 ±3 276.08ab | 74 120.25 ±5 347.53a | 60 916.63 ±9 259.03b | 0.032 | |||||
| 全局地图和概览 Global and overview maps | 74 318.79 ±1 409.12 | 73 146.00 ±2 509.76 | 72 478.45 ±1 680.46 | 73 579.39 ±3 640.07 | 0.630 | |||||
| 能量代谢 Energy metabolism | 57 359.06 ±1 345.57 | 58 256.82 ±1 392.71 | 58 172.07 ±622.79 | 57 379.19 ±1 342.34 | 0.428 | |||||
遗传信息处理 Genetic information processing | 复制和修复 Replication and repair | 71 369.96 ±876.40 | 71 827.35 ±588.57 | 72 517.78 ±761.87 | 71 742.80 ±859.38 | 0.113 | ||||
| 翻译Translation | 42 741.55 ±477.72 | 42 501.36 ±240.41 | 42 283.78 ±385.10 | 42 730.28 ±418.81 | 0.169 | |||||
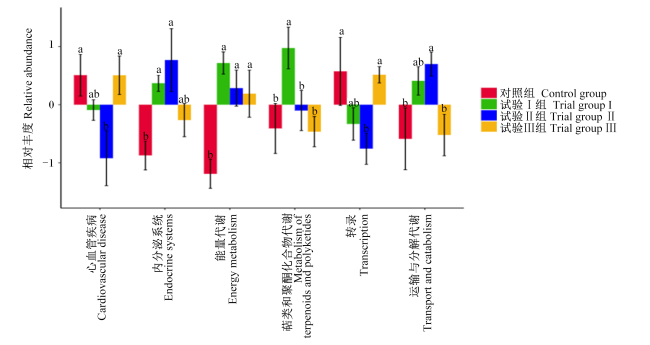
图12 基于KEGG二级通路的滩羊瘤胃菌群功能通路相对丰度差异分析数据柱标注相同小写字母表示差异不显著(P>0.05),不同小写字母表示差异显著(P<0.05)。 Fig.12 Analysis of differences in relative abundances of functional pathways in rumen microbiota of Tan sheep based on KEGG secondary pathways Data columns with the same small letter superscripts mean no significant difference (P>0.05), while with different small letter superscripts mean significant difference (P<0.05). |
 京公网安备 11010802041926号


