

1 材料与方法
1.1 试验菌种、试剂及仪器
1.2 培养基配方
1.3 培养方法
1.3.1 种子培养
1.3.2 发酵培养
1.4 DPA浓度的确定
1.5 菌株诱变及高产突变菌株筛选试验
1.5.1 UV诱变
1.5.2 DES诱变
1.5.3 复合诱变
1.5.4 突变菌株筛选
1.6 发酵条件单因素试验
1.6.1 葡萄糖浓度
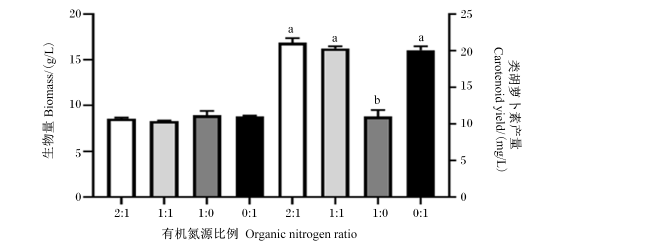
1.6.2 有机氮源比例
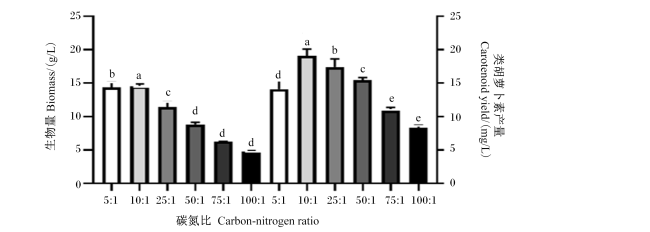
1.6.3 碳氮比
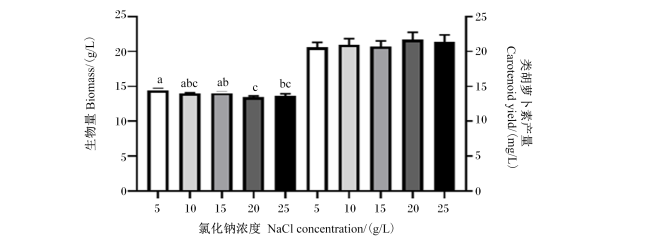
1.6.4 氯化钠浓度
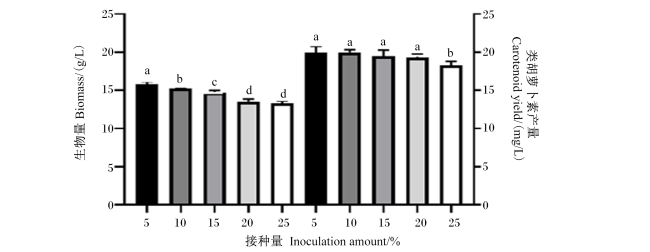
1.6.5 接种量
1.6.6 发酵时间
1.7 响应面试验设计
1.8 类胡萝卜素的提取及测定
1.9 数据统计与分析
2 结果与分析
2.1 适宜DPA浓度筛选
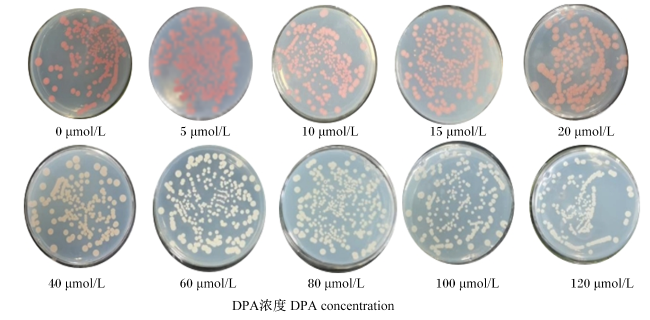
2.2 菌株诱变及高产突变菌株筛选
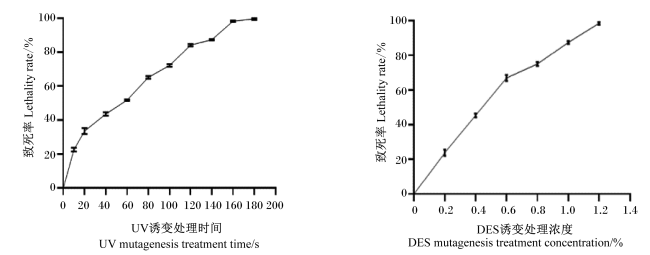
表1 胶红酵母突变菌株类胡萝卜素含量和产量Table 1 Carotenoid content and yield of Rhodotorula mucilaginosa mutant strain |
| 项目 Items | 生物量 Biomass/(g/L) | 类胡萝卜素含量 Carotenoid content/(μg/g) | 类胡萝卜素产量 Carotenoid yield/(mg/L) |
|---|---|---|---|
| 出发菌株Original strain | |||
| ATCC 9449 | 3.90±0.08 | 265.80±13.59 | 1.04±0.07 |
| 突变菌株Mutant strains | |||
| D-26 | 3.23±0.19 | 794.63±80.85 | 2.55±0.13 |
| D-71 | 4.37±0.06 | 256.33±20.56 | 1.12±0.08 |
| D-88 | 3.10±0.11 | 929.44±98.84 | 2.88±0.28 |
| D-92 | 2.93±0.10 | 1 009.00±32.78 | 2.96±0.19 |
| D-103 | 4.65±0.12 | 541.28±37.29 | 2.51±0.11 |
| D-132 | 3.58±0.13 | 661.11±8.70 | 2.37±0.09 |
| D-174 | 2.80±0.07 | 973.81±25.42 | 2.73±0.03 |
| US-4 | 2.68±0.13 | 1 070.12±80.43 | 2.86±0.12 |
| US-5 | 4.35±0.00 | 321.84±3.52 | 1.40±0.02 |
| US-6 | 2.67±0.02 | 399.31±12.60 | 1.06±0.03 |
| C-19 | 2.60±0.11 | 1 090.53±72.04 | 2.84±0.25 |
| C-33 | 4.38±0.10 | 298.60±15.16 | 1.31±0.10 |
| C-38 | 2.85±0.11 | 920.37±45.46 | 2.62±0.05 |
| CS-3 | 4.97±0.18 | 302.26±15.67 | 1.50±0.07 |
| CS-7 | 3.78±0.18 | 531.01±22.29 | 2.01±0.18 |
| CS-15 | 3.50±0.04 | 1 537.72±19.61 | 5.38±0.02 |
| U-9 | 2.23±0.11 | 1 183.28±73.78 | 2.71±0.09 |
| R-4 | 4.82±0.12 | 664.99±11.88 | 3.20±0.13 |
| R-15 | 3.27±0.09 | 353.55±10.41 | 1.15±0.02 |
| R-27 | 3.32±0.20 | 655.23±80.65 | 2.16±0.16 |
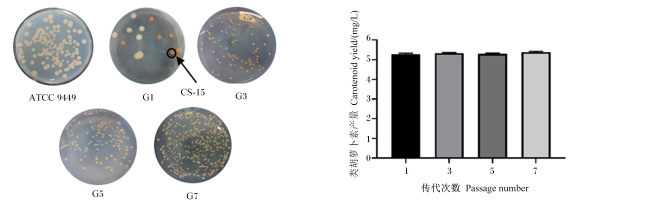
图3 胶红酵母突变菌株CS-15的DPA抗性平板筛选及传代ATCC 9449为出发菌株,CS-15为突变菌株,G1、G3、G5、G7分别为第1代、第3代、第5代、第7代。 Fig.3 DPA resistant tablet screening and subculturing of Rhodotorula mucilaginosa mutant strain CS-15 ATCC 9449 was the parent strain, CS-15 was the mutant strain, and G1, G3, G5, G7 were the 1st, 3rd, 5th and 7th generations, respectively. |
2.3 发酵条件单因素试验
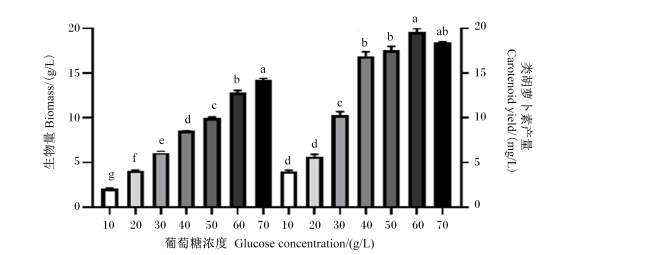
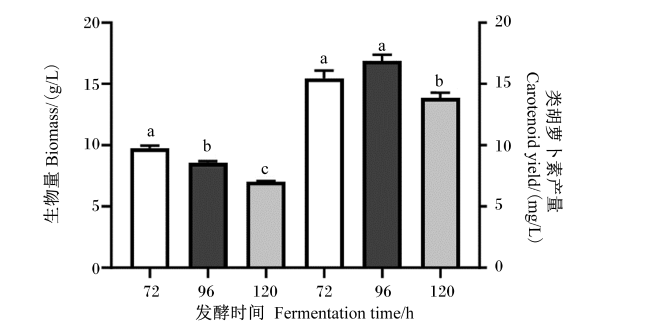
图4 葡萄糖浓度对胶红酵母突变菌株CS-15产类胡萝卜素的影响数据柱标相同小写字母表示差异不显著(P>0.05),不同小写字母表示差异显著(P<0.05)。下图同。 Fig.4 Effects of glucose concentration on carotenoid production of Rhodotorula mucilaginosa mutant strain CS-15 Value columns with the same small letter mean no significant difference (P>0.05), while with different small letters mean significant difference (P<0.05). The same as below. |
2.4 响应面试验结果
表2 试验设计的因素及水平Table 2 Factors and levels of experimental design |
| 项目 Items | 因素Factors | ||
|---|---|---|---|
| 葡萄糖浓度 Glucose concentration/ (g/L)(A) | 碳氮比 Carbon-nitrogen ratio(B) | 氯化钠浓度 NaCl concentration/(g/L)(C) | |
| 水平-1 Level-1 | 50 | 5 | 15 |
| 水平0 Level 0 | 60 | 10 | 20 |
| 水平1 Level 1 | 70 | 25 | 25 |
表3 响应面试验设计及试验结果Table 3 Response surface experimental design and experimental results |
| 试验号 Test number | 葡萄糖浓度 Glucose concentration/ (g/L)(A) | 碳氮比 Carbon-nitrogen ratio(B) | 氯化钠浓度 NaCl concentration/ (g/L)(C) | 类胡萝卜素产量 Carotenoid yield/ (mg/L) |
|---|---|---|---|---|
| 1 | 50 | 25 | 20 | 22.498 4 |
| 2 | 70 | 25 | 20 | 21.875 0 |
| 3 | 60 | 10 | 20 | 19.297 4 |
| 4 | 60 | 5 | 25 | 14.634 4 |
| 5 | 70 | 10 | 25 | 18.458 9 |
| 6 | 50 | 5 | 20 | 13.825 0 |
| 7 | 60 | 10 | 20 | 19.297 4 |
| 8 | 70 | 5 | 20 | 15.443 8 |
| 9 | 70 | 10 | 25 | 18.560 9 |
| 10 | 60 | 10 | 20 | 19.297 4 |
| 11 | 60 | 25 | 25 | 24.230 2 |
| 12 | 50 | 10 | 15 | 17.658 6 |
| 13 | 50 | 10 | 25 | 18.116 1 |
| 14 | 60 | 25 | 15 | 19.687 5 |
| 15 | 60 | 5 | 15 | 14.683 6 |
表4 回归方程方差分析Table 4 Analysis of variance for regression equations |
| 变异来源 Source of variation | 平方和 Sum of squares | 自由度 Degrees of freedom | 均方 Mean square | F值 F-value | P值 P-value |
|---|---|---|---|---|---|
| 模型Model | 124.68 | 9 | 124.68 | 167.16 | <0.000 1 |
| A | 0.17 | 1 | 0.17 | 2.01 | 0.215 7 |
| B | 110.29 | 1 | 110.29 | 1 330.85 | <0.000 1 |
| C | 6.38 | 1 | 6.38 | 76.99 | 0.000 3 |
| AB | 1.18 | 1 | 1.18 | 14.24 | 0.013 0 |
| AC | 0.032 | 1 | 0.03 | 0.38 | 0.564 0 |
| BC | 6.91 | 1 | 6.91 | 83.35 | 0.000 3 |
| A2 | 0.92 | 1 | 0.92 | 11.07 | 0.020 8 |
| B2 | 16.68 | 1 | 16.68 | 201.28 | <0.000 1 |
| C2 | 1.33 | 1 | 1.33 | 16.05 | 0.010 3 |
| 剩余Residual | 0.41 | 5 | 0.08 | ||
| 失拟项Lack of fit | 0.41 | 3 | 0.14 | ||
| 纯误差Pure error | 0 | 2 | 0.00 | ||
| 总和Total | 125.09 | 14 | |||
| 决定系数R2 | 0.996 7 | ||||
| 信噪比Adeq precision | 43.263 |
P<0.05表示差异显著,P<0.01表示差异极显著。 | |
P<0.05 indicated significant difference, and P<0.01 indicated extremely significant difference. |
表5 模型可信度分析Table 5 Reliability analysis of model |
| 项目Items | 数值Value | 项目Items | 数值Value | |
|---|---|---|---|---|
| 标准差SD | 0.29 | 决定系数R2 | 0.996 7 | |
| 平均值Mean | 18.50 | 调整决定系数Adjusted R2 | 0.990 7 | |
| 变异系数CV/% | 1.56 | 预测决定系数Predicted R2 | 0.948 0 |
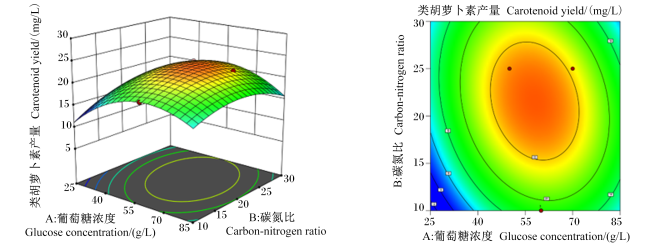
图10 葡萄糖浓度(A)和碳氮比(B)对类胡萝卜素生物合成的影响Fig.10 Effects of glucose concentration (A) and carbon-nitrogen ratio (B) on carotenoid biosynthesis |
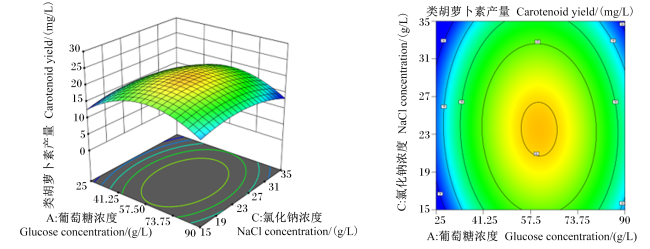
图11 葡萄糖浓度(A)和氯化钠浓度(C)对类胡萝卜素生物合成的影响Fig.11 Effects of glucose concentration (A) and NaCl concentration (C) on carotenoid biosynthesis |
 京公网安备 11010802041926号


