

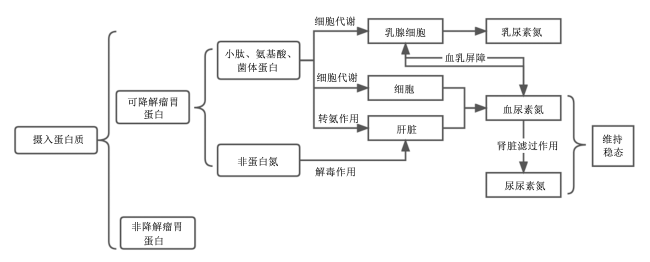
1 材料与方法
1.1 试验材料
1.2 数据整理
1.2.1 数据预处理
1.2.2 效应划分
1.3 数据分析
1.3.1 初步处理以及分布分析
1.3.2 基于固定模型的参数因素分析
1.3.3 基于DHI分组的MUN影响因素分析
1.3.4 描述性统计
2 结果与分析
2.1 全群数据质控
表1 全群数据分布、偏度与峰度Table 1 Distribution, skewness and kurtosis of whole population data |
| 项目 Items | 平均值 Mean | 最小值 Minimum | 最大值 Maximum | 中位值 Median | 标准差 Standard deviation | 偏度 Skewness | 峰度 Kurtosis |
|---|---|---|---|---|---|---|---|
| 胎次Parity | 2.78 | 1.00 | 12.00 | 2.00 | 1.72 | 1.21 | 1.52 |
| 产奶量Milk yield/(kg/d) | 37.69 | 7.10 | 69.90 | 37.80 | 10.69 | -0.03 | -0.08 |
| 乳脂率Milk fat percentage/% | 4.13 | 2.01 | 6.99 | 4.12 | 0.86 | 0.15 | -0.02 |
| 乳蛋白率Milk protein percentage/% | 3.31 | 2.28 | 4.33 | 3.29 | 0.32 | 0.24 | 0.08 |
| 校正乳Corrective milk/(kg/d) | 44.18 | 3.50 | 95.50 | 43.60 | 14.47 | 0.37 | 0.34 |
| 乳尿素氮MUN/(mg/dL) | 12.94 | 1.00 | 25.60 | 12.70 | 4.08 | 0.23 | -0.05 |
| 乳糖率Milk lactose percentage/% | 5.19 | 4.26 | 6.06 | 5.22 | 0.23 | -0.88 | 1.49 |
| 脂蛋比Fat to protein ratio | 1.26 | 0.44 | 2.10 | 1.25 | 0.26 | 0.25 | 0.23 |
| 体细胞评分SCS | 2.84 | 0.00 | 9.00 | 3.00 | 1.80 | 0.57 | 0.09 |
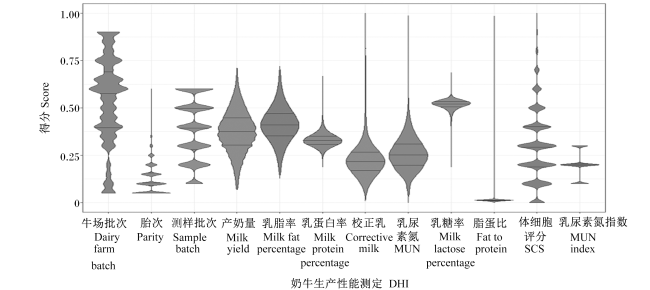
图2 奶牛泌乳性能指标数据分布情况小提琴图表示的是数据集的分布以及数据的基本情况,其中图示标线分别为第一四分位数、中位数和第三四分位数,表示的是数据的分布是否正态或是否平均。其中,产奶量、乳脂率、乳蛋白率、校正乳、MUN和脂蛋比指标为正态分布,乳糖率为偏态分布(第一四分位数、中位数和第三四分位数间距离不等),牛场批次属于随机分布,测样批次属于平均分布,体细胞评分基本属于正态分布,胎次属于对数分布。 Fig.2 Data distribution of lactation performance indices of dairy cows The violin diagram showed the distribution of the data set and the basic situation of the data. The graph was marked with the first quartile, the median quartile and the third quartile, indicating whether the distribution of the data was normal or average. Among them, milk yield, milk fat percentage, milk protein percentage, corrective milk, MUN and fat to protein ratio were normal distribution, milk lactose percentage was skewed distribution (the distance between the first quartile, median and third quartile was unequal), farm batch was randomly distributed, sample batch was evenly distributed, somatic cell score was basically normal distribution, and parity was logarithmic distribution. |
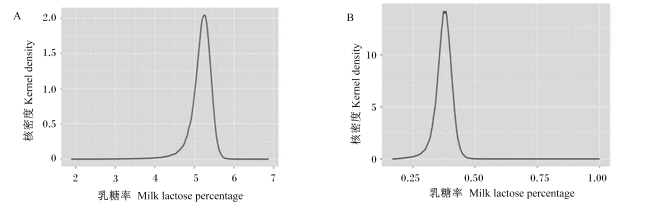
图3 乳糖率校正前后分布情况本图主要为乳糖率校正前后的核密度函数,显示的是整个指标的分布情况,A图左尾明显长于右尾,且中位值偏右,属于右偏态;B图为校正后左尾与右尾基本一致且中值处于正中,为近似正态分布。 Fig.3 Distribution of milk lactose percentage before and after correction This figure was mainly the kernel density function before and after milk lactose percentage correction, showing the distribution of the whole index. In Fig.A, the left tail was obviously longer than the right tail, and the median value was skewed to the right, which belonged to the right skew; in Fig.B, the left tail was basically consistent with the right tail after correction, and the median value was in the middle, indicating an approximate normal distribution. |
2.2 MUN对泌乳性能的影响
2.2.1 相关性分析
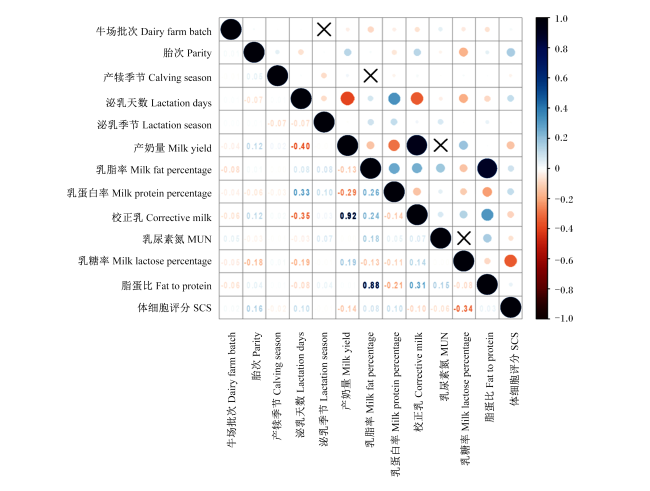
图4 群体指标间的相关性分析图中对群体指标之间的相关性和显著性进行了标注,其中×代表着相关性不显著(P>0.05),没有×标记代表相关性显著(P<0.05)。热图中的颜色代表正负相关,颜色的深浅以及圆圈的大小代表相关性的强弱,颜色越深、圆圈越大代表相关越强,颜色越浅、圆圈越小则代表相关越弱。 Fig.4 Correlation analysis among population indicators In the figure, the correlation and significance among population indicators were marked, where × marker represented insignificant correlation (P>0.05), while no × marker represented significant correlation (P<0.05). The color in the heat map represented positive and negative correlation, while the depth of the color and the size of the circle represented the strength of the correlation. The darker the color and the larger the circle, the stronger the correlation, and the lighter the color and the smaller the circle, the weaker the correlation. |
2.2.2 描述性统计
表2 不同MUN浓度下群体泌乳性能的差异Table 2 Differences in lactation performance of population with different MUN concentrations |
| 项目 Items | 低MUN组 Low MUN group | 正常MUN组 Normal MUN group | 高MUN组 High MUN group | P值 P-value |
|---|---|---|---|---|
| 产奶量Milk yield/(kg/d) | 37.91±11.06 | 37.89±10.72 | 37.96±10.34 | 0.487 |
| 乳脂率Milk fat percentage/% | 3.98±0.85C | 4.11±0.84B | 4.38±0.90A | <0.001 |
| 乳蛋白率Milk protein percentage/% | 3.29±0.32C | 3.31±0.31B | 3.33±0.33A | <0.001 |
| 校正乳Corrective milk/(kg/d) | 44.54±16.40C | 45.21±17.57B | 45.57±16.55A | <0.001 |
| 乳糖率Milk lactose percentage/% | 5.20±0.23A | 5.19±0.22B | 5.20±0.22A | <0.001 |
| 脂蛋比Fat to protein ratio | 1.22±0.26C | 1.25±0.25B | 1.32±0.27A | <0.001 |
| 体细胞数SCC/(×104个/mL) | 23.84±27.29A | 23.03±26.80B | 22.66±27.20C | <0.001 |
2.3 MUN的影响因素
2.3.1 基于固定模型的影响因素分析
表3 MUN的影响因素参数分析Table 3 Parameter analysis of influencing factors on MUN |
| 项目 Items | 参数 Parameters | 均值标准误 SEM | T值 T-stat | P值 P-value | 置信下限 Lower CI | 置信上限 Upper CI |
|---|---|---|---|---|---|---|
| 常数Constant | 4.030 6 | 0.299 1 | 13.477 | <0.001 | 3.444 0 | 4.616 8 |
| 牛场Dairy farm | 0.055 7 | 0.001 7 | 33.675 | <0.001 | 0.052 5 | 0.058 9 |
| 胎次Parity | -0.058 2 | 0.005 6 | -10.450 | <0.001 | -0.069 1 | -0.047 3 |
| 产犊季节Calving season | -0.003 9 | 0.007 3 | -0.533 | 0.594 | -0.018 2 | 0.010 4 |
| 泌乳天数Lactation days | -0.521 0 | 0.026 9 | -19.373 | <0.001 | -0.573 7 | -0.468 3 |
| 泌乳季节Lactation season | 0.166 0 | 0.006 9 | 23.900 | <0.001 | 0.152 4 | 0.179 6 |
| 产奶量Milk yield | 0.003 6 | 0.000 8 | 4.389 | <0.001 | 0.002 0 | 0.005 2 |
| 乳脂率Milk fat percentage | 0.858 5 | 0.009 4 | 91.604 | <0.001 | 0.840 2 | 0.876 9 |
| 乳蛋白率Milk protein percentage | 0.266 6 | 0.027 1 | 9.820 | <0.001 | 0.213 4 | 0.319 8 |
| 乳糖率Milk lactose percentage | -0.222 1 | 0.037 9 | -5.865 | <0.001 | -0.296 3 | -0.147 9 |
| 体细胞评分SCS | -0.173 3 | 0.004 6 | -37.410 | <0.001 | -0.182 4 | -0.164 3 |
2.3.2 基于DHI分组的MUN影响因素
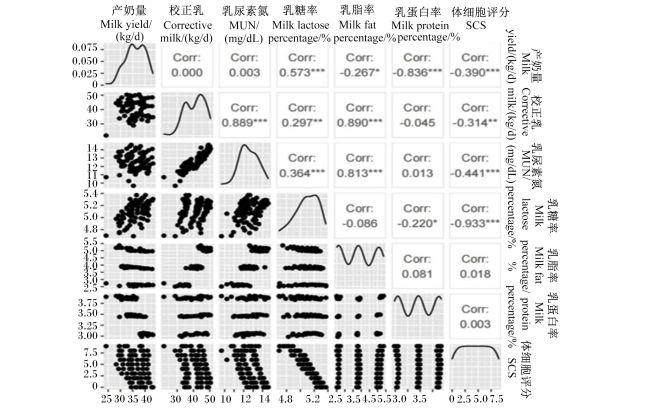
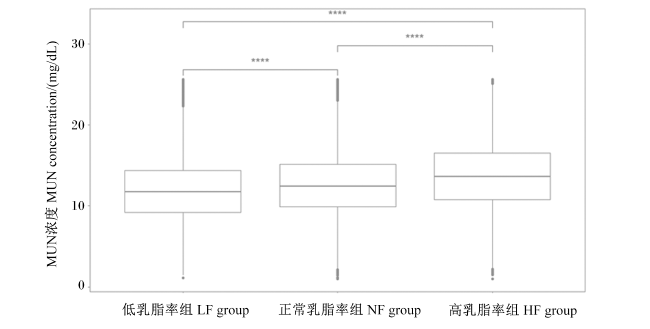
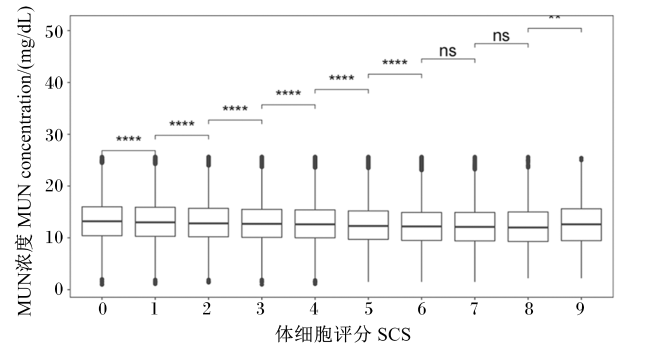
图5 基于DHI分组的MUN影响因素分析Corr:相关系数 correlation coefficient。 ns表示P>0.05,*表示P<0.05,**表示P<0.01,***表示P<0.001,****表示P<0.000 1。下图同。 Fig.5 Analysis of influence factors on MUN based on DHI grouping ns mean P>0.05, * mean P<0.05, ** mean P<0.01, *** mean P<0.001, and **** mean P<0.000 1. The same as below. |
2.3.3 乳脂率变异对MUN浓度的影响
2.3.4 体细胞评分变异对MUN浓度的影响
2.3.5 泌乳季节变异对MUN浓度和泌乳性能的影响
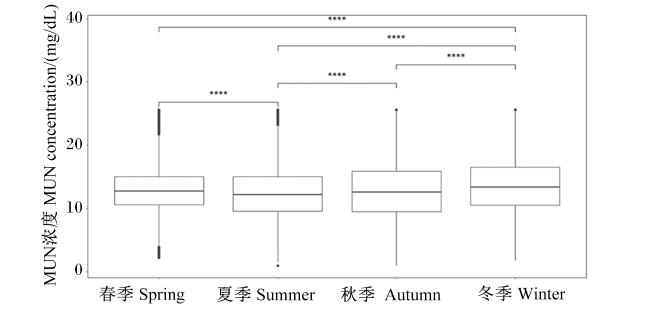
表4 不同泌乳季节群体泌乳性能的差异Table 4 Differences in lactation performance of population in different lactation seasons |
| 项目 Items | 春季 Spring | 夏季 Summer | 秋季 Autumn | 冬季 Winter | P值 P-value |
|---|---|---|---|---|---|
| 产奶量Milk yield/(kg/d) | 38.09±10.85A | 37.68±10.54C | 37.22±10.76D | 37.92±10.61B | <0.001 |
| 乳脂率Milk fat percentage/% | 4.10±0.84C | 4.01±0.85D | 4.17±0.88B | 4.27±0.88A | <0.001 |
| 乳蛋白率Milk protein percentage/% | 3.29±0.30C | 3.25±0.30D | 3.35±0.34B | 3.35±0.32A | <0.001 |
| 校正乳Corrective milk/(kg/d) | 38.45±11.36B | 37.59±11.11D | 38.00±11.60C | 39.29±11.62A | <0.001 |
| 乳尿素氮MUN/(mg/dL) | 12.90±3.63B | 12.39±4.02C | 12.88±4.33B | 13.60±4.30A | <0.001 |
| 乳糖率Milk lactose percentage/% | 5.18±0.22B | 5.20±0.23A | 5.20±0.23A | 5.18±0.22C | <0.001 |
| 脂蛋比Fat to protein ratio | 1.25±0.25B | 1.24±0.26C | 1.25±0.27B | 1.28±0.26A | <0.001 |
| 体细胞评分SCS | 2.80±1.78B | 2.92±1.80A | 2.90±1.85A | 2.77±1.76C | <0.001 |
 京公网安备 11010802041926号


