

1 材料与方法
1.1 试验材料
1.2 试验动物与试验设计
1.3 血清生化指标测定
1.4 组织切片制备及染色方法
1.5 实时荧光定量PCR(qRT-PCR)
表1 qRT-PCR反应体系Table 1 Reaction system of qRT-PCRμL |
| 试剂 Reagents | 体积 Volume |
|---|---|
| YBR® Green Premix Ex TaqTM | 12.5 |
| 上游引物 Upstream primers (10 μmol/L) | 0.5 |
| 下游引物 Downstream primers (10 μmol/L) | 0.5 |
| 无RNA酶水 DEPC水 | 9.5 |
| cDNA | 2.0 |
| 合计 Total | 25.0 |
表2 qRT-PCR反应程序Table 2 Reaction program of qRT-PCR |
| 项目 Items | 95 ℃ | 95 ℃ | 60 ℃ | 95 ℃ | 65 ℃ | 95 ℃ |
|---|---|---|---|---|---|---|
| 时间 Time/s | 30 | 5 | 30 | 10 | 5 | 0.5 |
| 循环数 The number of cycles | 1 | 40 | 40 | 40 | 1 | 1 |
表3 引物序列Table 3 Primer sequences |
| 基因 Genes | 上游基因序列 Upstream gene sequence (5'—3') | 下游基因序列 Downstream gene sequences (5'—3') |
|---|---|---|
| ATP-柠檬酸裂解酶 ACLY | GGGAGAAGTTGGGAAGACCA | AGGAGGAAGTTGGCAGTGTG |
| 乙酰辅酶A羧化酶1 ACC1 | TAACAGAATCGACACTGGCTGGCT | ATGCTGTTCCTCAGGCTCACATCT |
| 脂肪酸合成酶 FASN | TGACCTCGTGATGAACGTGTAC | GGGTGAGGACGTTTACAAAGG |
| 固醇元件结合蛋白1c SREBP1c | GGCTATTCCGTGAACATCTCCTA | ATCCAAGGGCATCTGAGAACTC |
| β-肌动蛋白 β-actin | CGTTGACATCCGTAAAGACC | AACAGTCCGCCTAGAAGCAC |
1.6 蛋白免疫印迹(Western blot)
1.7 数据统计分析
2 结果与分析
2.1 高脂小鼠模型的构建
表4 小鼠体质量Table 4 Body mass of miceg |
| 项目 Items | 常温对照组 Room temperature control group | 常温高脂组 Room temperature high fat group | P值 P-value |
|---|---|---|---|
| 初始体质量IBW | 17.28±0.84 | 18.40±1.20 | 0.894 |
| 终末体质量FBW | 31.00±1.82 | 42.58±3.35* | 0.002 |
与常温对照组相比,常温高脂组同行数据肩标*表示差异极显著(P<0.01),无*表示差异不显著(P>0.05)。 | |
Compared with room temperature control group, in room temperature high fat group, peer data shoulder labels * indicate significant difference (P<0.01), while no * indicate no significant difference (P>0.05). |
2.2 间歇性冷刺激对小鼠肝脏组织形态结构的影响
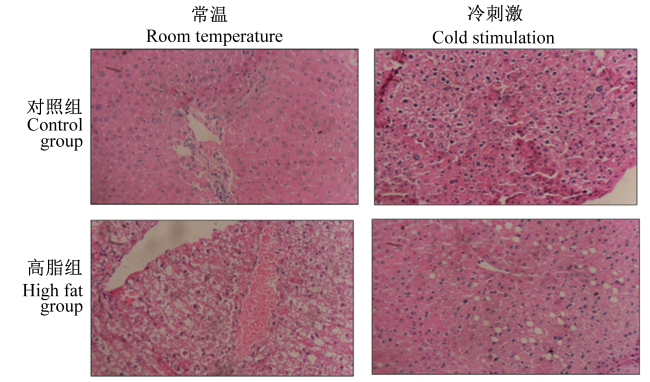
2.3 间歇性冷刺激对肥胖小鼠血清脂质相关指标的影响
表5 小鼠血清中脂质相关指标的结果Table 5 Results of lipid-related indexes in mouse serummmol/L |
| 项目 Items | 常温对照组 Room temperature control group | 常温高脂组 Room temperature high fat group | 冷刺激组 Cold stimulation group | 冷刺激高脂组 Cold stimulation high fat group | P值 P-value |
|---|---|---|---|---|---|
| 低密度脂蛋白胆固醇LDL-C | 0.36±0.03A | 0.86±0.09B | 0.13±0.03C | 0.53±0.06D | <0.01 |
| 高密度脂蛋白胆固醇HDL-C | 2.17±0.22Aa | 3.67±0.32Bb | 1.28±0.10Cc | 2.12±0.13Aa | <0.01 |
| 总胆固醇 T-CHO | 2.51±0.13Aa | 4.47±0.45Bb | 1.53±0.08Cc | 2.85±0.37Aa | <0.01 |
| 甘油三酯 TG | 1.32±0.14Aa | 2.09±0.15Bb | 0.71±0.11Cc | 1.17±0.11Aa | <0.01 |
| 游离脂肪酸 NEFA | 0.92±0.08A | 1.95±0.06B | 0.52±0.09C | 1.19±0.09D | <0.01 |
同行数据肩标不同小写字母表示差异显著(P<0.05),不同大写字母表示差异显著(P<0.01),相同小写字母表示差异不显著(P>0.05)。 | |
In the same row, values with different small letter superscripts mean significant difference (P<0.05), and with different capital letter superscripts mean significant difference (P<0.01), while with the same samll letter superscripts mean no significant difference(P>0.05). |
2.4 间歇性冷刺激对肥胖小鼠肝脏脂质合成相关基因的mRNA相对表达量的影响
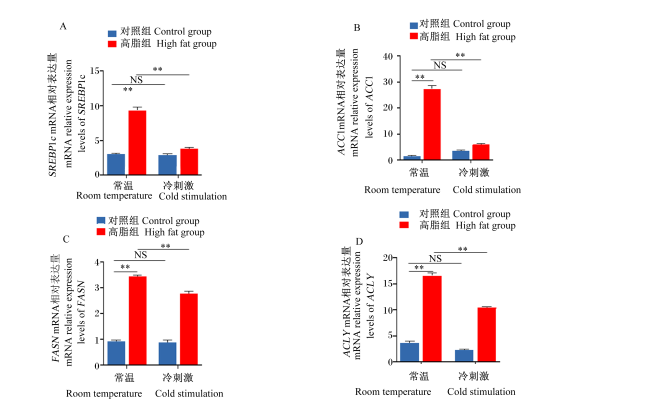
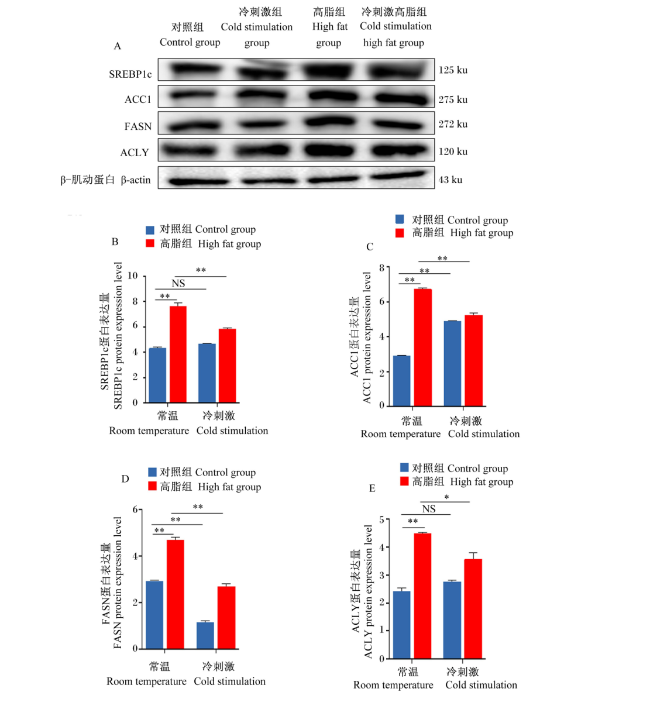
图2 小鼠肝脏组织脂质合成相关基因的表达结果SREBP1c:固醇元件结合蛋白1c sterol regulatory element binding protein 1c;ACC1:乙酰辅酶A羧化酶 acety1 CoA carboxylase;FASN:脂肪酸合成酶 fatty acid synthase;ACLY:ATP-柠檬酸裂解酶 ATP-citrate lyase。图3同 the same as Fig.3。 *表示差异显著(P<0.05),**表示差异极显著(P<0.01),NS表示差异不显著(P>0.05)。图3同。 Fig.2 Expression results of genes related to fat synthesis in mouse liver tissues * indicates significant difference (P<0.05), ** indicates extremely significant difference (P<0.01), NS indicates insignificant difference (P>0.05). The same as Fig.3. |
 京公网安备 11010802041926号


