

1 材料与方法
1.1 试验设计及样品采集
表1 兰坪乌骨绵羊和普通绵羊血浆黑色素指标比较Table 1 Comparison of plasma melanin indexes of Lanping black-boned sheep and conventional sheep |
| 项目 Items | 组别Groups | |
|---|---|---|
| WG | PT | |
| 酪氨酸酶TYR/(IU/L) | 135.849 7±35.791 8* | 102.085 9±23.248 6 |
| 真黑色素Eumelanin/(ng/L) | 58.273 1±10.430 3 | 54.214 6±9.093 7 |
| 总黑色素Total melanin/(ng/L) | 162.452 6±52.425 3 | 157.971 6±37.326 6 |
| 褐黑色素Phaeomelanin/(ng/L) | 46.843 2±14.302 9** | 30.926 9±4.904 1 |
同行数据肩标*表示显著差异(P<0.05),肩标**表示极显著差异(P<0.01)。 | |
In the same row, values with * superscript mean significant difference (P<0.05), and with ** superscript mean extremely significant difference (P<0.01). |
1.2 测定方法
1.3 数据分析
2 结果与分析
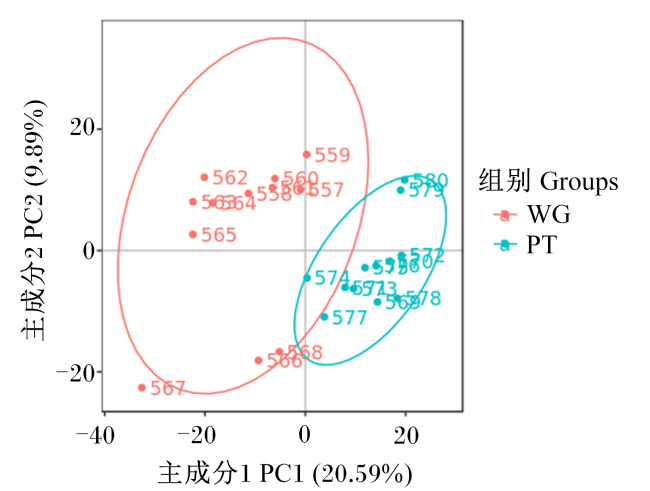
2.1 PCA
2.2 PLS-DA
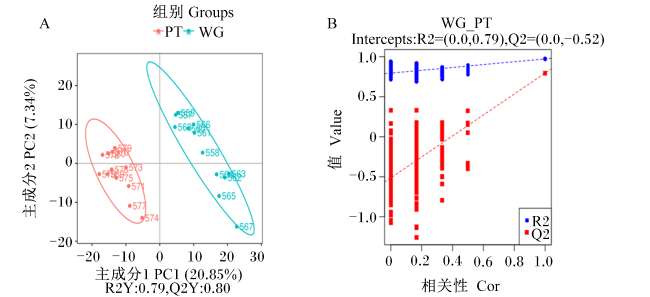
图2 PLS-DA得分散点图(A)和排序验证图(B)WG_PT代表比较对,Intercepts:R2=(0.0,0.79),Q2=(0.0,-0.52)代表R2与Q2与Y轴交点的坐标。 Fig.2 PLS-DA score scatter plot (A) and ranking verification plot (B) WG_PT represents comparison, and the Intercepts: R2=(0.0,0.79), Q2=(0.0, -0.52) represents the coordinates of the intersection of R2 and Q2 with the Y-axis. |
2.3 差异代谢物筛选
表2 兰坪乌骨绵羊和普通绵羊差异代谢物(前12)Table 2 Differential metabolites of top12 between Lanping black-boned sheep and conventional sheep (top 12) |
| 项目 Items | 代谢物 Metabolites | 分子质量 MW/u | 保留时间 RT/min | log2差异 倍数 log2FC | P值 P-value | 变量投影 重要性 VIP | |||||||
|---|---|---|---|---|---|---|---|---|---|---|---|---|---|
上调 Up-regulated | 阿苯达唑亚砜Albendazole sulfoxide | 281.08 | 5.61 | 6.69 | 0.003 0 | 2.15 | |||||||
| 阿苯达唑砜Albendazole sulfone | 297.08 | 5.66 | 6.65 | 0.000 9 | 2.36 | ||||||||
| 4-羟基异亮氨酸4-hydroxyisoleucine | 147.09 | 2.24 | 4.29 | 0.000 5 | 2.55 | ||||||||
| 2-(3,4-二甲氧基苯基)喹啉 2-(3,4-dimethoxyphenyl)quinoline | 303.07 | 5.62 | 4.18 | 0.013 4 | 1.77 | ||||||||
| 2-[(2,4-二氟苯基)亚氨基]-3-(3- 吡啶甲基)-1,3-噻唑啉-4-酮 2-[(2,4-difluorophenyl) imino]-3-(3- pyridylmethyl)-1,3-thiazolan-4-one | 319.06 | 5.67 | 3.09 | 0.004 8 | 1.76 | ||||||||
| 2-{2-氧代-2-[(2-氧代-3-氮杂 环丙基)氨基]乙氧基}乙酸 2-{2-oxo-2-[(2-oxo-3-azepanyl) amino] ethoxy} acetic acid | 244.11 | 8.10 | 2.52 | 0.022 0 | 1.64 | ||||||||
| 溶血磷脂21∶0 LPC 21∶0 | 611.42 | 11.41 | 2.43 | 0.003 0 | 1.35 | ||||||||
| 脱氧胆酸Deoxycholic acid | 392.29 | 8.02 | 2.34 | 0.000 5 | 2.16 | ||||||||
| 磷脂酰胆碱(16∶0e/5∶0) PC (16∶0e/5∶0) | 565.41 | 11.61 | 2.28 | 0.000 8 | 1.37 | ||||||||
| 溶血磷脂20∶0 Lysopc 20∶0 | 551.40 | 11.41 | 2.21 | 0.001 9 | 1.35 | ||||||||
| 磷脂酰乙醇胺(16∶1e/20∶5) PE (16∶1e/20∶5) | 721.51 | 14.85 | 2.13 | 0.001 0 | 1.61 | ||||||||
| 4-氨基马尿酸4-aminohippuric acid | 194.07 | 4.91 | 2.10 | 0.028 9 | 1.39 | ||||||||
下调 Down- regulated | 氧化磷脂酰胆碱[16∶0-20∶4+3O(2Cyc)] OxPC [16∶0-20∶4+3O(2Cyc)] | 875.56 | 11.56 | -3.03 | <0.000 1 | 2.20 | |||||||
| 氧化磷脂酰胆碱[18∶0-20∶5+3O(2Cyc)] OxPC [18∶0-20∶5+3O(2Cyc)] | 901.57 | 12.23 | -3.06 | <0.000 1 | 2.12 | ||||||||
| 二酮Boldione | 284.18 | 6.72 | -3.08 | 0.008 8 | 1.28 | ||||||||
| 甲羟丙烯醇酮Methandrostenolone | 300.21 | 8.13 | -3.24 | 0.001 7 | 1.79 | ||||||||
| 氧化磷脂酰胆碱(16∶0-18∶1+2O) OxPC (16∶0-18∶1+2O) | 837.58 | 13.06 | -3.36 | 0.000 8 | 1.73 | ||||||||
| 磷脂酰胆碱(9∶0/9∶0) PC (9∶0/9∶0) | 583.35 | 7.74 | -3.43 | <0.000 1 | 2.43 | ||||||||
| 氧化磷脂酰胆碱(18∶1-18∶2+2O) OxPC (18∶1-18∶2+2O) | 861.58 | 12.86 | -3.53 | <0.000 1 | 2.21 | ||||||||
| 氧化磷脂酰胆碱(18∶0-18∶1+3O) OxPC (18∶0-18∶1+3O) | 881.60 | 11.46 | -3.73 | <0.000 1 | 2.42 | ||||||||
| 氧化磷脂酰胆碱(16∶0-18∶2+1O) OxPC (16∶0-18∶2+1O) | 819.56 | 12.71 | -3.80 | <0.000 1 | 2.24 | ||||||||
| 霉酚酸Mycophenolic acid | 320.13 | 6.51 | -4.08 | 0.000 9 | 1.31 | ||||||||
| 异丙肾上腺素Isoproterenol | 211.12 | 6.16 | -4.11 | <0.000 1 | 2.41 | ||||||||
| 18-羟基二十碳五烯酸18-HEPE | 318.22 | 6.27 | -4.23 | 0.042 3 | 1.37 |
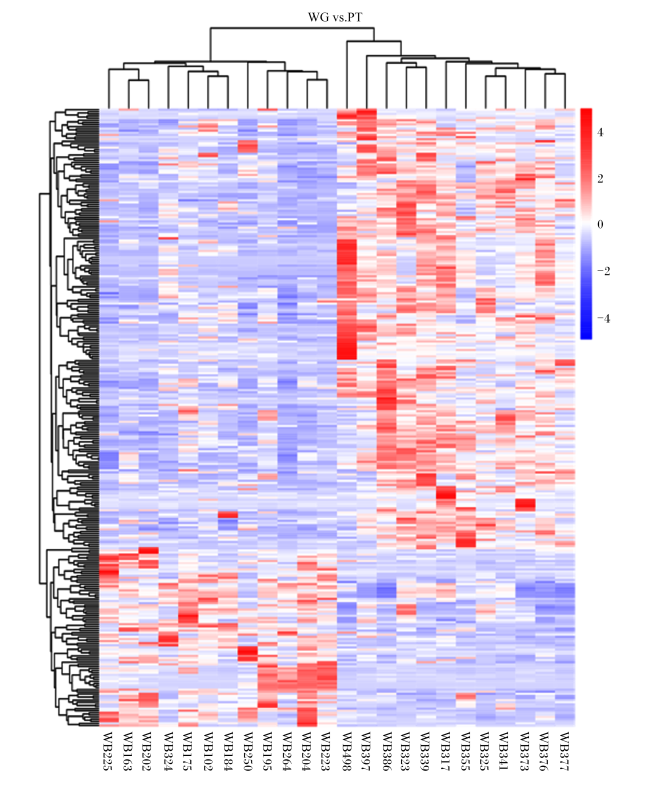
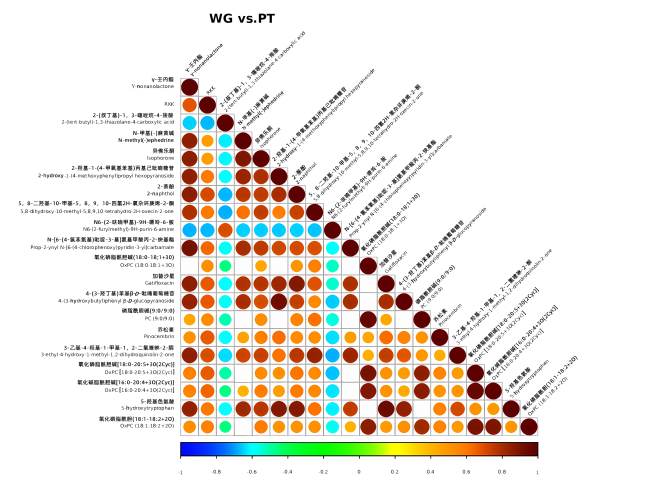
图4 差异代谢物相关性图(前20)相关性最高为1,为完全的正相关(红色);相关性最低为-1,为完全的负相关(蓝色);没有颜色的部分表示P值>0.05,图中展示的是按P值从小到大排序的前20的差异代谢物的相关性。 Fig.4 Differential metabolites correlation diagram (top 20) The highest correlation is 1, which is completely positive correlation (red); the lowest correlation is -1, which is completely negative correlation (blue); the part without color indicates P-value>0.05, and the figure shows the correlation of the differential metabolites of the top 20 sorted by P-value value from smallest to largest. |
2.4 相关网络和代谢途径分析
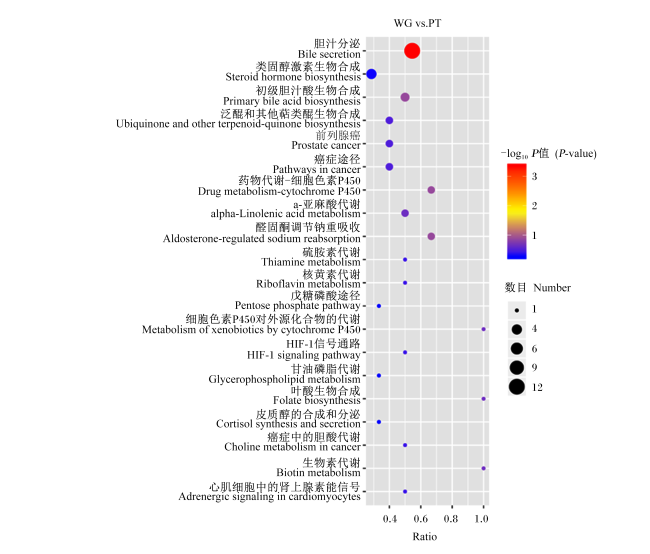
图5 显著差异调节代谢物的代谢途径图中横坐标为相应代谢通路中差异代谢物的数目/该通路中鉴定出总代谢物数目,值越大,表示该通路中差异代谢物富集程度越高。点的颜色代表超几何检验的P值,P值越小,说明检验的可靠性越大、越具统计学意义。点的大小代表相应通路中差异代谢物的数目,数目越大,代表该通路内差异代谢物就越多。 Fig.5 Significant differences regulate metabolic pathways of metabolites The abscissa in the figure is the number of differential metabolites in the corresponding metabolic pathway/number of total metabolites identified in the pathway, the higher the value, the higher the degree of differential metabolite concentration in the pathway. The color of the dots represents the P-value of the hypergeometry test, and the smaller the P-value, the greater and more statistically significant the reliability of the test. The size of the dot represents the number of differential metabolites in the corresponding pathway, and the larger the number, the more differential metabolites within that pathway. |
 京公网安备 11010802041926号


