

1 材料与方法
1.1 试验材料
1.2 试验动物与试验设计
1.3 饲养管理
表1 代乳粉的营养水平(风干基础)Table 1 Nutrient levels of milk replacer (air-dry basis)% |
| 营养水平 Nutrient levels | 含量 Content |
|---|---|
| 干物质 DM | 95.0 |
| 粗蛋白质 CP | ≥22.0 |
| 粗脂肪 EE | ≥16.0 |
| 粗灰分 Ash | ≤8.0 |
| 粗纤维 CF | ≤0.3 |
| 钙 Ca | 0.7~1.2 |
| 磷 P | ≥0.6 |
表2 开食料组成及营养水平(风干基础)Table 2 Composition and nutrient levels of the starter (air-dry basis)% |
| 原料 Ingredients | 第1~14天 Days 1 to 14 | 第15~42天 Days 15 to 42 | 营养水平 Nutrient levels2) | 第1~14天 Days 1 to 14 | 第15~42天 Days 15 to 42 | |
|---|---|---|---|---|---|---|
| 玉米 Corn | 56.70 | 57.50 | 代谢能ME/(MJ/kg) | 13.04 | 13.26 | |
| 豆粕 Soybean meal | 16.50 | 17.50 | 干物质 DM | 90.14 | 91.14 | |
| 玉米蛋白粉 Corn gluten meal | 11.50 | 10.20 | 粗蛋白质 CP | 19.89 | 20.63 | |
| 麸皮 Wheat bran | 12.00 | 11.50 | 粗脂肪 EE | 10.72 | 11.36 | |
| 石粉 Limestone | 1.90 | 1.80 | 粗灰分 Ash | 6.21 | 5.47 | |
| 氯化钠 NaCl | 0.40 | 0.50 | 中性洗涤纤维 NDF | 16.48 | 34.01 | |
| 预混料 Premix1) | 1.00 | 1.00 | 酸性洗涤纤维 ADF | 6.13 | 16.06 | |
| 合计 Total | 100.00 | 100.00 | 钙 Ca | 1.12 | 1.47 | |
| 磷 P | 0.51 | 1.32 |
1)预混料为每千克开食料提供The premix provided the following per kg of the starter:VA 15 000 IU,VD 5 000 IU,VE 50 mg,Fe 90 mg,Cu 12.5 mg,Mn 30 mg,Zn 90 mg,Se 0.3 mg,I 1.0 mg,Co 0.5 mg。 2)代谢能为参考NRC(2001)所得计算值,其余为实测值。ME was a calculated value with reference to NRC (2001), while the others were measured values. |
1.4 样品采集
1.5 指标测定
1.5.1 常规营养成分含量
1.5.2 肠道通透性指标测定
1.5.3 粪便短链脂肪酸浓度测定
1.5.4 粪便菌群分析
1.6 数据处理和统计分析
2 结果与分析
2.1 低聚异麦芽糖合生元对犊牛肠道通透性指标的影响
表3 低聚异麦芽糖合生元对犊牛肠道通透性指标的影响Table 3 Effects of isomaltooligosaccharide synbiotics on intestinal permeability indexes of calves |
| 项目 Items | 组别 Groups | P值 P-value | |||
|---|---|---|---|---|---|
| Con | LG | MG | HG | ||
| 第21天 Day 21 | |||||
| D-乳酸 D-LA/(μmol/L) | 58.02±8.04 | 44.89±4.73 | 45.24±12.67 | 41.26±1.51 | 0.239 |
| 二胺氧化酶 DAO/(U/mL) | 12.47±1.73 | 12.44±0.81 | 11.10±4.47 | 12.30±0.41 | 0.497 |
| 内毒素 ET/(EU/mL) | 10.89±0.49a | 9.16±0.74b | 9.64±3.85ab | 10.25±0.07ab | 0.023 |
| 第42天 Day 42 | |||||
| D-乳酸 D-LA/(μmol/L) | 48.47±2.16a | 37.74±0.72b | 34.26±0.94b | 39.72±6.24b | 0.015 |
| 二胺氧化酶 DAO/(U/L) | 17.73±0.86a | 14.68±1.63ab | 13.76±0.94b | 16.46±1.22ab | 0.042 |
| 内毒素 ET/(EU/mL) | 17.06±0.27 | 15.85±0.52 | 15.66±0.38 | 16.92±1.89 | 0.436 |
同行数据肩标不同小写字母表示差异显著(P<0.05),相同或无字母表示差异不显著(P>0.05)。下表同。 | |
In the same row, values with different small letter superscripts mean significant difference (P<0.05), while with the same or no letter superscripts mean no significant difference (P>0.05). The same as below. |
2.2 低聚异麦芽糖合生元对犊牛粪便短链脂肪酸浓度的影响
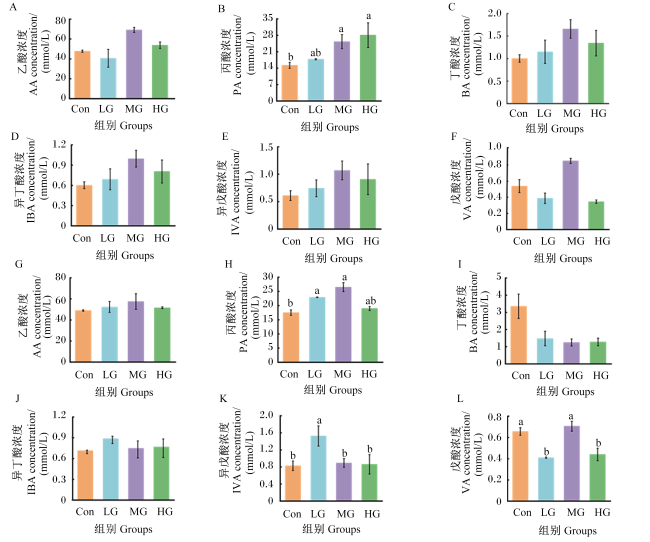
图1 低聚异麦芽糖合生元对犊牛粪便中短链脂肪酸浓度的影响A~F:试验第21天犊牛粪便中短链脂肪酸浓度;G~K:试验第42天犊牛粪便中短链脂肪酸浓度。数据柱标注不同小写字母表示差异显著(P<0.05),相同或无字母表示差异不显著(P>0.05)。下图同。 Fig.1 Effects of isomaltooligosaccharide synbiotics on SCFAs concentrations in feces of calves A to F: the concentrations of SCFAs in the feces of calves on day 21 of the experiment; G to K: the concentrations of SCFAs in the feces of calves on day 42 of experiment. Value columns with different small letters mean significant difference (P<0.05), while with the same or no letters mean no significant difference (P>0.05). The same as below. |
2.3 低聚异麦芽糖合生元对犊牛粪便菌群的影响
2.3.1 粪便样品测序质量评估及操作分类单元(OTUs)
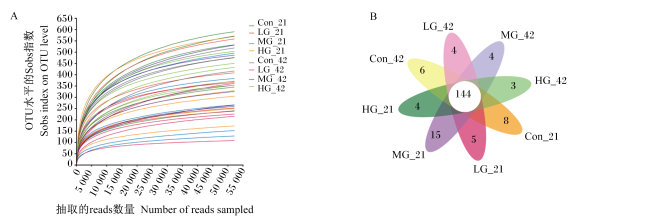
图2 测序质量评估及粪便菌群OTUsA:稀释曲线;B:基于粪便菌群OTUs的韦恩图。Con_21:Con组第21天;LG_21:LG组第21天;MG_21:MG组第21天;HG_21:HG组第21天;Con_42:Con组第42天;LG_42:LG组第42天;MG_42:MG组第42天;HG_42:HG组第42天。下图同。 Fig.2 Sequencing quality assessment and fecal microbiota OTUs A: dilution curve; B: Venn map based on OTUs of fecal microbiota.Con_21: Con group on day 21; LG_21: LG group on day 21; MG_21: MG group on day 21; HG_21: HG group on day 21; Con_42: Con group on day 42; LG_42: LG group on day 42; MG_42: MG group on day 42; HG_42: HG group on day 42. The same as below. |
2.3.2 低聚异麦芽糖合生元对犊牛粪便菌群多样性的影响
表4 低聚异麦芽糖合生元对犊牛粪便菌群Alpha多样性的影响Table 4 Effects of isomaltooligosaccharide synbiotics on Alpha diversity of fecal microbiota of calve |
| 项目 Items | 组别 Groups | P值 P-value | |||
|---|---|---|---|---|---|
| Con | LG | MG | HG | ||
| 第21天 Day 21 | |||||
| Ace指数 Ace index | 524.64±145.62 | 412.16±128.32 | 342.01±146.90 | 386.91±138.10 | 0.330 |
| Chao1指数 Chao1 index | 517.63±135.61 | 406.18±127.17 | 338.46±158.23 | 378.24±143.82 | 0.349 |
| Shannon指数 Shannon index | 3.48±0.49 | 3.62±0.46 | 3.08±0.69 | 3.38±0.60 | 0.601 |
| Simpson指数 Simpson index | 0.09±0.04 | 0.07±0.03 | 0.11±0.05 | 0.08±0.03 | 0.607 |
| 第42天 Day 42 | |||||
| Ace指数 Ace index | 514.95±63.27a | 304.63±117.02b | 450.10±115.21a | 480.83±60.05a | 0.027 |
| Chao1指数 Chao1 index | 504.95±63.84a | 296.68±110.49b | 432.49±126.27ab | 473.39±61.09a | 0.033 |
| Shannon指数 Shannon index | 3.26±1.09 | 2.94±0.56 | 3.41±0.51 | 3.82±0.24 | 0.348 |
| Simpson指数 Simpson index | 0.21±0.23 | 0.12±0.06 | 0.08±0.03 | 0.05±0.01 | 0.249 |
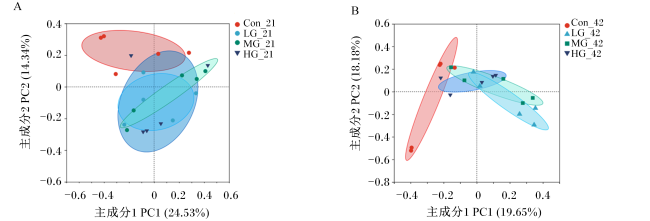
2.3.3 低聚异麦芽糖合生元对犊牛粪便菌群结构的影响
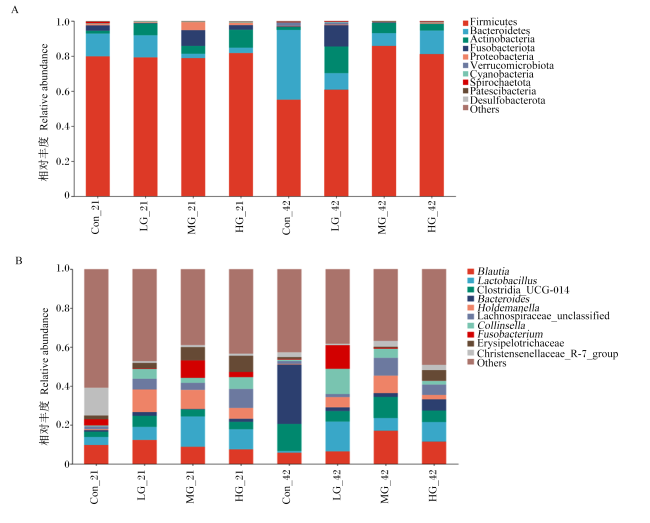
图4 低聚异麦芽糖合生元对犊牛粪便菌群组成的影响Firmicutes:厚壁菌门;Bacteroidetes:拟杆菌门;Actinobacteria:放线菌门Fusobacteriota:梭杆菌门;Proteobacteria:变形菌门;Verrucomicrobiota:疣微菌门;Cyanobacteria:蓝藻菌门;Spirochaetota:螺旋体菌门;Patescibacteria:髌骨菌门;Desulfobacterota:脱硫杆菌门;Blautia:经黏液真杆菌属;Lactobacillus:乳杆菌属;Clostridia_UCG-014:梭菌纲UCG-014;Bacteroides:拟杆菌属;Holdemanella:霍尔德曼氏菌属;Lachnospiraceae_unclassified:毛螺菌科未分类属;Collinsella:柯林斯菌属;Fusobacterium:梭杆菌属;Erysipelotrichaceae:丹毒丝菌科;Christensenellaceae_R-7_group:克里斯滕森菌科R-7群;Others:其他。 Fig.4 Effects of isomaltooligosaccharide synbiotics on composition of fecal microbiota of calves |
表5 低聚异麦芽糖合生元对犊牛粪便菌群优势菌门相对丰度的影响Table 5 Effects of isomaltooligosaccharide synbiotics on relative abundances of dominant bacteria phyla in fecal microbiota of calves% |
| 项目 Items | 组别 Groups | P值 P-value | |||
|---|---|---|---|---|---|
| Con | LG | MG | HG | ||
| 第21天 Day 21 | |||||
| 厚壁菌门 Firmicutes | 79.86±5.54 | 79.26±9.10 | 78.83±20.64 | 81.74±6.45 | 0.966 |
| 拟杆菌门 Bacteroidota | 12.98±6.97 | 12.60±9.25 | 2.49±2.77 | 3.04±1.46 | 0.074 |
| 放线菌门 Actinobacteriota | 1.64±0.99b | 6.72±4.02ab | 4.48±2.12ab | 10.25±7.87a | 0.049 |
| 梭杆菌门 Fusobacteriota | 3.06±6.11 | 0.28±0.29 | 8.99±13.56 | 2.63±3.46 | 0.383 |
| 其他 Other | 2.46±1.56 | 1.14±0.75 | 5.21±7.93 | 2.34±0.87 | 0.559 |
| 第42天 Day 42 | |||||
| 厚壁菌门 Firmicutes | 55.13±26.63b | 60.82±12.22ab | 85.79±5.37a | 81.13±10.36ab | 0.029 |
| 拟杆菌门 Bacteroidota | 39.82±28.10 | 9.42±9.59 | 7.47±6.08 | 13.42±11.21 | 0.262 |
| 放线菌门 Actinobacteriota | 1.68±1.14 | 15.21±13.59 | 5.65±5.22 | 3.84±2.80 | 0.177 |
| 梭杆菌门 Fusobacteriota | 0.36±0.40 | 12.09±15.56 | 0.34±0.57 | 0.11±0.13 | 0.369 |
| 其他 Other | 3.00±2.29 | 2.46±2.67 | 0.75±0.43 | 1.51±1.04 | 0.352 |
表4 低聚异麦芽糖合生元对犊牛粪便菌群优势菌门相对丰度的影响Table 4 Effects of isomaltooligosaccharide synbiotics on relative abundances of dominant bacteria phyla in fecal microbiota of calves% |
| 项目 Items | 组别 Groups | P值 P-value | ||||||
|---|---|---|---|---|---|---|---|---|
| Con | LG | MG | HG | |||||
| 第21天 Day 21 | ||||||||
| 厚壁菌门 Firmicutes | 79.86±5.54 | 79.26±9.10 | 78.83±20.64 | 81.74±6.45 | 0.966 | |||
| 拟杆菌门 Bacteroidota | 12.98±6.97 | 12.60±9.25 | 2.49±2.77 | 3.04±1.46 | 0.074 | |||
| 放线菌门 Actinobacteriota | 1.64±0.99b | 6.72±4.02ab | 4.48±2.12ab | 10.25±7.87a | 0.049 | |||
| 梭杆菌门 Fusobacteriota | 3.06±6.11 | 0.28±0.29 | 8.99±13.56 | 2.63±3.46 | 0.383 | |||
| 其他 Others | 2.46±1.56 | 1.14±0.75 | 5.21±7.93 | 2.34±0.87 | 0.559 | |||
| 第42天 Day 42 | ||||||||
| 厚壁菌门 Firmicutes | 55.13±26.63b | 60.82±12.22ab | 85.79±5.37a | 81.13±10.36ab | 0.029 | |||
| 拟杆菌门 Bacteroidota | 39.82±28.10 | 9.42±9.59 | 7.47±6.08 | 13.42±11.21 | 0.262 | |||
| 放线菌门 Actinobacteriota | 1.68±1.14 | 15.21±13.59 | 5.65±5.22 | 3.84±2.80 | 0.177 | |||
| 梭杆菌门 Fusobacteriota | 0.36±0.40 | 12.09±15.56 | 0.34±0.57 | 0.11±0.13 | 0.369 | |||
| 其他 Others | 3.00±2.29 | 2.46±2.67 | 0.75±0.43 | 1.51±1.04 | 0.352 | |||
2.3.4 低聚异麦芽糖合生元对犊牛粪便菌群差异物种的影响
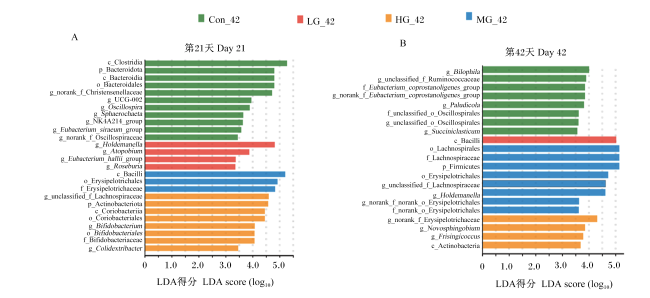
图5 犊牛粪便菌群LEfSe分析c_Clostridia:梭菌纲;p_Bacteroidota:拟杆菌门;c_Bacteroidia:拟杆菌纲;o_Bacteroidales:拟杆菌目;g_norank_f_Christensenellaceae: 克里斯滕森菌科未明确属;g_UCG-002:UCG-002属;g_Oscillospira:颤螺旋菌属;g_Sphaerochaeta:鞘翅属;g_NK4A214_group:NK4A214群;g_Eubacterium_siraeum_group:惰性真杆菌群;g_norank_f_Oscillospiraceae:颤螺菌科未明确属;g_Holdemanella:霍尔德曼氏菌属;g_Atopobium:阿托波氏菌属;g_Eubacterium_hallii_group:哈氏真杆菌群;g_Roseburia:罗氏菌属;c_Bacilli:芽孢杆菌纲;o_Erysipelotrichales:丹毒丝菌目;f_Erysipelotrichaceae:丹毒丝菌科;g_unclassified_f_Lachnospiraceae:毛螺菌科未分类属;p_Actinobacteriota:放线菌门;c_Coriobacteriia:科氏菌门;o_Coriobacteriales:科氏菌目;g_Bifidobacterium:双歧杆菌属;o_Bifidobacteriales:双歧杆菌目;f_Bifidobacteriaceae:双歧杆菌科;g_Colidextribacter:科里氏异质菌属;g_Bilophila:嗜胆菌属;g_unclassified_f_Ruminococcaceae:瘤胃球菌科未分类属;f_Eubacterium_coprostanoligenes_group:产粪甾醇真杆菌科;g_norank_f_Eubacterium_coprostanoligenes_group:产粪甾醇真杆菌科未明确属;g_Paludicola:湿地真菌属;f_unclassified_o_Oscillospirales:颤螺菌目未分类科;g_unclassified_o_Oscillospirales:颤螺菌目未分类属;g_Succiniclasticum:解琥珀酸菌属;c_Bacilli:杆菌纲;o_Lachnospirales:毛螺菌目;f_Lachnospiraceae:毛螺菌科;p_Firmicutes:厚壁菌门;g_Holdemanella:霍尔德曼氏菌属;g_norank_f_norank_o_Erysipelotrichales:丹毒丝菌目未明确科未明确属;f_norank_o_Erysipelotrichales:丹毒丝菌目未明确科;g_norank_f_Erysipelotrichaceae:丹毒丝菌科未明确属;g_Novosphingobium:新鞘氨醇杆菌属;g_Frisingicoccus:弗赖辛球杆菌属;c_Actinobacteria:放线菌纲。 LDA判别图中不同的颜色代表不同的组别,纵坐标表示多组中具有显著差异的微生物,横坐标(LDA分值)表示物种丰度。The different colors in the LDA discrimination chart represent different groups, the vertical axis represents microorganisms with significant differences among multiple groups, and the horizontal axis (LDA score) represents species abundance. Fig.5 LEfSe analysis of fecal microbiota of calves |
2.3.5 犊牛粪便菌群功能预测
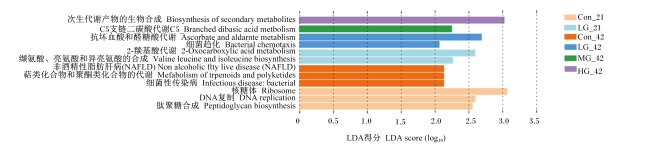
2.4 肠道通透性指标、粪便短链脂肪酸与粪便菌群的相关性分析
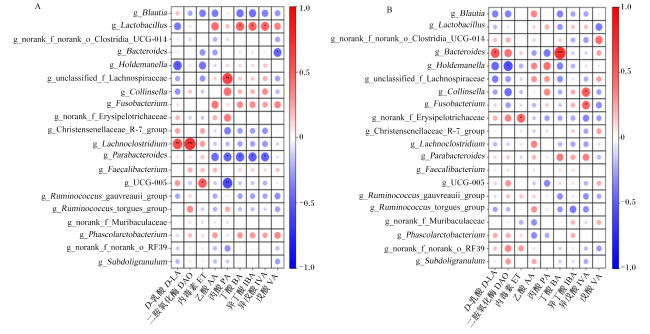
图7 犊牛肠道通透性指标、粪便短链脂肪酸与粪便菌群(相对丰度排名前20的菌属)相关性分析热图g_Blautia:经黏液真杆菌属;g_Lactobacillus:乳杆菌属;g_norank_f_norank_o_Clostridia_UCG-014:梭菌纲UCG-014未明确科未明确属;g_Bacteroides:拟杆菌属;g_Holdemanella:霍尔德曼氏菌属;g_unclassified_f_Lachnospiraceae:毛螺菌科未分类属;g_Collinsella:柯林斯菌属;g_Fusobacterium:梭杆菌属;g_norank_f_Erysipelotrichaceae:丹毒丝菌科未明确属;g_Christensenellaceae_R-7_group:克里斯滕森菌科R-7群; g_Lachnoclostridium:拉克氏梭状芽孢杆菌属;g_Parabacteroides:副拟杆菌属;g_Faecalibacterium:粪杆菌属;g_UCG-005:UCG-005属;g_norank_Ruminococcus_gauvreauii_group:瘤胃球菌gauvreauii组未明确属;g_norank_Ruminococcus_torgues_group:瘤胃球菌torgues组未明确属;g_norank_f_Muribaculaceae:穆氏杆菌科未明确属;g_Phascolarctobacterium:考拉杆菌属;g_norank_f_norank_o_RF39:RF39目未明确科目未明确属;g_Subdoligranulum:罕见小球菌属。 A:试验第21天相关性分析热图;B:试验第42天相关性分析热图。图中颜色深浅表示粪便菌群与肠道通透性指标、粪便短链脂肪酸相关性大小,其中红色表示正相关,蓝色表示负相关。*:P<0.05;**:P<0.01;***:P<0.001。A: correlation analysis heat map on day 21 of the experiment; B: correlation analysis heatmap on day 42 of the experiment. The color depth in the figure indicated the correlation size between intestinal permeability indexes, fecal SCFAs and fecal microbiota, red indicated positive correlation, and blue indicated negative correlation. *: P<0.05; **: P<0.01; ***: P<0.001. Fig.7 Heat map of correlation analysis between intestinal permeability indexes, fecal SCFAs, and fecal microbiota (relative abundance ranking of the top 20 bacterial genera) of calves |
 京公网安备 11010802041926号


