

1 材料与方法
1.1 试验设计和饲料
表1 试验饲料组成、营养水平(风干基础)及饲料成本Table 1 Composition and nutrient levels of experimental diets (air-dry basis) and feed cost% |
| 项目 Items | 大豆油组 SO group | 棉籽油组 CO group |
|---|---|---|
| 原料 Ingredients | ||
| 鱼粉 Fish meal | 34 | 34 |
| 棉籽浓缩蛋白 Cottonseed protein concentration | 24 | 24 |
| 小麦粉 Wheat flour | 22 | 22 |
| 微晶纤维素 Microcrystalline cellulose | 8 | 8 |
| 鱼油 Fish oil | 4 | 4 |
| 大豆油 Soybean oil | 4 | |
| 棉籽油 Cottonseed oil | 4 | |
| 磷脂油 Lecithin | 2 | 2 |
| 预混料 Premix1) | 1 | 1 |
| 磷酸二氢钙 Ca(H2PO4)2 | 1 | 1 |
| 合计 Total | 100 | 100 |
| 营养水平 Nutrient levels2) | ||
| 粗蛋白质 Crude protein | 41.89 | 41.89 |
| 粗脂肪 Crude lipid | 12.21 | 12.21 |
| 水分 Moisture | 6.11 | 5.88 |
| 总能 Gross energy/(MJ/kg) | 20.33 | 20.37 |
| 饲料成本 Feed cost/(RMB/kg) | 12.79 | 12.57 |
1)预混料为每千克饲料提供 Premix provided the following per kilogram of diets: VA 20 mg,VB1 10 mg,VB2 15 mg,VB6 15 mg,VB12 8 mg,VC酯 VC ester 1 000 mg,VD3 10 mg,VE 400 mg,VK3 20 mg,泛酸钙 calcium pantothenate 40 mg,烟酸胺 nicotinamide 100 mg,肌醇 inositol 200 mg,生物素 biotin 2 mg,叶酸 folic acid 10 mg,玉米蛋白粉 corn protein powder 150 mg,FeSO4·H2O 300 mg,ZnSO4·H2O 200 mg,MnSO4·H2O 100 mg,CuSO4·5H2O 10 mg,KI 80 mg,CoCl2·6H2O 5 mg,Na2SeO3 5 mg, NaCl 100 mg,沸石 zeolite 695 mg。 2)营养水平为实测值。Nutrient levels were measured values. |
表2 大豆油和棉籽油脂肪酸组成及2组饲料脂肪酸组成Table 2 Fatty acid composition of soybean oil and cottonseed oil and fatty acid composition of two groups of diets% |
| 项目 Items | 大豆油 Soybean oil | 棉籽油 Cottonseed oil | 大豆油组饲料 SO group diet | 棉籽油组饲料 CO group diet |
|---|---|---|---|---|
| 肉豆蔻酸 C14∶0 | 0.07 | 0.61 | 0.37 | 0.40 |
| 棕榈酸 C16∶0 | 9.44 | 18.10 | 1.86 | 2.26 |
| 硬脂酸 C18∶0 | 3.50 | 1.76 | 0.44 | 0.36 |
| 二十一碳酸 C21∶0 | 0.14 | 0.14 | ||
| 总饱和脂肪酸 ∑SFA | 14.30 | 20.99 | 3.06 | 3.39 |
| 棕榈油酸 C16∶1 | 0.08 | 0.49 | 0.48 | 0.49 |
| 顺-10-十七碳一烯酸 C17∶1 | 0.08 | 0.08 | ||
| 油酸 C18∶1n-9 | 24.60 | 14.50 | 1.86 | 1.65 |
| 鳕鱼酸 C20∶1 | 0.46 | 0.24 | 0.24 | |
| 神经酸 C24∶1 | 0.07 | 0.07 | ||
| 总单不饱和脂肪酸 ∑MUFA | 25.14 | 14.99 | 2.81 | 2.63 |
| 亚麻酸 C18∶3n-3 | 5.37 | 0.14 | 0.51 | 0.23 |
| 二十碳五烯酸 C20∶5 (EPA) | 1.16 | 1.15 | ||
| 二十二碳六烯酸 C22∶6 (DHA) | 1.05 | 1.04 | ||
| 总n-3多不饱和脂肪酸 ∑n-3PUFA | 5.37 | 0.14 | 2.72 | 2.43 |
| 亚油酸 C18∶2n-6 | 49.60 | 59.10 | 3.77 | 3.92 |
| 花生四烯酸 C20∶4n-6 | 0.36 | 0.36 | ||
| 总n-6多不饱和脂肪酸 ∑n-6PUFA | 49.60 | 59.10 | 4.16 | 4.32 |
| 总脂肪酸 ∑FA | 94.41 | 95.22 | 12.74 | 12.76 |
表中数据均为实测值。部分脂肪酸(C4∶0、C12∶0、C13∶0、C15∶0、C17∶0、C20∶0、C22∶0、C23∶0、C24∶0、C14∶1、C15∶1、C22∶1、C18∶3n-6和C20∶2)含量较低(<0.05%),表格中未列出它们的数据。 | |
All data in the table were measured values. Some fatty acids (C4∶0, C12∶0, C13∶0, C15∶0, C17∶0, C20∶0, C22∶0, C23∶0, C24∶0, C14∶1, C15∶1, C22∶1, C18∶3n-6 and C20∶2) contents were lower (<0.05%), and the data of them were not listed in the table. |
1.2 饲养管理
1.3 样品采集
1.4 组织匀浆液制备
1.5 指标检测
1.5.1 生长指标、形体指标及经济效益
存活率(survival rate,SR,%)=(试验结束时鱼尾数/试验开始鱼尾数)×100;
特定生长率(specific growth rate,SGR,%/d)=[(ln鱼体末重-ln鱼体初重)/饲喂天数]×100;
饲料系数(feed conversion ratio,FCR)=摄食量/(末鱼体重+死亡鱼重-初始鱼体重);
摄食率(feeding rate,FR,%/d)={饲料总摄取量/[(末鱼体重+初始鱼体重)/2]/饲喂天数}×100;
蛋白质效率(protein efficiency ratio,PER)=[(末鱼体重-初始鱼体重)/(总摄入量-蛋白总摄入量)]×100;
蛋白质沉积率(protein retention,PR,%)=[(末鱼体蛋白质重量-初始鱼体蛋白质重量)/(蛋白质总摄入量)]×100;
脂肪沉积率(lipid retention,LR,%)=(末鱼体脂肪重量-初始鱼体脂肪重量)/(脂肪总摄入量)×100;
肥满度(condition factor,CF,g/cm3)=鱼体重/鱼体长3;
肝体比(hepatosomatic index,HSI,%)=(肝脏重/全鱼重)×100;
脏体比(viscera somatic index,VSI,%)=(内脏重/全鱼重)×100;
腹脂率(visceral adipose index,VAI,%)=(腹脂重/全鱼重)×100;
胴体比(carcass ratio,CR,%)=(鱼胴体重/全鱼重)×100。
养殖成本(feeding cost,FC,RMB/kg)=饲料系数×饲料成本;
经济利润指数(economic profit index,EPI,
RMB/kg)=(终末体重×鱼售价)-(养殖成本×鱼增重)。
1.5.2 营养水平及脂肪酸含量
1.5.3 血浆和肝脏匀浆生化指标
1.5.4 肝脏基因表达量检测
1.5.5 组织切片制备
1.6 数据统计与分析
2 结果与分析
2.1 大豆油与棉籽油饲料对花鲈生长性能、形体指标、全鱼营养组分、营养转化率及经济效益的影响
表3 大豆油与棉籽油饲料对花鲈生长性能、形体指标、全鱼营养组分、营养转化率及经济效益的影响Table 3 Effects of soybean oil and cottonseed oil diets on growth performance, morphometric parameters, whole-body nutritional components, nutrient conversion rates and economic benefits of spotted seabass |
| 项目 Items | 大豆油组 SO group | 棉籽油组 CO group | P值 P-value |
|---|---|---|---|
| 生长性能 Growth performance | |||
| 存活率 SR/% | 98.00±1.15 | 100.00±0.00 | 0.13 |
| 增重率 WG/% | 183.80±6.03 | 188.75±6.74 | 0.11 |
| 特定生长率 SGR/(%/d) | 1.49±0.03 | 1.52±0.03 | 0.34 |
| 摄食率 FR/(%/d) | 1.61±0.03 | 1.57±0.03 | 0.11 |
| 饲料系数 FCR | 1.17±0.02 | 1.13±0.02 | 0.02 |
| 形体指标 Morphometric parameters | |||
| 肥满度 CF/(g/cm3) | 1.33±0.02 | 1.29±0.03 | 0.45 |
| 脏体比 VR/% | 10.63±0.28 | 10.09±0.32 | 0.18 |
| 肝体比 HSI/% | 0.88±0.05 | 0.94±0.06 | 0.24 |
| 胴体比 CR/% | 73.16±0.42 | 73.24±0.46 | 0.40 |
| 腹脂率 VAI/% | 6.27±0.31 | 5.85±0.34 | 0.30 |
| 全鱼营养组分 Whole-body nutritional components | |||
| 水分 Moisture/% | 68.10±0.38 | 67.74±0.36 | 0.54 |
| 粗灰分 Ash/% | 13.08±0.38 | 12.78±0.14 | 0.83 |
| 粗蛋白质 Crude protein/% | 16.90±0.13 | 16.63±0.19 | 0.30 |
| 粗脂肪 Crude lipid/% | 10.58±0.34 | 11.35±0.28 | 0.13 |
| 总能 Gross energy/(MJ/kg) | 8.35±0.19 | 8.54±0.12 | 0.43 |
| 营养转化率 Nutrient conversion rates | |||
| 蛋白质沉积率 PR/% | 35.11±1.19 | 35.72±0.41 | 0.65 |
| 蛋白质效率 PER | 2.02±0.05 | 2.11±0.03 | 0.20 |
| 脂肪沉积率 LR/% | 84.57±5.08 | 97.40±6.06 | 0.07 |
| 经济效益 Economic benefits | |||
| 养殖成本 FC/(RMB/kg) | 15.11±0.42 | 14.20±0.18 | 0.09 |
| 经济利润指数 EPI/(RMB/kg) | 4.95±0.09 | 5.18±0.11 | 0.17 |
2.2 大豆油与棉籽油饲料对花鲈能量代谢的影响
表4 大豆油与棉籽油饲料对花鲈血浆能量代谢指标的影响Table 4 Effects of soybean oil and cottonseed oil diets on plasma energy metabolism indices of spotted seabasspmol/L |
| 项目 Items | 大豆油组 SO group | 棉籽油组 CO group | P值 P-value |
|---|---|---|---|
| 三碘甲状腺原氨酸 T3 | 262.74±9.40 | 241.12±11.23 | 0.24 |
| 甲状腺素 T4 | 4.41±0.20 | 4.09±0.18 | 0.15 |
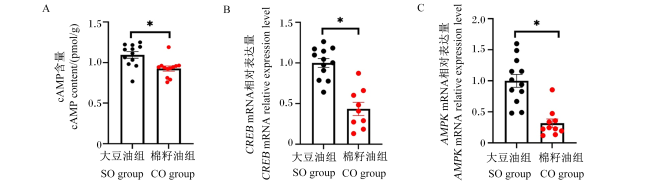
图1 大豆油与棉籽油饲料对花鲈肝脏cAMP含量(A)及能量代谢相关基因CREB(B)和AMPK(C)表达的影响*:差异显著(P<0.05)。下图同。 Fig.1 Effects of soybean oil and cottonseed oil diets on cAMP content (A) and expression of energy metabolism-related genes CREB (B) and AMPK (C) in liver of spotted seabass *: significant difference (P<0.05). The same as below. |
2.3 大豆油与棉籽油饲料对花鲈肝肠组织病理学及免疫的影响
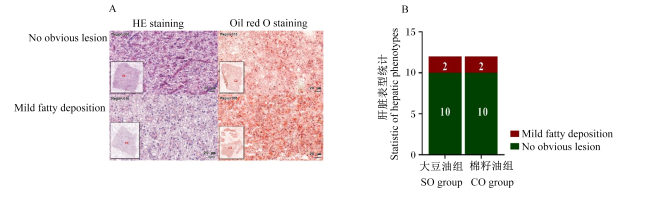
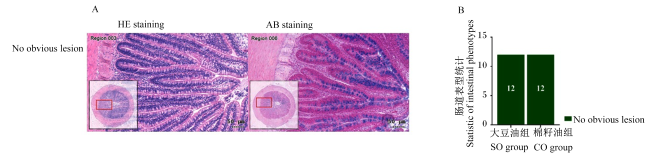
表5 大豆油与棉籽油饲料对花鲈肝脏炎性因子和血浆免疫因子指标的影响Table 5 Effects of soybean oil and cottonseed oil diets on liver inflammatory factor and plasma immune factor indices of spotted seabass |
| 项目 Items | 大豆油组 SO group | 棉籽油组 CO group | P值 P-value |
|---|---|---|---|
| 血浆免疫因子指标 Plasma immune factor indices | |||
| 补体3 C3/(μg/L) | 2.10±0.15 | 2.33±0.09 | 0.20 |
| 免疫球蛋白M IgM/(μg/mL) | 0.30±0.02 | 0.34±0.02 | 0.14 |
| 肝脏炎性因子指标 Liver inflammatory factor indices/(μg/g prot) | |||
| 白细胞介素-10 IL-10 | 0.46±0.06 | 0.44±0.06 | 0.41 |
| 白细胞介素-1β IL-1β | 0.11±0.01 | 0.09±0.01 | 0.80 |
| 肿瘤坏死因子-α TNF-α | 1.53±0.29 | 1.22±0.21 | 0.40 |
2.4 大豆油与棉籽油饲料对花鲈血浆肝功能和脂质代谢指标的影响
表6 大豆油与棉籽油饲料对花鲈血浆肝功能和脂质代谢指标的影响Table 6 Effects of soybean oil and cottonseed oil diets on plasma liver function and lipid metabolism indices of spotted seabass |
| 项目 Items | 大豆油组 SO group | 棉籽油组 CO group | P值 P-value |
|---|---|---|---|
| 血浆肝功能指标 Plasma liver function indices | |||
| 碱性磷酸酶 AKP/(U/mL) | 42.52±2.67 | 51.73±2.75 | 0.01 |
| 谷草转氨酶 AST/(U/L) | 4.90±0.89 | 9.17±2.00 | 0.08 |
| 谷丙转氨酶 ALT/(U/L) | 3.13±0.64 | 6.20±0.87 | 0.01 |
| 血浆脂质代谢指标 Plasma lipid metabolism indices | |||
| 总胆固醇 TC/(mmol/L) | 3.00±0.17 | 4.14±0.36 | 0.01 |
| 甘油三酯 TG/(mmol/L) | 2.08±0.15 | 3.00±0.22 | 0.07 |
| 低密度脂蛋白胆固醇 LDL-C/(mmol/L) | 0.75±0.05 | 0.76±0.07 | 0.56 |
| 高密度脂蛋白胆固醇 HDL-C/(mmol/L) | 0.84±0.04 | 0.73±0.04 | 0.06 |
| 总胆汁酸 TBA/(μmol/L) | 2.50±0.07 | 13.77±0.24 | 0.01 |
2.5 大豆油与棉籽油饲料对花鲈肝脏脂代谢指标和胆汁酸代谢途径及相关基因表达的影响
表7 大豆油与棉籽油饲料对花鲈肝脏脂质代谢指标的影响Table 7 Effects of soybean oil and cottonseed oil diets on liver lipid metabolism indices of spotted seabassmmol/g prot |
| 项目 Items | 大豆油组 SO group | 棉籽油组 CO group | P值 P-value |
|---|---|---|---|
| 总胆固醇 TC | 0.75±0.08 | 0.60±0.06 | 0.02 |
| 甘油三酯 TG | 8.36±1.42 | 3.77±0.54 | 0.02 |
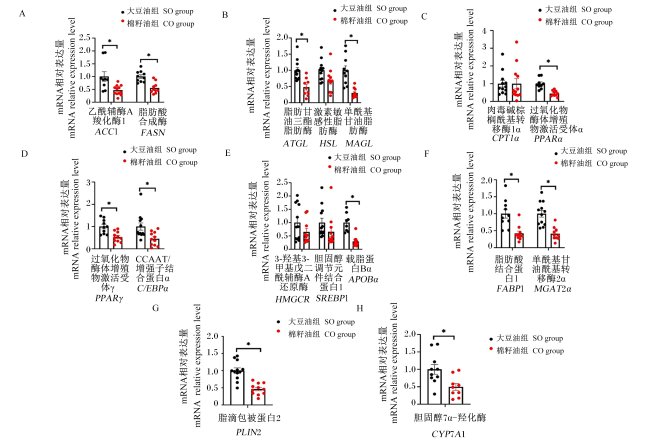
图4 大豆油与棉籽油饲料对花鲈肝脏脂肪代谢相关基因表达的影响A:脂肪生成;B:脂肪分解;C:脂肪酸β氧化;D:脂肪细胞分化;E:胆固醇代谢;F:脂肪淤积;G:脂肪细胞转化;H:胆汁酸代谢。 Fig.4 Effects of soybean oil and cottonseed oil diets on expression of genes related to fat metabolism in liver of spotted seabass A: lipogenesis; B: lipolysis; C: fatty acid β-oxidation; D: adipocyte differentiation; E: cholesterol metabolism; F: adipocyte stasis; G: adipocyte conversion; H: bile acid metabolism. |
2.6 摄食豆油与棉籽油饲料对花鲈肝脏脂肪酸组成的影响
表8 花鲈肝脏脂肪酸组成Table 8 Liver fatty acid composition of spotted seabass% |
| 项目 Items | 大豆油组 SO group | 棉籽油组 CO group | P值 P-value |
|---|---|---|---|
| 肉豆蔻酸 C14∶0 | 0.65±0.05 | 0.64±0.06 | 0.92 |
| 棕榈酸 C16∶0 | 5.41±0.46 | 5.19±0.36 | 0.73 |
| 十七碳酸 C17∶0 | 0.14±0.01 | 0.12±0.03 | 0.40 |
| 硬脂酸 C18∶0 | 1.62±0.08 | 2.78±0.22 | <0.01 |
| 二十一碳酸 C21∶0 | 0.12±0.01 | 0.09±0.02 | 0.11 |
| 二十三碳酸 C23∶0 | 0.10±0.01 | 0.07±0.01 | 0.55 |
| 总饱和脂肪酸 ∑SFA | 8.18±0.61 | 9.05±0.59 | 0.34 |
| 棕榈油酸 C16∶1 | 1.50±0.17 | 0.58±0.09 | <0.01 |
| 十七碳一烯酸 C17∶1 | 0.10±0.01 | 0.08±0.01 | 0.24 |
| 油酸 C18∶1n-9 | 5.54±0.51 | 2.88±0.23 | <0.01 |
| 鳕鱼酸 C20∶1 | 0.36±0.02 | 0.26±0.02 | 0.03 |
| 神经酸 C24∶1 | 0.18±0.00 | 0.15±0.01 | 0.04 |
| 总单不饱和脂肪酸 ∑MUFA | 7.80±0.70 | 3.94±0.36 | <0.01 |
| 亚麻酸 C18∶3n-3 | 0.36±0.03 | 0.18±0.03 | 0.01 |
| 二十碳五烯酸 C20∶5 (EPA) | 1.36±0.07 | 1.19±0.07 | 0.16 |
| 二十二碳六烯酸 C22∶6 (DHA) | 2.63±0.14 | 2.19±0.10 | 0.39 |
| 总n-3多不饱和脂肪酸 ∑n-3PUFA | 4.36±0.24 | 3.57±0.17 | 0.04 |
| 亚油酸 C18∶2 | 3.70±0.30 | 3.79±0.58 | 0.91 |
| 十八碳三烯酸 C18∶3n-6 | 0.34±0.05 | 0.16±0.01 | 0.04 |
| 二十碳二烯酸 C20∶2 | 0.08±0.01 | 0.07±0.01 | 0.30 |
| 二十碳三烯酸 C20∶3n-6 | 0.08±0.01 | 0.05±0.00 | 0.01 |
| 花生四烯酸 C20∶4 | 0.35±0.01 | 0.32±0.02 | 0.13 |
| 总n-6多不饱和脂肪酸 ∑n6-PUFA | 4.56±0.34 | 4.38±0.59 | 0.81 |
| 总脂肪酸 ∑FA | 24.90±1.56 | 20.94±1.38 | 0.11 |
表中数据均为实测值。部分脂肪酸(C4∶0、C6∶0、C12∶0、 C13∶0、 C15∶0、 C20∶0、C24∶0、C14∶1、 C15∶1、 C22∶1和C20∶3n-3)含量较低(<0.05%),表格中未列出它们的数据。 | |
All date in the table were measured values. Some fatty acids (C4∶0, C6∶0, C12∶0, C13∶0, C15∶0, C20∶0, C24∶0, C14∶1, C15∶1, C22∶1 and C20∶3n-3) contents were lower (<0.05%), and the date of them were not listed in the table. |
 京公网安备 11010802041926号


