

1 材料与方法
1.1 试验材料
1.2 试验方法
1.2.1 水蔓菁总黄酮的制备
1.2.2 细胞培养
1.2.3 MTT法检测细胞毒性
细胞存活率(%)=(OD总黄酮组/OD空白对照组)×100。
1.2.4 细胞吞噬能力测定
1.2.5 NO和炎症因子生成量检测
1.2.6 iNOS和COX-2生成量检测
1.2.7 Western blot法检测核因子-κB(NF-κB)信号通路相关蛋白表达
1.3 统计分析
2 结果与分析
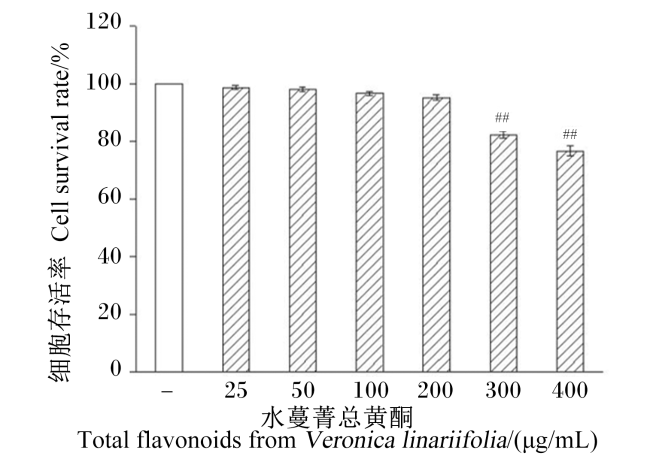
2.1 水蔓菁总黄酮的细胞毒性
2.2 水蔓菁总黄酮对细胞吞噬能力的影响
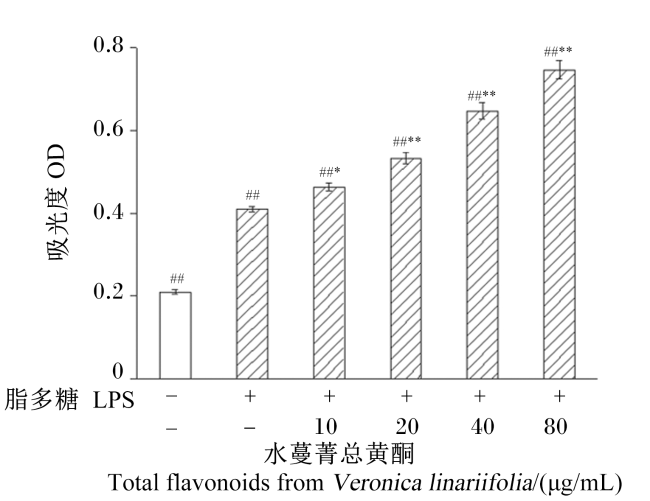
图2 细胞吞噬能力##表示与空白对照组相比差异极显著(P<0.01);*表示与LPS组相比差异显著(P<0.05),**表示与LPS组相比差异极显著(P<0.01)。 Fig.2 Cell phagocytosis capacity ## indicates extremely significant difference compared with blank control group (P<0.01); * indicates significant difference compared with LPS group (P<0.05), and ** indicates extremely significant difference compared with LPS group (P<0.01). |
2.3 水蔓菁总黄酮对NO生成量的影响
表1 水蔓菁总黄酮对NO、炎症因子、iNOS和COX-2生成量的影响Table 1 Effects of total flavonoids from Veronica linariifolia on production of NO, inflammatory factors, iNOS and COX-2 |
| 项目 Items | 空白对照组 Blank control group | LPS组 LPS group | LPS+总黄酮组 LPS+total flavonoids groups | |||
|---|---|---|---|---|---|---|
| 10 μg/mL | 20 μg/mL | 40 μg/mL | 80 μg/mL | |||
| NO/(μmol/mL) | 6.52±0.84 | 72.33±1.32## | 64.47±1.70* | 57.17±1.51** | 46.13±1.36** | 32.47±2.24** |
| IL-1β/(ng/L) | 101.70±2.95 | 507.57±4.10## | 478.80±4.88* | 448.37±5.77** | 346.63±7.69** | 228.03±5.85** |
| IL-6/(ng/L) | 41.73±1.89 | 252.97±3.03## | 233.43±4.48* | 196.50±3.35** | 142.37±3.68** | 79.93±4.28** |
| TNF-α/(ng/L) | 129.18±5.19 | 2 956.91±18.41## | 2 777.99±18.56** | 2 526.10±36.34** | 2 027.56±42.16** | 1 351.86±34.14** |
| PGE2/(ng/L) | 74.80±2.33 | 409.38±5.17## | 360.45±9.55** | 314.33±7.52** | 256.89±11.59** | 173.92±6.41** |
| iNOS/(ng/L) | 65.28±3.25 | 900.26±9.72## | 815.46±11.46* | 669.43±17.25** | 565.25±19.89** | 426.06±23.24** |
| COX-2/(ng/L) | 151.58±7.25 | 1 727.39±13.32## | 1 539.47±19.53** | 1 331.21±27.00** | 1 098.20±56.42** | 875.78±16.55** |
NO:一氧化氮 nitric oxide;IL-1β:白细胞介素-1β interleukin-1β;IL-6:白细胞介素-6 interleukin-6;TNF-α:肿瘤坏死因子-α tumor necrosis factor-α;PGE2:前列腺素E2 prostaglandin E2;iNOS:诱导型一氧化氮合酶 inducible nitric oxide synthase;COX-2:环氧合酶-2 cyclooxygenase-2。 LPS组数据标注##表示与空白对照组相比差异极显著(P<0.01);LPS+总黄酮组数据标注*表示与LPS组相比差异显著(P<0.05),**表示与LPS组相比差异极显著(P<0.01)。下表同。 Data shoulder of LPS group with ## indicates the extremely significant difference compared with the blank control group (P<0.01); data shoulder of LPS+total flavonoids groups with * indicates significant difference compared with LPS group (P<0.05), and with ** indicates the extremely significant difference compared with LPS group (P<0.01). The same as below. |
2.4 水蔓菁总黄酮对炎症因子生成量的影响
2.5 水蔓菁总黄酮对iNOS和COX-2生成量的影响
2.6 水蔓菁总黄酮对NF-κB信号通路相关蛋白表达的影响
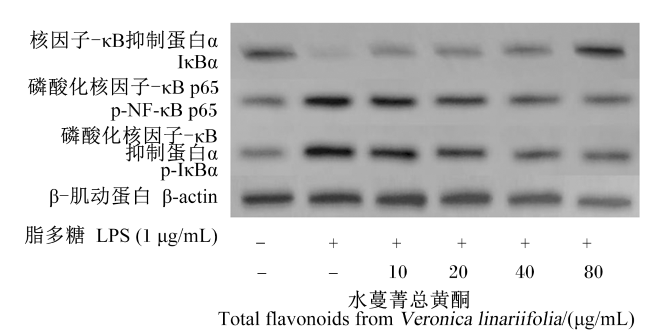
图3 IκBα、p-NF-κB p65和p-IκBα蛋白电泳图Fig.3 Electrophoretogram of IκBα, p-NF-κB p65 and p-IκBα proteins |
表2 水蔓菁总黄酮对IκBα、p-NF-κB p65和p-IκBα蛋白表达量的影响Table 2 Effects of total flavonoids from Veronica linariifolia on protein expression levels of IκBα, p-NF-κB p65 and p-IκBα |
| 项目 Items | 空白对照组 Blank control group | LPS组 LPS group | LPS+总黄酮组 LPS+total flavonoids groups | |||
|---|---|---|---|---|---|---|
| 10 μg/mL | 20 μg/mL | 40 μg/mL | 80 μg/mL | |||
| IκBα | 0.135±0.002 | 0.044±0.003## | 0.059±0.003* | 0.065±0.002** | 0.097±0.004** | 0.123±0.005** |
| p-NF-κB p65 | 0.084±0.001 | 0.972±0.006## | 0.948±0.004* | 0.722±0.006** | 0.575±0.007** | 0.347±0.005** |
| p-IκBα | 0.118±0.003 | 0.277±0.004## | 0.256±0.003* | 0.227±0.004** | 0.174±0.004** | 0.134±0.005** |
IκBα:核因子-κB抑制蛋白α inhibitor α of nuclear factor-κB;p-NF-κB p65:磷酸化核因子-κB p65 phosphorylated nuclear factor-κB p65;p-IκBα:磷酸化核因子-κB抑制蛋白α phosphorylated inhibitor α of nuclear factor-κB。 |
 京公网安备 11010802041926号


