研究论文

茴香渣营养特征分析及其常规养分和矿物元素含量近红外反射光谱预测模型构建

  • 李钰 , 1 ,
  • 李欣荣 2 ,
  • 李开栋 3 ,
  • 郭涛 2 ,
  • 史艳丽 2 ,
  • 李飞 , 2, * ,
  • 年芳 , 1, 4, * ,
  • 徐国延 3 ,
  • 王新基 5 ,
  • 田多湖 6 ,
  • 许辉 7
展开
  • 1 甘肃农业大学动物科学技术学院,兰州 730070
  • 2 兰州大学草地农业科技学院,兰州 730000
  • 3 民勤县农业农村局大滩镇畜牧兽医站,武威 733399
  • 4 甘肃农业大学理学院,兰州 730070
  • 5 民勤县畜牧兽医工作站,武威 733399
  • 6 民勤县职业中等专业学校,武威 733399
  • 7 民勤县德福农业科技有限公司,武威 733399
*李 飞,教授,博士生导师,E-mail: ;
年 芳,教授,硕士生导师,E-mail:

李 钰(1998—),女,甘肃天水人,硕士硕士生,从事饲料资源开发与利用。E-mail:

Copy editor: 武海龙

收稿日期: 2023-12-29

  网络出版日期: 2024-06-07

基金资助

甘肃省重点研发计划(20YF8NH158)

自治区科技支疆计划(2022E02140)

Analysis of Nutritional Characteristics of Fennel Residue and Construction of Near Infrared Reflectance Spectroscopy Predictive Model of Conventional Nutrient and Mineral Element Contents

  • LI Yu , 1 ,
  • LI Xinrong 2 ,
  • LI Kaidong 3 ,
  • GUO Tao 2 ,
  • SHI Yanli 2 ,
  • LI Fei , 2, * ,
  • NIAN Fang , 1, 4, * ,
  • XU Guoyan 3 ,
  • WANG Xinji 5 ,
  • TIAN Duohu 6 ,
  • XU Hui 7
Expand
  • 1 College of Animal Science and Technology, Gansu Agricultural University, Lanzhou 730070, China
  • 2 College of Grassland Agricultural Science and Technology, Lanzhou University, Lanzhou 730000, China
  • 3 Datan Town Animal Husbandry and Veterinary Station, Minqin County Agriculture and Rural Bureau, Wuwei 733399, China
  • 4 College of Science, Gansu Agricultural University, Lanzhou 730070, China
  • 5 Minqin County Animal Husbandry and Veterinary Workstation, Wuwei 733399, China
  • 6 Minqin County Vocational Secondary School, Wuwei 733399, China
  • 7 Minqin County Defu Agricultural Technology Co, Ltd., Wuwei 733399, China
*professor, E-mail: ;
professor, E-mail:

Received date: 2023-12-29

  Online published: 2024-06-07

摘要

本试验旨在分析茴香渣营养特征及构建其常规养分和矿物元素含量近红外反射光谱(NIRS)预测模型。利用NIRS技术结合改良偏最小二乘法(MPLS)分析了103份茴香渣样品中常规养分干物质(DM)、粗蛋白质(CP)、中性洗涤纤维(NDF)、酸性洗涤纤维(ADF)、粗灰分(Ash)、有机物(OM)、粗脂肪(EE)以及矿物元素钙(Ca)、铁(Fe)、钾(K)、磷(P)和镁(Mg)含量的预测模型。结果表明:茴香渣CP和EE含量较高,NDF和ADF含量较低,且矿物元素含量丰富,可作为饲料原料添加到动物饲粮中。构建的预测模型中,常规养分DM、CP、NDF、ADF、Ash、OM和EE含量的预测决定系数(RSQ)分别为0.940、0.922、0.918、0.873、0.847、0.878和0.908,验证相对分析误差(RPD)均大于2.5,预测的准确性较高,取得最佳定标效果。矿物元素Ca、Fe和K含量的RSQ分别为0.912、0.911和0.856,RPD均大于2.5,预测效果较好,可以用于实际生产;Mg含量的RSQ和RPD分别为0.794和2.203,预测效果较弱,仅能粗略预测来进行样品筛选;P含量的RSQ和RPD分别为0.654和1.667,预测效果差,预测值和实测值的误差较大,不能用于实际生产。综上所述,利用NIRS技术建立的预测模型可快速、准确地预测茴香渣中DM、CP、NDF、ADF、Ash、OM、Ca、Fe和K含量。

本文引用格式

李钰 , 李欣荣 , 李开栋 , 郭涛 , 史艳丽 , 李飞 , 年芳 , 徐国延 , 王新基 , 田多湖 , 许辉 . 茴香渣营养特征分析及其常规养分和矿物元素含量近红外反射光谱预测模型构建[J]. 动物营养学报, 2024 , 36(6) : 3973 -3983 . DOI: 10.12418/CJAN2024.340

Abstract

This experiment was conducted to analysis the nutritional characteristics of fennel residue and to construct the near infrared reflectance spectroscopy (NIRS) predictive model of conventional nutrient and mineral element contents. The predictive models for conventional nutrients of dry matter (DM), crude protein (CP), neutral detergent fiber (NDF), acid detergent fiber (ADF), crude ash (Ash), organic matter (OM), ether extract (EE) and mineral elements of calcium (Ca), iron (Fe), kalium (K), phosphorus (P), magnesium (Mg) contents in 103 fennel pomace samples were analyzed using NIRS technology coupled with modified partial least square (MPLS). The results showed that the CP and EE contents in fennel residue were relatively high, the NDF and ADF content were relatively low, and the mineral element contents were rich, which can be added as feed raw materials to animal diet. In the constructed predictive models, the coefficient of determination for validation (RSQ) for conventional nutrient contents of DM, CP, NDF, ADF, Ash, OM and EE were 0.940, 0.922, 0.918, 0.873, 0.830, 0.878 and 0.908, respectively, the ratio of performance to deviation for validation (RPD) were all greater than 2.5, the accuracy of predictive was relatively high, and achieved the optimal calibration effect. The RSQ for mineral element contents of Ca, Fe and K were 0.912, 0.911 and 0.856, respectively, the RPD were all greater than 2.5, the predictive effect was good, and can be used for practical production; the RSQ and RPD for Mg content were 0.794 and 2.203, respectively, the predictive effect was weak, and only roughly predicted the content for sample screening; the RSQ and RPD for P content were 0.654 and 1.667, the predictive effect was bad, and cannot be used in actual production. In summary, the predictive models constructed by using NIRS technique can quickly and accurately predict the contents of DM, CP, NDF, ADF, Ash, OM, Ca, Fe and K in fennel residue.

茴香(Foeniculum vulgare)为伞形科茴香属草本植物[1],主要产区为我国内蒙古、山西和甘肃等地[2-3]。甘肃省民勤县是西北茴香生产的重点产区,茴香产量占全国总产量的70%以上,已成为全国最大的茴香产区[4]。茴香中含有黄酮、多酚、茴香脑和茴香醚等多种活性物质,其整株含芳香油[5-6]。目前小茴香多用其嫩叶和籽,茴香籽脱粒后所得外壳或残骸以及在收获加工或筛选过程中不符合质量标准的农副废弃产品称为茴香渣,未被充分利用的茴香渣通常作为废弃物处理,不仅降低茴香籽的利用率,也会造成环境污染[7],所以通常由农户收集粉碎后饲喂牛、羊,以达到资源再利用的目的。此外,茴香渣中粗蛋白质(crude protein,CP)和粗脂肪(ether extract,EE)含量较高,可作为饲料原料添加到反刍动物饲粮中,对改善饲料转化率、促进动物生长、提高免疫力以及改善肉品质具有潜在功效[8-9]
传统的湿化学分析方法通过检测饲料原料CP、维生素、氨基酸和矿物元素等指标,评价其营养价值,但过程繁琐,不能及时指导生产。近年来,通过建立近红外反射光谱(near infrared reflectance spectroscopy,NIRS)与饲料原料湿化学分析结果之间的关系,推断其成分含量并建立模型,以其高效、无损、低成本以及能够多组分分析等优点,被广泛应用于农业、医学和食品的品质分析[10-11]。许多学者已相继利用NIRS技术建立了青贮饲料[12]、苜蓿干草[13]和棉籽[14]等样品的预测模型。Noel等[15]建立了猪复合饲料中蛋白质和氨基酸的NIRS预测模型。蒋淑丽[16]建立了稻米中钾(kalium,K)、镁(magnesium,Mg)和磷(phosphorus,P)等矿物元素含量的最佳定标模型。代露茗等[17]采用NIRS技术结合改良偏最小二乘法(modified partial least square,MPLS)化学计量学算法,建立了无芒雀麦中K、P、钙(calcium,Ca)、Mg、铁(iron,Fe)和铝(aluminium,Al)等的定量分析模型,其中钙Ca、Mg的定量分析模型均可以用于实际生产。
因此,本试验旨在利用NIRS技术对103份茴香渣样品中常规养分和矿物元素含量进行分析,将湿化学分析值与NIRS数据相结合,构建快速检测牧草含量的方法,为其在反刍动物生产中的应用提供理论依据。

1 材料与方法

1.1 样品的采集与制备

本研究于2022—2023年期间,采集甘肃省民勤县3种不同株型(矮秆、中秆、高秆)茴香渣样品103份。选择不同地区茴香渣样品,田地每个区选择5个点(X法取样),每点为1 m2的范围,在此范围内距地面3~4 cm处割取,将原始样品混合均匀后用分样器缩分至1 000 g装入样品袋,带回实验室检测。检测前再利用四分法将样品缩分至约250 g,用旋风磨(CT293,丹麦FOSS公司)粉碎,过1.00 mm筛,装于自封袋避光常温保存。

1.2 茴香渣常规养分和矿物元素含量分析

干物质(dry matter,DM)含量参照GB/T 6435—2014的方法,采用电热鼓风干燥箱 (HGZF-Ⅱ/H-101-3,上海跃进医疗器械有限公司)测定;CP含量参照GB/T 6432—2018的方法,采用全自动凯氏定氮仪(k1306,上海晟声自动化分析仪器有限公司)测定;中性洗涤纤维(neutral detergent fiber,NDF)和酸性洗涤纤维(acid detergent fiber,ADF)含量使用半自动纤维分析仪(A200i,美国ANKOM公司)测定;EE含量参照GB/T 6433—2006的方法,采用全自动脂肪分析仪(XT15i,美国ANKOM公司)测定;粗灰分(crude ash,Ash)含量参照GB/T 6438—2007的方法,使用马弗炉(SX-G30102,上海量壹科学仪器有限公司)测定。有机物(organic matter,OM)含量=DM-Ash。
矿物元素含量参照GB/T 30902—2014的方法,称取约0.3 g茴香渣样品,加入8.0 mL浓硝酸和1.0 mL过氧化氢,使用微波消解仪(JUPITER-B,上海新仪微波化学科技有限公司)消解,待消解完全后放入赶酸器(TK12,上海新仪微波化学科技有限公司)进行赶酸处理,冷却至室温后,将消化液转移至50 mL容量瓶中,用去离子水稀释,最后使用电感耦合等离子体发射光谱仪(ICP-OES 5800,美国安捷伦科技有限公司),设置等离子气、雾化器和辅助气分别为12.0、0.7、1.0 L/min进行测定。矿物元素分析谱线、标准曲线及相关系数见表1
表1 矿物元素分析谱线、标准曲线及相关系数

Table 1 Analytical line, standard curve and correlation coefficient of mineral elements

项目
Items
分析谱线
Analytical line/nm
标准曲线
Standard curve
相关系数
Correlation coefficient
钾 K 766.491 y=285.013 0x+243.363 7 0.999 1
钙 Ca 422.673 y=755.140 9x+249.324 5 0.999 8
镁 Mg 279.553 y=119.915 1x+40.404 9 0.999 2
磷 P 213.618 y=635.968 0x+26.670 9 0.999 8
铁 Fe 238.204 y=5 985.772 4x+13.410 8 0.999 3

y:光谱吸收强度 spectral absorption intensity;x:矿物元素含量 mineral element contents。

1.3 茴香渣NIRS分析

1.3.1 光谱图采集

使用多功能近红外光谱分析仪(DS2500F,丹麦FOSS公司)扫描样品,采集得到光谱范围在850~2 500 nm、光谱分辨率为0.5 nm的光谱图。样品扫描前,先将仪器预热,使用check sample样品杯扫描,每份样品均进行2次扫描,控制每次装样的深度,表面保持平整,最终计算平均光谱,并用于进一步的预处理。

1.3.2 预测模型的建立与验证

本研究使用WinISI Ⅳ软件进行茴香渣常规养分和矿物元素含量预测模型的构建、验证和评价。首先对所有样品光谱数据进行主成分分析(principal component analysis,PCA),剔除异常值,根据全局距离(global hood,GH)≥3以及“T检验”(T>2.5)剔除5个异常样品,剩余103份样品将其光谱数据与各常规养分和矿物元素含量湿化学分析数据结合,按照4∶1的比例将样品分为定标集(n=83)、验证集(n=20),结合MPLS构建预测模型[18-19]

1.3.3 预测模型的评价

化学计量学模型的性能是以交叉验证相关系数(1-VR)、定标标准误差(SEC)、交叉验证标准误差(SECV)值为对比初步确定最佳定标模型进行评估。若1-VR值越大,SEC和SECV值越小,则模型效果越好。采用验证集对所建各营养成分最优定标模型进行外部验证,预测决定系数(RSQ)越接近1.0,说明模型准确性越高;若0<RSQ≤0.25,则建立的预测模型不可用;在外部验证阶段,用验证相对分析误差(RPD)对所建模型的准确性进行验证,若RPD>2.5,表明该模型优良,可用于质量评价;若2.0≤RPD≤2.5,表明该模型满足筛选牧草品质的粗略分析;若RPD<2.0,表明该模型预测效果较差,模型不可用[20]

2 结果

2.1 茴香渣光谱图

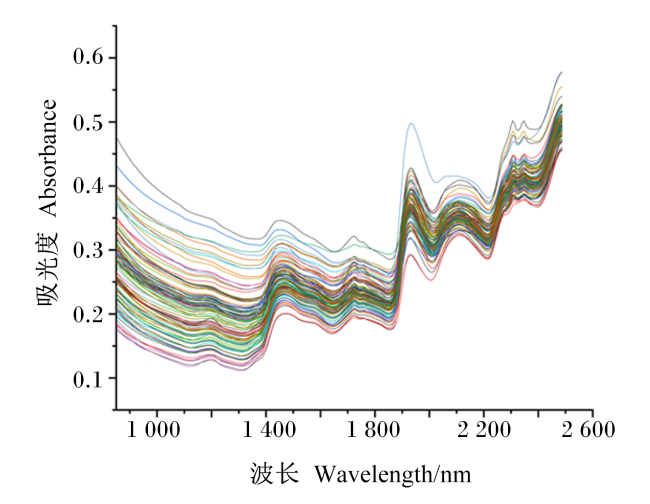
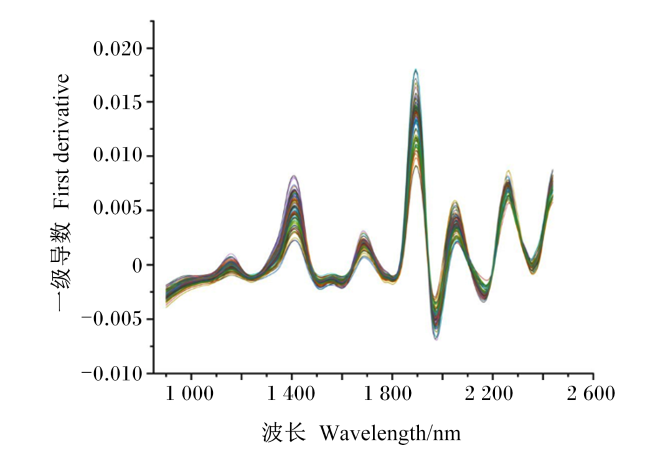
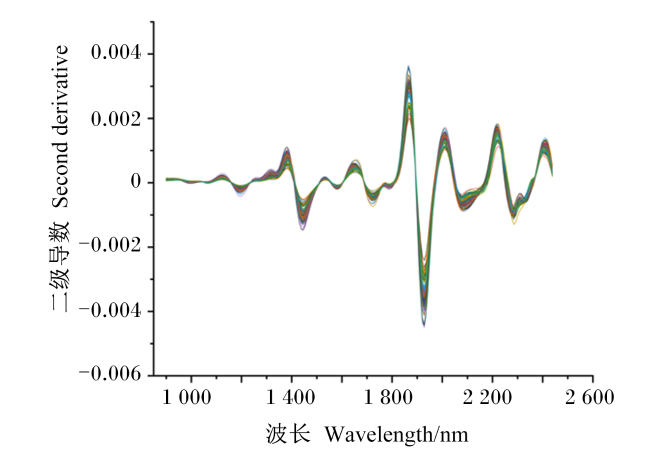
对每份样品重复装样扫描2次,得到茴香渣近红外原始光谱图(图1)。在全光谱范围(850~2 500 nm)内,茴香渣样品的光谱信息反射峰的位置与峰个数基本一致,没有经过预处理不能辨别光谱中是否存在噪音等相关干扰信息,可以看出光谱中存在基线漂移和非线性等散射效应,为了消除环境和样品颗粒大小等因素影响,分别进行一阶导数(图2)和二阶导数(图3)的处理。经过导数处理后,光谱的特征性显著增强,消除了基线漂移和重叠峰的影响。
图1 茴香渣近红外原始光谱图

Fig.1 Near-infrared original spectrogram of fennel residue

图2 茴香渣一阶导数处理光谱图

Fig.2 Spectrogram of first derivative treatment of fennel residue

图3 茴香渣二阶导数处理光谱图

Fig.3 Spectrogram of second derivative treatment of fennel residue

2.2 茴香渣各营养成分含量分析

茴香渣常规养分和矿物元素含量见表2,其中茴香渣DM、CP、NDF、ADF、Ash、OM、EE、K、Ca、Mg、P和Fe含量分别为83.87%~95.58%、7.39%~19.39%、31.62%~62.48%、21.78%~46.55%、10.08%~29.17%、53.30%~89.92%、2.13%~12.82%、1.28%~3.51%、0.64%~3.76%、0.36%~1.23%、0.16%~0.44%和0.03%~0.84%;平均值分别为92.91%、12.05%、45.87%、33.40%、17.55%、81.80%、4.13%、2.55%、1.64%、0.72%、0.26%和0.17%;变异系数分别为1.64%、18.01%、13.17%、7.51%、25.43%、7.34%、35.85%、19.70%、30.98%、24.07%、22.98%和83.87%。
表2 茴香渣常规养分和矿物元素含量(干物质基础)

Table 2 Conventional nutrient and mineral element contents of fennel residue (DM basis)

项目
Items
样本数量
Sample number
最小值
Minimum/%
最大值
Maximum/%
平均值
Mean/%
标准差
SD
变异系数
CV/%
全集
Entire set
干物质 DM 103 83.87 95.58 92.91 1.52 1.64
粗蛋白质 CP 103 7.39 19.39 12.05 2.17 18.01
中性洗涤纤维 NDF 103 31.62 62.48 45.87 5.41 13.17
酸性洗涤纤维 ADF 103 21.78 46.55 33.40 4.40 7.51
粗灰分 Ash 103 10.08 29.17 17.55 4.46 25.43
有机物 OM 103 53.30 89.92 81.80 6.00 7.34
粗脂肪 EE 103 2.13 12.82 4.13 1.48 35.85
钾 K 103 1.28 3.51 2.55 0.50 19.70
钙 Ca 103 0.64 3.76 1.64 0.51 30.98
镁 Mg 103 0.36 1.23 0.72 0.17 24.07
磷 P 103 0.16 0.44 0.26 0.05 22.98
铁 Fe 103 0.03 0.84 0.17 0.14 83.87
定标集
Calibration set
干物质 DM 83 88.46 95.58 92.56 1.28 1.39
粗蛋白质 CP 83 8.66 16.72 11.96 1.56 14.70
中性洗涤纤维 NDF 83 33.00 62.48 45.94 5.42 11.80
酸性洗涤纤维 ADF 83 24.88 46.55 33.47 4.29 12.82
粗灰分 Ash 83 11.01 24.01 17.52 4.28 24.43
有机物 OM 83 57.7 88.99 81.91 5.56 6.78
粗脂肪 EE 83 2.13 8.56 3.98 1.03 25.99
钾 K 83 1.28 3.51 2.56 0.15 20.02
钙 Ca 83 0.81 3.20 1.63 0.45 27.68
镁 Mg 83 0.36 1.23 0.71 0.17 24.24
磷 P 83 0.18 0.39 0.25 0.05 19.84
铁 Fe 83 0.03 0.59 0.16 0.13 78.19
验证集
Validation set
干物质 DM 20 89.33 94.65 92.53 1.18 1.28
粗蛋白质 CP 20 9.42 15.53 11.98 1.67 13.95
中性洗涤纤维 NDF 20 34.52 54.30 45.31 4.49 9.91
酸性洗涤纤维 ADF 20 25.94 41.93 33.29 3.90 11.71
粗灰分 Ash 20 11.27 27.88 17.59 4.40 25.03
有机物 OM 20 70.53 86.74 81.45 4.23 5.23
粗脂肪 EE 20 2.66 6.22 3.91 0.84 21.47
钾 K 20 1.64 3.45 2.61 0.49 18.83
钙 Ca 20 0.94 2.66 1.62 0.47 28.93
镁 Mg 20 0.46 1.18 0.72 0.17 23.72
磷 P 20 0.18 0.38 0.25 0.05 19.84
铁 Fe 20 0.04 0.48 0.16 0.12 76.42

2.3 定标集样品的最佳定标方式及模型参数

采用MPLS分别对不同预处理的光谱进行建模分析,建立的茴香渣常规养分和矿物元素含量最佳定标模型见表3,其中DM的光谱预处理和导数处理最优组合分别为加权多元散射校正(weighted multiplicative scattering correction,weighted MSC)和2,4,4,1;CP的光谱预处理和导数处理最优组合分别为weighted MSC和2,4,4,1;NDF的光谱预处理和导数处理最优组合分别为标准多元散射校正(standard multiplicative scattering correction,standard MSC)和1,4,4,1;ADF的光谱预处理和导数处理最优组合分别为standard MSC和1,4,4,1;Ash的光谱预处理和导数处理最优组合为无处理(none)和0,0,1,1;OM的光谱预处理和导数处理最优组合分别为范围和二次(scale and quadratic)和1,4,4,1;EE的光谱预处理和导数处理最优组合分别为反向多元散射校正(inverse multiplicative scattering correction,inverse MSC)和2,4,4,1;矿物元素中K的光谱预处理和导数处理最优组合分别为standard MSC和1,4,4,1;Ca的光谱预处理和导数处理最优组合分别为inverse MSC和1,4,4,1;Mg的光谱预处理和导数处理最优组合分别为weighted MSC和1,4,4,1;P的光谱预处理和导数处理最优组合分别为scale and quadratic和0,0,1,1;Fe的光谱预处理和导数处理最优组合分别为标准正态变量变换和散射(standard normal variate and detrend,SNV and detrend)和2,4,4,1。并以交叉验证方式进行预测,以具有最低的SECV值和最高的1-VR值定标模型作为最优定标模型,茴香渣常规养分和矿物元素定标的SECV和1-VR值如下:DM为0.196和0.974,CP为0.405和0.946,NDF为1.499和0.925,ADF为1.074和0.928,Ash为1.497和0.881,OM为1.756和0.888,EE为0.243和0.934,K为0.180和0.865,Ca为0.108和0.941,Fe为0.026和0.950,上述10个指标定标模型较为准确(1-VR值均大于0.85),可有效用于实际检测;而Mg和P定标的SECV值分别为0.035、0.021,1-VR值分别为0.756、0.794,1-VR值小于0.8,模型效果不理想,不能用于实际检测。
表3 茴香渣常规养分和矿物元素含量最佳定标模型

Table 3 Optimal calibration model of conventional nutrient and mineral element contents of fennel residue

项目
Items
样本数量
Sample
number
光谱预处理
Spectrum
pretreatment
导数处理最优组合
Derivative teatment
optimal combination
决定
系数
R2
定标标
准误差
SEC
交叉验证
标准误差
SECV
交叉验证
相关系数
1-VR
干物质 DM 83 weighted MSC 2,4,4,1 0.995 0.079 0.196 0.974
粗蛋白质 CP 83 weighted MSC 2,4,4,1 0.987 0.120 0.405 0.946
中性洗涤纤维 NDF 83 standard MSC 1,4,4,1 0.942 1.321 1.499 0.925
酸性洗涤纤维 ADF 83 standard MSC 1,4,4,1 0.957 0.839 1.074 0.928
粗灰分 Ash 83 none 0,0,1,1 0.918 1.219 1.497 0.881
有机物 OM 83 scale and quadratic 1,4,4,1 0.951 1.162 1.756 0.888
粗脂肪 EE 83 inverse MSC 2,4,4,1 0.976 0.147 0.243 0.934
钾 K 83 standard MSC 1,4,4,1 0.923 0.136 0.180 0.865
钙 Ca 83 inverse MSC 1,4,4,1 0.968 0.080 0.108 0.941
镁 Mg 83 weighted MSC 1,4,4,1 0.923 0.031 0.035 0.756
磷 P 83 scale and quadratic 0,0,1,1 0.817 0.020 0.021 0.794
铁 Fe 83 SNV and detrend 2,4,4,1 0.992 0.010 0.026 0.950

weighted MSC:加权多元散射校正 weighted multiplicative scattering correction;standard MSC:标准多元散射校正 standard multiplicative scattering correction;none:无处理 non-treated;scale and quadratic:范围和二次;inverse MSC反向多元散射校正 inverse multiplicative scattering correction;SNV and detrend:标准正态变量变换和散射 standard normal variate and detrend。

2.4 茴香渣常规养分和矿物元素含量最优定标模型外部验证

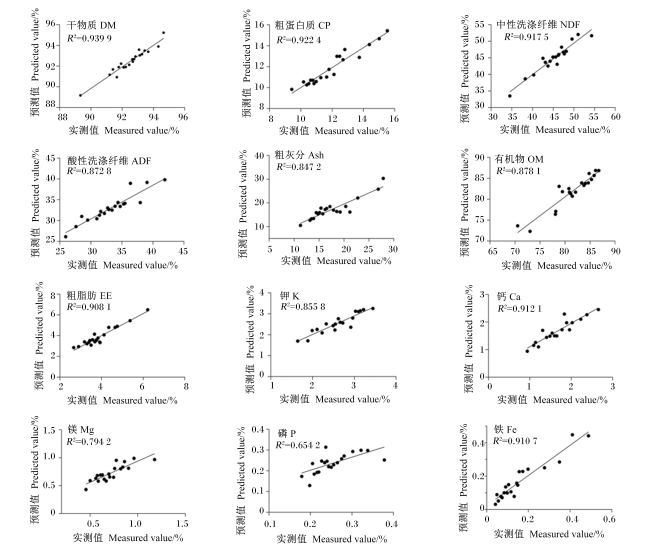
模型建立后利用验证集进行外部验证,茴香渣常规养分和矿物元素含量最优定标模型外部验证结果见表4。构建的预测模型中,茴香渣常规养分DM、CP、NDF、ADF、Ash、OM和EE含量的RSQ分别为0.940、0.922、0.918、0.873、0.847、0.878和0.908,RPD分别为4.029、3.561、3.453、2.739、2.679、2.856和3.242。矿物元素K、Ca、Mg、P和Fe含量的RSQ分别为0.856、0.912、0.794、0.654和0.911,RPD分别为2.576、3.310、2.203、1.677和3.378。其中,常规养分DM、CP、NDF、EE含量最佳定标模型的RPD>3.0,预测精度高,模型效果优良,ADF、Ash和OM含量的RPD在2.5~3.0,预测模型能用于实际生产;矿物元素Ca、Fe和K含量最佳定标模型的RPD>2.5,预测模型准确性相对较高,Mg含量的RPD在2.0~2.5,模型能粗略的筛选样品,而P含量的RPD<2.0,预测模型不可用。验证集实测值与预测值之间的相关性分析结果见图4,其中DM的相关性较好,P的相关性最差。
表4 茴香渣常规养分和矿物元素含量最优定标模型外部验证

Table 4 External verification of optimal calibration model for conventional nutrient and mineral element contents of fennel residue

项目
Items
实测值
Measured value/%
预测值
Predictive value/%
预测决定系数
RSQ
预测标准误差
SEP
验证相对分析误差
RPD
干物质 DM 92.53 92.48 0.940 0.315 4.029
粗蛋白质 CP 11.98 11.89 0.922 0.469 3.561
中性洗涤纤维 NDF 45.31 44.99 0.918 1.301 3.453
酸性洗涤纤维 ADF 33.28 33.06 0.873 1.413 2.739
粗灰分 Ash 17.51 17.23 0.847 1.852 2.679
有机物 OM 81.45 81.87 0.878 1.493 2.856
粗脂肪 EE 3.91 3.90 0.908 0.289 3.242
钾 K 2.609 2.554 0.856 0.191 2.576
钙 Ca 1.663 1.643 0.912 0.145 3.310
镁 Mg 0.696 0.704 0.794 0.064 2.203
磷 P 0.248 0.231 0.654 0.027 1.667
铁 Fe 0.163 0.171 0.911 0.019 3.378
图4 茴香渣常规养分和矿物元素含量实测值与预测值的相关性

Fig.4 Correlation between measured value and predicted value of conventional nutrient and mineral element contents of fennel residue

3 讨论

随着人们对畜产品消费需求的持续增长,饲草饲料供不应求现状日益突出,而我国牧草资源开发利用率依然较低,因此合理有效地利用种类丰富的粗饲料对反刍动物饲养意义重大[21]。本研究测得茴香渣中营养组成含量差异较大,CP和EE含量高达12.05%和4.13%;NDF和ADF含量较低,分别为45.87%和33.40%。茴香渣中木质化程度较低,刘婷等[22]在利用茴香秸秆和茴香秕壳评定绵羊价值中,测得茴香秸秆和茴香秕壳中NDF和ADF消化率分别为54.95%、53.02%和52.18%、49.50%,绵羊对茴香秕壳的消化率较高;茴香秕壳的纤维含量低,促消化作用显著,提高了饲料利用率和转化率。茴香中矿物元素含量丰富,本研究测得茴香渣中K、Ca、Mg、P和Fe含量分别为2.55%、1.64%、0.72%、0.26%和0.17%;孙亮等[23]测得小茴香中钠(Na)、Mg、Ca、Fe、锌(Zn)和锰(Mn)等矿物元素含量与本研究结果相似。茴香中含挥发性油、黄酮和反式茴香脑等,对动物内脏系统和免疫系统有一定作用[24],作为饲料添加剂添加在动物饲粮中,可以改善饲粮适口性,从而达到提高动物生长性能和改善肉品质的作用[25]
NIRS技术是一种间接分析技术,通过建立NIRS与样品理化分析结果之间的对应关系,根据待分析样品的NIRS来推断其成分含量[26]。20世纪70年代,Norris等[27]首次利用NIRS技术检测了饲草中CP、NDF、DM和EE等指标,证实了能够利用NIRS技术快速测定牧草营养成分含量的可行性,但预测的准确性会受到诸多因素的影响,环境变化、样品背景与状态、仪器性能以及湿化学分析误差都会影响测定结果,因此在建模分析前,需要对采集的NIRS数据进行预处理,以尽可能消除光谱噪声的影响[28]
本研究对103份茴香渣样品的常规养分和矿物元素含量进行了快速分析,构建的茴香渣样品中,DM含量的RPD高达4.029,模型的准确性较高,这与饲料中DM含量高有直接关系,高含量组分化学测定的绝对误差小,测量结果的准确性高,所以建立模型的精度也相应较高[29];CP含量预测模型的RPD为3.561,预测效果较好,与薛祝林等[13]利用NIRS技术预测苜蓿草中CP含量的研究结果相似;NDF和ADF含量与许瑞轩等[30]快速预测苜蓿鲜草中的研究对比发现,本研究预测模型的RPD为3.453和2.739,模型预测的准确性较高;EE含量预测模型的RPD为3.242,预测结果与王勇生等[31]对高粱样品的研究结果一致,预测的准确性较高,与张书阅等[32]在燕麦草中的研究结果不同,这可能是由于茴香渣样品中湿化学分析数值变异范围较宽、变异系数较大;Ash含量预测模型的RPD相比其他指标较低,Ash是OM质经高温灼烧氧化后剩余的残渣,主要为矿物质氧化物或盐类等无机物质,对其定标只能根据与其他营养成分的相关来进行,这种间接定标方法累加其他营养成分化学值的误差和扫描图谱的误差,使Ash含量的预测效果没有其他的营养成分好[33-34]。构建的预测模型中,矿物元素Ca、Fe和K含量预测模型的RPD在2.576~3.378,预测模型准确性较高,这与余恩[14]的研究结果相似,可能是由于Ca、Fe和K本身在样品中含量相对较高,与OM的结合更充分,分布均匀且变异范围较大,这可能是NIRS技术能够准确测定茴香渣中Ca、Fe和K的基础[14];Mg含量的预测决定系数为0.794,RPD为2.203,只能粗略的筛选样品,造成预测集决定系数较低的原因可能是由于其变异范围较小,与样品中OM结合不够充分,且其中所含C-O、C-H等光谱所能吸收或结合的基团少,故无法进一步提升其预测模型的精度[35-36];P含量预测模型准确性最差,而Costa等[37]利用NIRS技术结合偏最小二乘法回归分析建立的巴西蜂花粉矿物元素含量预测模型中,P含量预测模型的RPD为2.8,预测效果较好。茴香渣中P含量的预测效果差可能是由于样品变异范围相对较小,与样品中OM结合不够密切,在NIRS区域无吸收,不利于预测模型的构建,可通过增加样品集的个数、扩大样品浓度范围,进一步优化模型参数[38-39]

4 结论

① 茴香渣常规养分DM、CP、NDF、ADF、Ash、OM和EE含量预测模型的RPD均高于2.5,建立的预测模型效果优良,可用于实际检测。
② 茴香渣矿物元素Ca、Fe和K含量预测模型可用于准确预测;Mg含量的预测性较弱,能够粗略筛选样品;而P含量的预测效果较差,不能用于实际生产。
[1]
马梦梅, 木泰华, 闫治斌, 等. 茴香及其秸秆膳食纤维的组成成分、结构与物化功能特性[J]. 中国食品学报, 2016, 16(5):205-216.

MA M M, MU T H, YAN Z B, et al. Chemical composition,structure,physicochemical and functional properties of dietary fiber obtained from fenneland its straw[J]. Journal of Chinese Institute of Food Science and Technology, 2016, 16(5):205-216. (in Chinese)

[2]
范昌发, 何兴金, 贾敬芬, 等. 中国茴香属的比较研究及分类处理意见[J]. 植物研究, 2001, 21(3):350-355.

FAN C F, HE X J, JIA J F, et al. Comparative studies on Foeniculum miller in china and the taxonomic treatment[J]. Bulletin of Botanical Research, 2001, 21(3):350-355. (in Chinese)

[3]
JANSEN P C M. Spices,condiments and medicinal plants in Ethiopia,their taxonomy and agricultural significance[M]. Wageningen: Centre for Agricultural Publishing an and Documentation,1981.

[4]
王情, 黄谊, 王未, 等. 小茴香精油的提取工艺研究[J]. 云南化工, 2023, 50(6):17-19.

WANG Q, HUANG Y, WANG W, et al. Study on extraction of essential oil from fennel[J]. Yunnan Chemical Technology, 2023, 50(6):17-19. (in Chinese)

[5]
梁焕, 安岳. 不同主产区小茴香药材质量评价[J]. 中国农学通报, 2023, 39(19):148-152.

DOI

LIANG H, AN Y. The quality evaluation of Foeniculi fructus from different production origins[J]. Chinese Agricultural Science Bulletin, 2023, 39(19):148-152. (in Chinese)

[6]
孟君, 彭秀丽, 郭全海, 等. 小茴香、桂皮中微量元素含量及溶出特性的研究[J]. 中国调味品, 2023, 48(10):60-65.

MENG J, PENG X L, GUO Q H, et al. Content and dissolution characteristics of trace elements in fennel and cinnamon[J]. China Condiment, 2023, 48(10):60-65. (in Chinese)

[7]
陈务平, 齐亚楠, 李金苗, 等. 小茴香秸秆组分分析及薄片生产工艺[J]. 中华纸业, 2015, 36(10):37-40.

CHEN W P, QI Y N, LI J M, et al. Fennel stalk composition analysis and the sheet production process[J]. China Pulp & Paper Industry, 2015, 36(10):37-40. (in Chinese)

[8]
畅宝花, 刘伟, 翟书林, 等. 煤矿沉陷区混播比例及添加剂对紫花苜蓿和无芒雀麦混贮品质的影响[J]. 饲料研究, 2021, 44(2):105-109.

CHANG B H, LIU W, ZHAI S L, et al. Effect of mixed planting ratio and additives on quality of alfalfa and Bromus inermis in coal mine subsidence area[J]. Feed Research, 2021, 44(2):105-109. (in Chinese)

[9]
李喜艳, 王加启, 魏宏阳, 等. 微量元素在反刍动物生产中的应用[J]. 中国畜牧兽医, 2009, 36(8):10-13.

LI X Y, WANG J Q, WEI H Y, et al. Advanced research of trace elements on the production of ruminant[J]. China Animal Husbandry & Veterinary Medicine, 2009, 36(8):10-13. (in Chinese)

[10]
路茂菊. 试述近红外光谱分析在食品药品检测中的应用[J]. 临床医药文献电子杂志, 2018, 5(29):181.

LU M J. Application of near-infrared spectroscopy analysis in food and drug detection[J]. Electronic Journal of Clinical Medical Literature, 2018, 5(29):181. (in Chinese)

[11]
马宇璇. 近红外光谱技术在食品检测与质量控制中的应用[J]. 现代食品, 2016(3):99-100.

MA Y X. Application of near infrared spectroscopy in food inspection and quality control[J]. Modern Food, 2016(3):99-100. (in Chinese)

[12]
杨雪萍, 陈菲, 倪奎奎, 等. 近红外光谱分析技术在青贮饲料营养品质检测评价上的研究进展[J]. 饲料工业, 2020, 41(10):19-23.

YANG X P, CHEN F, Ni K K, et al. Research progress of near infrared reflectance spectroscopy (NIRS) on silage[J]. Feed Industry, 2020, 41(10):19-23. (in Chinese)

[13]
薛祝林, 刘楠, 张英俊. 近红外光谱法预测紫花苜蓿草捆的营养品质和消化率[J]. 草地学报, 2017, 25(1):165-171.

DOI

XUE Z L, LIU N, ZHANG Y J. Nutritional quality and digestibility evaluation of alfalfa hay bale by near infrared reflectance[J]. Acta Agrestia Sinica, 2017, 25(1):165-171. (in Chinese)

[14]
余恩. 棉籽无机元素含量的近红外测定方法研究[D]. 硕士学位论文. 杭州: 浙江大学, 2016.

YU E. Determination of inorganic element content in cottonseed meal using near-infrared spectrometry (NIRS)[D]. Master’s Thesis. Hangzhou: Zhejiang University, 2016. (in Chinese)

[15]
NOEL S J, JØRGENSEN H J H, BACH KNUDSEN K E. Prediction of protein and amino acid composition and digestibility in individual feedstuffs and mixed diets for pigs using near-infrared spectroscopy[J]. Animal Nutrition, 2021, 7(4):1242-1252.

DOI PMID

[16]
蒋淑丽. 稻米矿质元素分析及其近红外测定技术的研究[D]. 博士学位论文. 杭州: 浙江大学, 2007.

JIANG S L. The study of determination and the calibration model optimization by near infrared reflectance spectroscopy (NIRS) for mineral element contents in rice (Oryza stativa L.)[D]. Ph.D.Thesis. Hangzhou: Zhejiang University, 2007. (in Chinese)

[17]
代露茗, 郭涛, 史艳丽, 等. 基于近红外光谱技术分析无芒雀麦元素含量[J]. 草业科学, 2023, 40(6):1497-1506.

DAI L M, GUO T, SHI Y L, et al. Analysis of element content in Bromus inermis based on near infrared spectroscopy technology[J]. Pratacultural Science, 2023, 40(6):1497-1506. (in Chinese)

[18]
闫佰鹏, 王芳彬, 李成海, 等. 利用近红外光谱技术快速评定油菜秸秆的营养价值[J]. 草业科学, 2019, 36(2):522-530.

YAN B P, WANG F B, LI C H, et al. Rapid evaluation of nutritional value of rape straw by near infrared spectroscopy[J]. Pratacultural Science, 2019, 36(2):522-530. (in Chinese)

[19]
ANDERSON J V, WITTENBERG A, LI H, et al. High throughput phenotyping of Camelina sativa seeds for crude protein,total oil,and fatty acids profile by near infrared spectroscopy[J]. Industrial Crops and Products, 2019,137:501-507.

[20]
REDDERSEN B, FRICKE T, WACHENDORF M. Effects of sample preparation and measurement standardization on the NIRS calibration quality of nitrogen,ash and NDF content in extensive experimental grassland biomass[J]. Animal Feed Science & Technology, 2013, 183(3/4):77-85.

[21]
贾存辉, 钱文熙, 吐尔逊阿依·赛买提, 等. 粗饲料营养价值指数及评定方法[J]. 草业科学, 2017, 34(2):415-427.

JIA C H, QIAN W X, SAIMAITI T E X A Y, et al. Roughage nutritional value evaluation indices and research methods[J]Pratacultural Science, 2017, 34(2):415-427. (in Chinese)

[22]
刘婷, 郑琛, 李发弟, 等. 茴香秸秆和茴香秕壳对绵羊营养价值的评定[J]. 草业学报, 2012, 21(5):55-62.

LIU T, ZHENG C, LI F D, et al. Nutritional evaluation of fennel straw and shell on sheep[J]. Acta Prataculturae Sinica, 2012, 21(5):55-62. (in Chinese)

[23]
孙亮, 杨欣欣, 包永睿, 等. 抗癌中药小茴香中无机元素的含量测定[J]. 中国药物评价, 2013, 30(3):129-131.

SUN L, YANG X X, BAO Y R, et al. Determination of inorganic elements in Foeniculi fructus by ICP-MS[J]. Chinese Journal of Drug Evaluation, 2013, 30(3):129-131. (in Chinese)

[24]
白琨, 李艳, 蔡伟. 和田茴香籽总黄酮提取及体内抗氧化活性研究[J]. 中国调味品, 2023, 48(8):199-202.

BAI K, LI Y, CAI W. Study on extraction of total flavonoids from Hetian fennel seeds and their antioxidant activity in vivo[J]. China Condiment, 2023, 48(8):199-202. (in Chinese)

[25]
佈音, 孙景琦, 张志娟, 等. 小茴香饲料调味剂对蛋鸡产蛋性能的影响[J]. 内蒙古农牧学院学报, 1993, 14(3):73-79.

BU Y, SUN J Q, ZHANG Z J, et al. Effects of fennel forage-blending agent on laying performance of chickens[J]. Journal of Inner Mongolia Institute of Agriculture and Animal Husbandry, 1993, 14(3):73-79. (in Chinese)

[26]
陈瀑, 戴嘉伟, 李敬岩, 等. 近红外光谱分析中的化学计量学方法进展[J]. 化学试剂, 2023, 45(6):105-112.

CHEN P, DAI J W, LI J Y, et al. Progress of chemometric methods in near-infrared spectroscopy[J]. Chemical Reagents, 2023, 45(6):105-112. (in Chinese)

[27]
NORRIS K H, BARNES R F, MOORE J E, et al. Predicting forage quality by infrared replectance spectroscopy[J]. Journal of Animal Science, 1976, 43(4):889-897.

[28]
褚小立, 史云颖, 陈瀑, 等. 近五年我国近红外光谱分析技术研究与应用进展[J]. 分析测试学报, 2019, 38(5):603-611.

CHU X L, SHI Y Y, CHEN P, et al. Research and application progresses of near infrared spectroscopy analytical technique in China in past five years[J]. Journal of Instrumental Analysis, 2019, 38(5):603-611. (in Chinese)

[29]
褚小立. 化学计量学方法与分子光谱分析技术[M]. 北京: 化学工业出版社, 2011.

CHU X L. Molecular spectroscopy analytical technology combined with chemometrics and its applications[M]. Beijing: Chemical Industry Press, 2011. (in Chinese)

[30]
许瑞轩, 李东宁, 杨东海, 等. 近红外光谱法田间快速估测新鲜紫花苜蓿品质[J]. 光谱学与光谱分析, 2013, 33(11):3010-3013.

XU R X, LI D N, YANG D H, et al. Rapid estimation of fresh alfalfa quality by near-infrared spectroscopy in the field[J]. Spectroscopy and Spectral Analysis, 2013, 33(11):3010-3013. (in Chinese)

[31]
王勇生, 李洁, 王博, 等. 基于近红外光谱扫描技术对高粱中粗脂肪、粗纤维、粗灰分含量的测定方法研究[J]. 中国粮油学报, 2020, 35(3):181-185.

WANG Y S, LI J, WANG B, et al. Research on measurement of crude fat,crude fiber and ash contents in sorghum using near-infrared reflectance spectroscopy method[J]. Journal of the Chinese Cereals and Oils Association, 2020, 35(3):181-185. (in Chinese)

[32]
张书阅, 熊安然, 潘予琮, 等. 燕麦草常规营养成分含量近红外预测模型的建立[J]. 动物营养学报, 2022, 34(2):1334-1342.

DOI

ZHANG S Y, XIONG A R, PAN Y C, et al. Near infrared prediction model establishment for conventional nutrient contents of oat grass[J]. Chinese Journal of Animal Nutrition, 2022, 34(2):1334-1342. (in Chinese)

[33]
韩冉. 傅立叶近红外测定豆粕、菜籽粕的常规化学成分以及粒度对模型的影响[D]. 硕士学位论文. 雅安: 四川农业大学, 2007.

HAN R. Fourier near-infrared determinate soyabean,rape-seed meal routine chemical composition and granularity to model influence[D]. Master’s Thesis. Ya’an: Sichuan Agricultural University, 2007. (in Chinese)

[34]
郭丽丽. 便携式近红外仪在反刍动物饲料质量分析中的应用研究[D]. 硕士学位论文. 北京: 中国农业科学院, 2021.

GUO L L. Study on feed quality analysis of ruminants by portable near infrared spectrometer[D]. Master’s Thesis. Beijing: Chinese Academy of Agricultural Sciences, 2021. (in Chinese)

[35]
刘哲, 王玉琴, 薛树媛, 等. 近红外漫反射光谱定量分析天然牧草营养成分[J]. 草地学报, 2018, 26(1):249-255.

DOI

LIU Z, WANG Y Q, XUE S Y, et al. Quantitative analysis of herbage nutritional components on natural pasture by near infrared diffuse reflectance spectroscopy[J]. Acta Agrestia Sinica, 2018, 26(1):249-255. (in Chinese)

DOI

[36]
CUQ S, LEMETTER V, KLEIBER D, et al. Assessing macro- (P,K,Ca,Mg) and micronutrient (Mn,Fe,Cu,Zn,B) concentration in vine leaves and grape berries of Vitis vinifera by using near-infrared spectroscopy and chemometrics[J]. Computers and Electronics in Agriculture, 2020,179:105841.

[37]
COSTA M C A, MORGANO M A, FERREIRA M M C, et al. Quantification of mineral composition of Brazilian bee pollen by near infrared spectroscopy and PLS regression[J]. Food Chemistry, 2019,273:85-90.

[38]
代露茗, 郭涛, 李飞, 等. 无芒雀麦营养成分含量近红外预测模型的分析与建立[J]. 中国草地学报, 2023, 45(6):134-142.

DAI L M, GUO T, LI F, et al. Analysis and establishment of near infrared prediction models for nutrient content of Bromus inermis[J]. Chinese Journal of Grassland, 2023, 45(6):134-142. (in Chinese)

[39]
CHEN H Z, LIU X K, CHEN A, et al. Parametric-scaling optimization of pretreatment methods for the determination of trace/quasi-trace elements based on near infrared spectroscopy[J]. Spectrochimica Acta Part A:Molecular and Biomolecular Spectroscopy, 2020,229:117959.

文章导航

/