

1 材料与方法
1.1 试验时间与地点
1.2 试验材料与饲粮设计
表1 基础饲粮组成及营养水平(干物质基础)Table 1 Composition and nutrient levels of the basal diet (DM basis) % |
| 原料Ingredients | 含量Content | 营养水平Nutrient levels2) | 含量Content | |
|---|---|---|---|---|
| 青贮玉米Silage corn | 60.00 | 消化能DE/(MJ/kg) | 5.77 | |
| 玉米Corn | 21.00 | 粗蛋白质CP | 11.40 | |
| 小麦秸秆Wheat straw | 8.00 | 中性洗涤纤维NDF | 60.97 | |
| 豆粕Soybean meal | 7.40 | 酸性洗涤纤维ADF | 35.97 | |
| 麦麸Wheat bran | 1.60 | 粗灰分Ash | 15.22 | |
| 氯化钠NaCl | 0.32 | 钙Ca | 0.62 | |
| 磷酸氢钙CaHPO4 | 0.32 | 磷P | 0.32 | |
| 预混料Premix1) | 1.36 | |||
| 合计Total | 100.00 |
1)预混料为每千克饲粮提供 The premix provided the following per kg of the diet:Cu (as copper sulfate) 10 mg,Fe (as ferrous sulfate) 50 mg,Zn (as zinc sulfate)30 mg,Mn (as manganese sulfate) 40 mg,I (as potassium iodide) 0.5 mg,VA 2 200 IU,VD 275 IU,VE 15 IU。 2)消化能为计算值(参照NY/T 815—2004计算),其余为实测值。DE was a calculated value referred to NY/T 815—2004, while the others were measured values. |
1.3 试验设计及饲养管理
1.4 样品采集及处理
1.5 测定指标及方法
1.5.1 营养物质表观消化率测定
1.5.2 瘤胃发酵指标测定
1.5.3 瘤胃和粪便微生物区系测定
1.6 数据统计分析
2 结果与分析
2.1 CBet对育肥后期平凉红牛营养物质表观消化率的影响
表2 CBet对育肥后期平凉红牛营养物质表观消化率的影响Table 2 Effects of CBet on nutrient apparent digestibility of Pingliang red cattle in late fattening stage % |
| 项目 Items | 对照组 Control group | 试验Ⅰ组 Experimental group I | 试验Ⅱ组 Experimental group Ⅱ | P值 P-value |
|---|---|---|---|---|
| 干物质DM | 81.67±0.29 | 84.48±0.09 | 83.67±1.39 | 0.119 |
| 粗蛋白质CP | 67.44±1.54b | 72.61±0.36a | 69.58±0.99ab | 0.039 |
| 粗脂肪EE | 60.28±0.48 | 64.52±2.18 | 63.68±1.45 | 0.201 |
| 酸性洗涤纤维ADF | 36.46±1.08Bb | 46.42±0.96Aa | 45.11±1.91Aa | 0.004 |
| 中性洗涤纤维NDF | 50.38±1.10 | 54.70±2.51 | 52.05±1.41 | 0.295 |
同行数据肩标无字母或相同小写字母表示差异不显著(P>0.05),不同小写字母表示差异显著(P<0.05),不同大写字母表示差异极显著(P<0.01)。下表同。 | |
In the same row, values with no letter or the same small letter superscripts mean no significant difference (P>0.05), while with different small letter superscripts mean significant difference (P<0.05), and with different capital letter superscripts mean extremely significant difference (P<0.01). The same as below. |
2.2 CBet对育肥后期平凉红牛瘤胃发酵特性的影响
表3 CBet对育肥后期平凉红牛瘤胃发酵特性的影响Table 3 Effects of CBet on rumen fermentation characteristics of Pingliang red cattle in late fattening stage |
| 项目 Items | 对照组 Control group | 试验Ⅰ组 Experimental group Ⅰ | 试验Ⅱ组 Experimental group Ⅱ | P值 P-value |
|---|---|---|---|---|
| pH | 6.54±0.05Aa | 6.09±0.09Bb | 6.08±0.12Bb | 0.004 |
| 氨态氮NH3-N/(mg/dL) | 12.35±0.13A | 11.28±0.43B | 9.44±0.11C | <0.001 |
| 总挥发性脂肪酸TVFA/(mmol/L) | 101.28±5.92 | 122.00±4.77 | 120.76±13.19 | 0.253 |
| 乙酸Acetate/% | 73.19±2.62b | 78.90±0.81a | 76.60±1.02ab | 0.035 |
| 丙酸Propionate/% | 13.61±0.55 | 14.21±0.32 | 14.00±0.54 | 0.737 |
| 丁酸Butyrate/% | 9.05±0.35Bb | 10.05±0.45Aa | 9.33±0.11Bb | 0.004 |
| 异丁酸Isobutyrate/% | 0.63±0.06 | 0.66±0.05 | 0.64±0.02 | 0.922 |
| 戊酸Valerate/% | 0.59±0.05Bb | 0.78±0.01Aa | 0.69±0.02ABab | 0.002 |
| 异戊酸Isovalerate/% | 0.89±0.01 | 0.94±0.02 | 0.90±0.06 | 0.629 |
| 乙酸/丙酸Acetate/propionate | 5.43±0.38 | 5.58±0.22 | 5.51±0.30 | 0.940 |
2.3 CBet对育肥后期平凉红牛瘤胃微生物区系的影响
2.3.1 瘤胃微生物区系α多样性分析
表4 CBet对育肥后期平凉红牛瘤胃微生物区系α多样性的影响Table 4 Effects of CBet on α diversity in rumen microbiota of Pingliang red cattle in late fattening stage |
| 项目 Items | 对照组 Control group | 试验Ⅰ组 Experimental group Ⅰ | 试验Ⅱ组 Experimental group Ⅱ | P值 P-value |
|---|---|---|---|---|
| OTU数目OTU number | 1 181.00±64.45 | 1 379.00±96.11 | 1 372.83±114.73 | 0.270 |
| Chao1指数Chao1 index | 1 182.21±64.13 | 1 380.75±96.24 | 1 374.72±114.50 | 0.267 |
| Shannon指数Shannon index | 8.85±0.09Bb | 9.19±0.09Aa | 9.22±0.05Aa | 0.008 |
| Simpson指数Simpson index | 0.99±0.01 | 0.99±0.01 | 0.99±0.01 | 0.106 |
| 系统发育多样性指数PD index | 96.72±8.22 | 106.56±4.18 | 103.98±7.27 | 0.600 |
2.3.2 瘤胃微生物区系β多样性分析
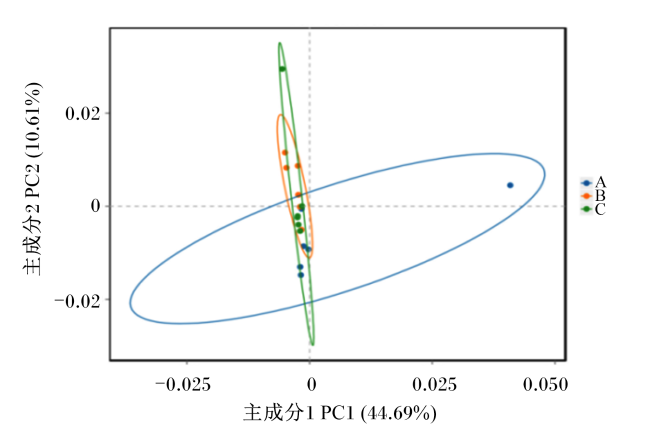
图1 平凉红牛瘤胃微生物区系主成分分析A表示对照组瘤胃样本,B表示试验Ⅰ组瘤胃样本,C表示试验Ⅱ组瘤胃样本。图2和图3同。 Fig.1 PCA of rumen microbiota of Pingliang red cattle A represented rumen samples in the control group, B represented rumen samples in the experimental group Ⅰ, and C represented rumen samples in the experimental group Ⅱ. The same as Fig.2 and Fig.3. |
2.3.3 瘤胃微生物区系组成分析
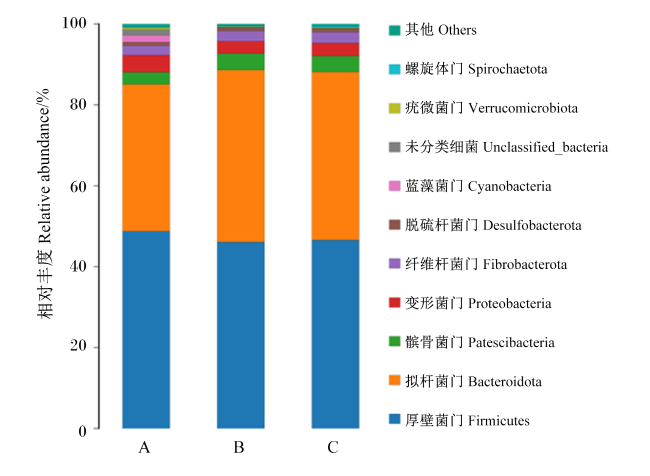
表5 CBet对育肥后期平凉红牛瘤胃微生物区系相对丰度的影响Table 5 Effects of CBet on relative abundance of rumen microbiota of Pingliang red cattle in late fattening stage % |
| 项目 Items | 对照组 Control group | 试验Ⅰ组 Experimental group Ⅰ | 试验Ⅱ组 Experimental group Ⅱ | P值 P-value |
|---|---|---|---|---|
| 门Phylum | ||||
| 厚壁菌门Firmicutes | 48.80±3.42 | 46.09±4.58 | 46.57±2.96 | 0.424 |
| 拟杆菌门Bacteroidota | 37.00±11.80 | 42.26±3.94 | 41.85±3.13 | 0.415 |
| 髌骨菌门Patescibacteria | 3.13±1.92 | 4.07±1.09 | 3.84±0.91 | 0.488 |
| 变形菌门Proteobacteria | 3.82±6.03 | 3.06±1.47 | 2.98±1.94 | 0.913 |
| 纤维杆菌门Fibrobacterota | 2.46±1.30 | 2.74±1.18 | 2.72±1.02 | 0.898 |
| 属Genus | ||||
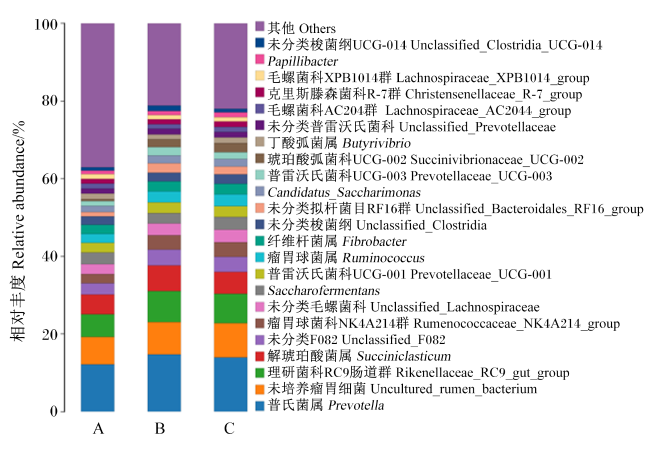
| 普氏菌属Prevotella | 12.76±0.56 | 14.60±3.62 | 14.00±1.49 | 0.750 |
| 未培养瘤胃细菌Uncultured_rumen_bacterium | 7.23±3.74 | 8.31±1.14 | 8.74±0.62 | 0.514 |
| 理研菌科RC9肠道群Rikenellaceae_RC9_gut_group | 6.02±2.63 | 8.06±0.95 | 7.80±1.39 | 0.137 |
| 解琥珀酸菌属Succiniclasticum | 5.25±2.64 | 6.58±0.70 | 5.50±0.81 | 0.354 |
2.4 CBet对育肥后期平凉红牛粪便微生物区系的影响
2.4.1 粪便微生物区系α多样性分析
表6 CBet对育肥后期平凉红牛粪便微生物区系α多样性的影响Table 6 Effects of CBet on α diversity in fecal microbiota of Pingliang red cattle in late fattening stage |
| 项目 Items | 对照组 Control group | 试验Ⅰ组 Experimental group Ⅰ | 试验Ⅱ组 Experimental group Ⅱ | P值 P-value |
|---|---|---|---|---|
| OTU数目OTU number | 980.17±93.12 | 1 009.83±57.32 | 963.00±81.23 | 0.914 |
| Chao1指数Chao1 index | 981.36±92.97 | 1 011.5457.12 | 964.95±81.13 | 0.914 |
| Shannon指数Shannon index | 8.87±0.13 | 8.97±0.05 | 8.77±0.11 | 0.408 |
| Simpson指数Simpson index | 0.99±0.00 | 0.99±0.00 | 0.99±0.00 | 0.434 |
| 系统发育多样性指数PD index | 59.95±4.63 | 59.65±2.98 | 56.74±4.07 | 0.820 |
2.4.2 粪便微生物区系β多样性分析
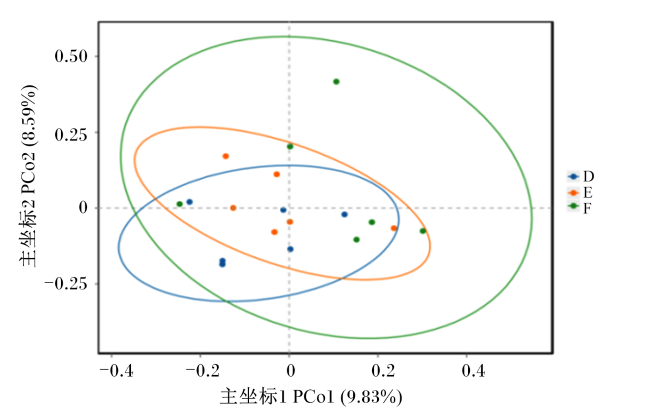
图4 平凉红牛粪便微生物区系主坐标分析D表示对照组粪便样本,E表示试验Ⅰ组粪便样本,F表示试验Ⅱ组粪便样本。图5和图6同。 Fig.4 PCoA of fecal microbiota of Pingliang red cattle D represented fecal samples in the control group, E represented fecal samples in the experimental group Ⅰ, and F represented rumen samples in the experimental group Ⅱ. The same as Fig.5 and Fig.6. |
2.4.3 粪便微生物区系组成分析
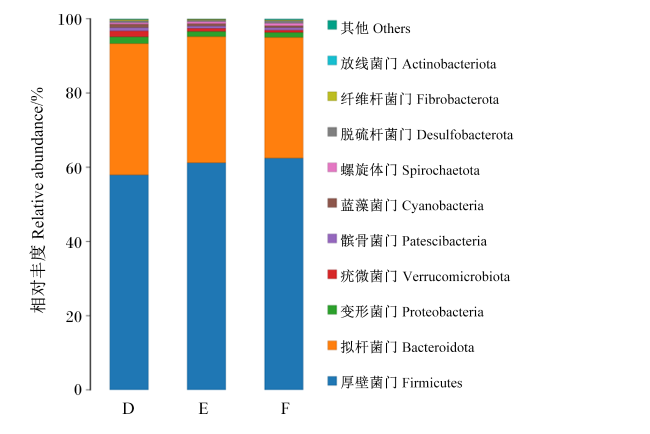
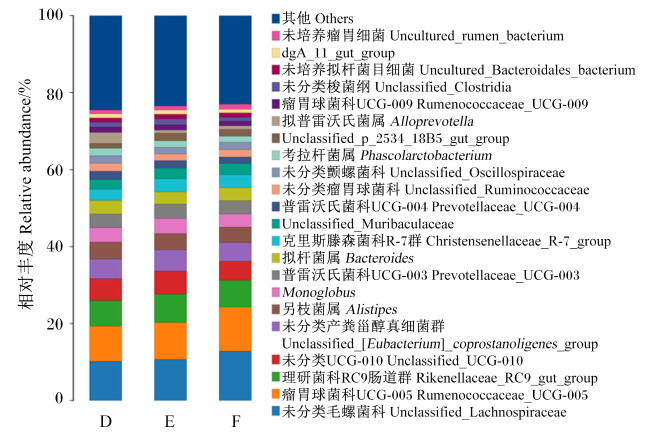
表7 CBet对育肥后期平凉红牛粪便微生物区系相对丰度的影响Table 7 Effects of CBet on relative abundance of fecal microbiota of Pingliang red cattle in late fattening stage % |
| 项目 Items | 对照组 Control group | 试验Ⅰ组 Experimental group Ⅰ | 试验Ⅱ组 Experimental group Ⅱ | P值 P-value |
|---|---|---|---|---|
| 门Phylum | ||||
| 厚壁菌门Firmicutes | 57.63±4.70 | 60.93±3.37 | 62.76±2.62 | 0.078 |
| 拟杆菌门Bacteroidota | 35.56±3.67 | 34.29±3.11 | 32.34±2.46 | 0.230 |
| 变形菌门Proteobacteria | 1.89±1.31 | 1.34±0.48 | 1.31±0.70 | 0.473 |
| 疣微菌门Verrucomicrobiota | 1.74±1.69 | 0.81±0.31 | 0.63±0.44 | 0.164 |
| 属Genus | ||||
| 未分类毛螺菌科Unclassified_Lachnospiraceae | 10.09±3.41 | 10.50±2.25 | 13.05±3.13 | 0.208 |
| 瘤胃球菌科UCG-005 Rumenococcaceae_UCG-005 | 9.23±1.44 | 9.53±1.36 | 11.76±3.12 | 0.112 |
| 理研菌科RC9肠道群 Rikenellaceae_RC9_gut_group | 6.52±0.54 | 7.42±0.66 | 6.76±0.88 | 0.109 |
| 未分类UCG-010 Unclassified_UCG-010 | 5.61±1.41 | 6.09±1.48 | 4.96±1.12 | 0.364 |
| 未分类产粪甾醇真细菌群 Unclassified_[Eubacterium]_coprostanoligenes_group | 5.06±0.47 | 5.54±0.62 | 4.80±1.84 | 0.547 |
| 另枝菌属Alistipes | 4.35±0.37 | 4.22±0.66 | 3.92±0.35 | 0.300 |
 京公网安备 11010802041926号


