

1 材料与方法
1.1 动物试验伦理声明
1.2 试验材料
1.3 试验设计
1.4 样品采集
1.5 卵巢组织苏木精-伊红(HE)染色切片观察
1.6 卵巢组织Tunel染色切片观察
1.7 血清中氧化应激指标测定
1.8 实时荧光定量PCR(RT-qPCR)检测
表1 RT-qPCR引物序列Table 1 Primer sequences used to RT-qPCR |
| 基因 Genes | 引物序列 Primer sequences (5'—3') | 产物大小 Product size/bp |
|---|---|---|
| β-肌动蛋白β-actin | F:CCTAGGCACCAGGGTGTGAT R:GCACAGGGTGCTCCTCAG | 199 |
| 过氧化氢酶CAT | F:ATGGTCACCGGCACATGAAT R:GCCCTGGTCGGTCTTGTAAT | 104 |
| 超氧化物歧化酶1 SOD1 | F:CGGTGAACCAGTTGTGTTGTC R:GGTCTCCAACATGCCTCTCTT | 176 |
| 超氧化物歧化酶2 SOD2 | F:AGGAGAGTTGCTGGAGGCTA R:AGCGGAATAAGGCCTGTTGTT | 121 |
| 血红素氧合酶-1 HO-1 | F:GCTAGCCTGGTGCAAGATACT R:AAGCTGAGAGTGAGGACCCA | 110 |
1.9 数据统计与分析
2 结果与分析
2.1 槲皮素对高铜处理小鼠卵巢系数的影响
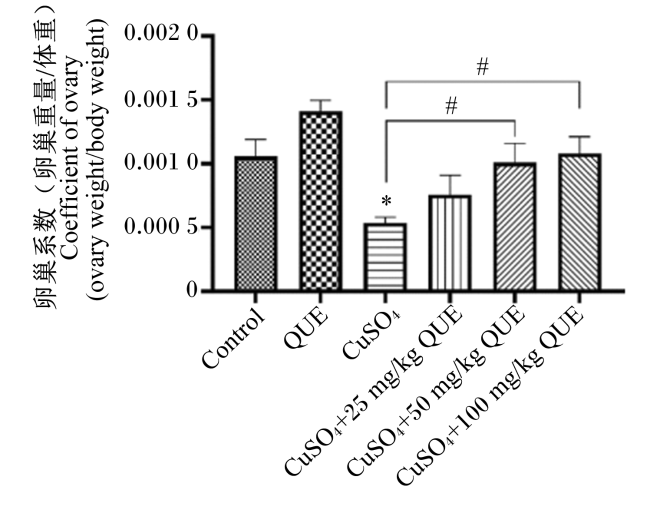
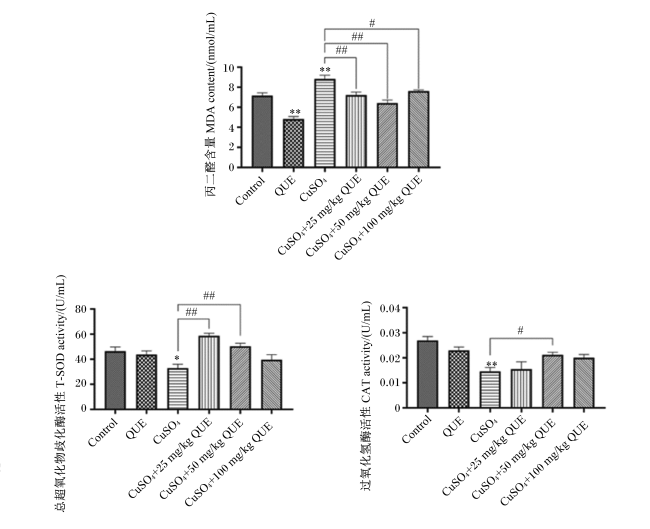
图1 小鼠卵巢系数Control:对照组;QUE:槲皮素组;CuSO4:高铜组;CuSO4+25 mg/kg QUE:槲皮素低浓度保护组;CuSO4+50 mg/kg QUE:槲皮素中浓度保护组;CuSO4+100 mg/kg QUE:槲皮素高浓度保护组。高铜组和槲皮素组数据柱标注“*”表示与对照组相比差异显著(P<0.05),标注“**”表示与对照组相比差异极显著(P<0.01);槲皮素保护组数据柱标注“#”表示与高铜组相比差异显著(P<0.05),标注“##”表示与高铜组相比差异极显著(P<0.01)。图4和图5同。 Fig.1 Ovarian coefficient of mice Control: control group; QUE: quercetin group; CuSO4: high copper group; CuSO4+25 mg/kg QUE: low concentration of quercetin protection group; CuSO4+50 mg/kg QUE: medium concentration of quercetin protection group; CuSO4+100 mg/kg QUE: high concentration of quercetin protection group. Compared with the control group, data columns of high copper group and quercetin group with “*” indicates a significant difference (P<0.05), and with “**” indicates an extremely significant difference (P<0.01); compared with the high copper group, data columns of quercetin protection groups with “#” indicates a significant difference (P<0.05), and with “##” indicates an extremely significant difference (P<0.01). The same as Fig.4 and Fig.5. |
2.2 槲皮素对高铜处理小鼠卵巢组织的影响
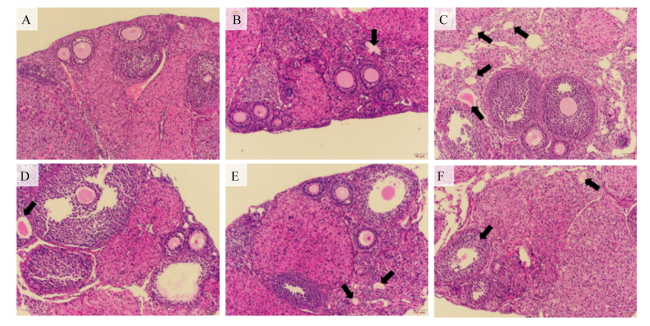
图2 小鼠卵巢的代表性组织学切片A:对照组;B:槲皮素组;C:高铜组;D:槲皮素低浓度保护组;E:槲皮素中浓度保护组;F:槲皮素高浓度保护组。黑色箭头指示的是闭锁卵泡。比例尺为50 μm。 Fig.2 Representative histological sections of mouse ovaries A: control group; B: quercetin group; C: high copper group; D: low concentration of quercetin protection group; E: medium concentration of quercetin protection group; F: high concentration of quercetin protection group. The black arrow points to an atretic follicle. The scale bar is 50 μm. |
2.3 槲皮素对高铜处理小鼠卵巢颗粒细胞凋亡的影响
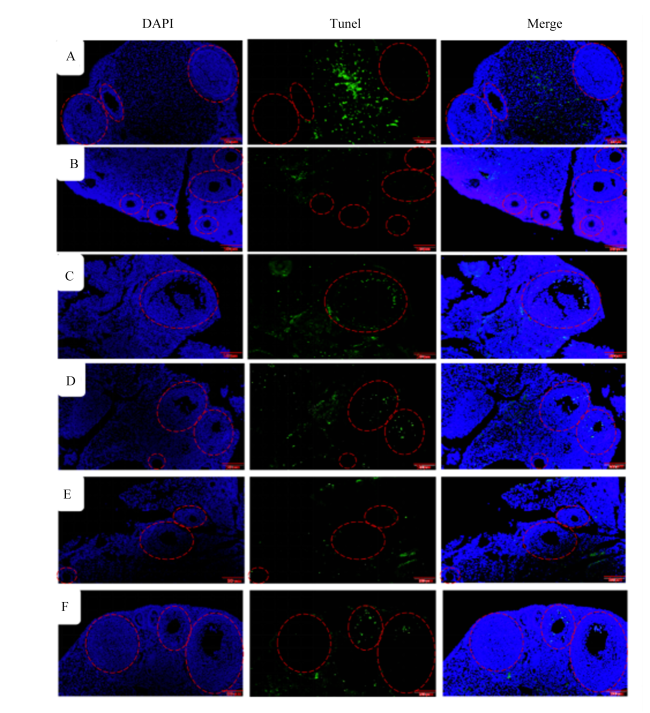
图3 小鼠卵巢Tunel染色图A:对照组;B:槲皮素组;C:高铜组;D:槲皮素低浓度保护组;E:槲皮素中浓度保护组;F:槲皮素高浓度保护组。红色虚线指示不同卵泡;绿色代表凋亡细胞,蓝色代表细胞核。比例尺为50 μm。 Fig.3 Tunel staining images of mouse ovaries A: control group; B: quercetin group; C: high copper group; D: low concentration of quercetin protection group; E: medium concentration of quercetin protection group; F: high concentration of quercetin protection group. Red dashed line indicates different follicles; green represents apoptotic cells, blue represents nucleus. The scale bar is 50 μm. |
 京公网安备 11010802041926号


