

1 材料与方法
1.1 试验材料
1.2 试验设计
表1 试验饲料组成及营养水平(干物质基础)Table 1 Composition and nutrient levels of experimental diets (DM basis) % |
| 项目 Items | 组别Groups | ||
|---|---|---|---|
| T0 | T10 | T20 | |
| 配合饲料Compound feed | 100.00 | 90.00 | 80.00 |
| 蚕豆粉Faba bean powder | 10.00 | 20.00 | |
| 合计Total | 100.00 | 100.00 | 100.00 |
| 营养水平Nutrient levels | |||
| 粗蛋白质CP | 11.36 | 12.30 | 13.60 |
| 粗脂肪EE | 3.84 | 3.80 | 3.70 |
| 粗灰分Ash | 58.04 | 57.20 | 54.40 |
营养水平均为实测值。 | |
Nutrient levels are measured values. |
1.3 测定指标及方法
1.3.1 生长性状
SGR(%/d)=[(lnWt-lnW0)/T]×100;
WGR(%)=[(Wt-W0)/W0]×100;
SYR(%)=(WW/Wt)×100;
IBR(%)=(Wi/WW)×100。
1.3.2 饲料和刺参体壁中营养成分
1.3.3 体壁组织结构
1.3.4 肠道菌群结构
1.3.4.1 菌群DNA提取
1.3.4.2 PCR扩增与高通量测序
1.4 数据分析
2 结果
2.1 蚕豆粉对刺参生长性状的影响
表2 蚕豆粉对刺参生长性状的影响Table 2 Effects of faba bean powder on growth traits of Apostichopus japonicus |
| 项目 Items | 组别Groups | ||
|---|---|---|---|
| T0 | T10 | T20 | |
| 特定生长率SGR/(%/d) | 0.54±0.01c | 0.80±0.03b | 0.88±0.03a |
| 增重率WGR/% | 37.93±1.05c | 61.59±2.10b | 69.65±1.63a |
| 出皮率SYR/% | 56.71±1.22a | 53.85±1.66b | 55.75±1.58a |
| 肠道与体壁比值IBR/% | 4.11±0.23c | 6.59±0.26b | 7.21±0.34a |
2.2 蚕豆粉对刺参体壁营养成分的影响
表3 蚕豆粉对刺参体壁营养成分的影响Table 3 Effects of faba bean powder on nutritional composition of Apostichopus japonicus body wall % |
| 项目 Items | 组别Groups | ||
|---|---|---|---|
| T0 | T10 | T20 | |
| 水分Moisture | 91.04±0.05 | 90.63±0.40 | 90.52±0.44 |
| 粗蛋白质CP | 3.67±0.08b | 4.06±0.10a | 4.08±0.04a |
| 粗脂肪EE | 0.70±0.00b | 0.80±0.00a | 0.67±0.06b |
| 粗灰分Ash | 2.47±0.21 | 2.53±0.06 | 2.50±0.20 |
| 总糖TS | 0.59±0.01b | 0.65±0.02a | 0.60±0.02b |
2.3 蚕豆粉对刺参体壁组织结构的影响
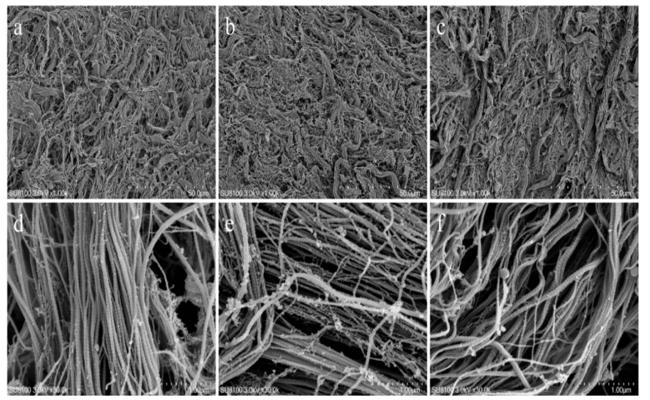
图1 各组刺参体壁扫描电镜图图a、b、c分别为T0组、T10组、T20组的放大1 000倍的扫描电镜图,图d、e、f分别为T0组、T10组、T20组的放大30 000倍的扫描电镜图。 Fig.1 SEM images of Apostichopus japonicus body wall of different groups Figures a, b and c are the 1 000× magnification scanning electron microscope (SEM) images of the T0, T10 and T20 groups, respectively, figures d, e and f are the 30 000× magnification SEM images of the T0, T10 and T20 groups, respectively. |
2.4 蚕豆粉对刺参肠道菌群结构的影响
2.4.1 蚕豆粉对刺参肠道菌群多样性的影响
表4 刺参肠道菌群高通量测序结果Table 4 High-throughput sequencing results of gut microbiota in Apostichopus japonicus |
| 项目 Items | 组别Groups | ||
|---|---|---|---|
| T0 | T10 | T20 | |
| OTU数目OTU number/个 | 280 | 351 | 102 |
| 原始序列数Original sequence number/条 | 69 786 | 99 856 | 57 619 |
| 有效序列数Effective sequence number/条 | 68 530 | 98 416 | 57 158 |
| 覆盖率Coverage/% | 98.2 | 98.6 | 99.2 |
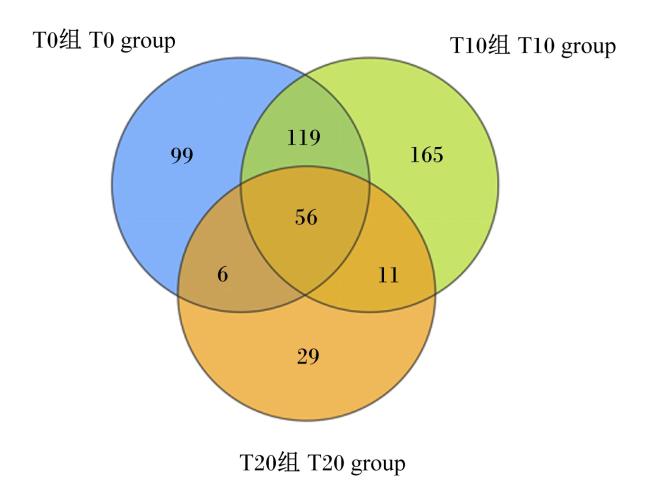
表5 刺参肠道菌群α多样性指数Table 5 α diversity indexes of gut microbiota in Apostichopus japonicus |
| 项目 Items | 组别Groups | ||
|---|---|---|---|
| T0 | T10 | T20 | |
| Shannon指数Shannon index | 3.63±0.50a | 3.78±0.33a | 1.39±0.22b |
| Simpson指数Simpson index | 0.73±0.05a | 0.84±0.12a | 0.26±0.02b |
| Chao指数Chao index | 100.00±34.07b | 212.52±49.00a | 50.67±12.59b |
| Ace指数Ace index | 200.23±34.05a | 208.63±50.81a | 51.10±12.70b |
 京公网安备 11010802041926号


