

鱼类在其生命周期中,除胚胎阶段依赖于卵黄囊或母体的滋养外,其余时期均需依赖外部环境摄取食物以维持生命活动,一旦面临食物匮乏,鱼类的存活、发育及繁衍能力将遭受不利影响[1]。饥饿对鱼类而言,是一种常见的生理应激现象,这与其所处的生态环境、季节变化、生活习性等因素息息相关。为了应对饥饿,鱼类通常会通过调整自身的生理机能,如内分泌系统的调节、代谢途径的转换以及行为模式的改变来最大限度地利用内源性能量储备,以保障生命活动的正常进行。鱼类因种类、年龄、营养状况以及食物短缺持续时间的不同,在饥饿状态下所承受的生理影响具有显著差异。鱼类对于饥饿的耐受能力主要依赖于其体内储存的能量,包括蛋白质、脂肪和糖原等的数量,以及这些能量物质分解代谢的速率[2]。白甲鱼(Onychostoma simus),属鲤形目鲤科,主要栖息于长江中上游及某些附属支流中[3]。白甲鱼味道鲜美、营养丰富,具有很高的养殖价值,是一种重要的经济鱼类。然而,由于栖息地的改变、筑坝和过度捕捞等原因,该物种的数量和分布严重减少,已成为长江流域重点保护物种之一。目前对白甲鱼的研究主要集中在生物学、胚胎发育、苗种培育、营养需求等方面[4-9]。在饥饿期间,肝脏扮演着至关重要的角色,它通过动员肝糖原和脂肪组织,维持着鱼体的全身能量平衡[10]。这一机制不仅调节着鱼类的日常活动,如运动、捕食,还关系到其逃避天敌等生存本能[11-12]。近年来,转录组和代谢组技术已经用于多种鱼类对饥饿胁迫的响应研究,如剑尾鱼(Xiphophorus helleri)[13]、大西洋鲷(Sparus aurata)[14]、黄姑鱼(Nibea albiflora)[15]和虹鳟(Oncorhynchus mykiss)[16]等,这些研究揭示了鱼类饥饿胁迫下的生理响应机制。本研究通过转录组分析筛选出白甲鱼在饥饿胁迫下的关键差异表达基因(DEGs),并借助代谢组分析深入剖析饥饿胁迫后肝脏的差异表达代谢物(DEMs)。通过整合转录组差异表达基因与差异表达代谢物的KEGG通路分析,揭示饥饿胁迫对白甲鱼幼鱼肝脏功能的影响机制,这将有助于深入理解白甲鱼种群生态适应机制,还可为优化白甲鱼投喂策略提供重要的科学参考。
1 材料与方法
1.1 试验动物与饲料
试验用白甲鱼幼鱼(12月龄)由四川省农业科学院水产研究所(四川省水产研究所)自行繁育,投喂饲料为成都通威股份有限公司生产的商品配合饲料(粗蛋白质含量≥40.0%,粗脂肪含量≥6.0%,粗纤维含量≤6.0%,粗灰分含量≤16.0%,水分含量≤12.0%)。
1.2 试验设计
动物试验经四川省农业科学院水产研究所(四川省水产研究所)动物管理与使用委员会批准(批准文号:20211010006t)。
挑选40尾大小相近、健康且充满活力的白甲鱼作为试验对象。将白甲鱼置于4个210 L的玻璃缸中,每个缸中放养10尾,暂养2周。暂养期间,采用曝气水,水温保持在(23.0±0.5) ℃,溶解氧浓度不低于7 mg/L,自然光照;每天投喂2次(09:00、16:00),定时清理缸内污物并更换新水。
暂养结束后,选取体形和重量相近的白甲鱼,随机分成对照组和试验组,每组设3个重复,每个重复6尾,试验鱼初始体重为(36.52±2.31) g,试验期间对照组正常喂养,投喂量和投喂时间与暂养期相同,而试验组连续14 d禁食。试验期间养殖容器、水温、光周期等条件与暂养期保持一致。14 d的饥饿胁迫试验结束时,对照组平均体重为(37.70±0.79) g,试验组平均体重为(32.96±1.86) g,整个试验期间无死鱼现象。
1.3 样品采集
试验结束后,从每个玻璃缸中随机挑选2尾鱼,每组共计6尾鱼,随后使用鱼用麻醉剂MS-222(A5040,Sigma)进行麻醉处理,鱼体用蒸馏水仔细冲洗3次,然后迅速放置在冰上进行解剖,获取肝脏组织,并将其迅速保存在液氮中,用于后续分子生物学分析。
1.4 检测方法
1.4.1 肝脏总RNA提取和文库构建
使用Trizol磁珠法提取白甲鱼肝脏总RNA,通过NanoDrop 2000检测RNA浓度和纯度,利用Agilent 2100生物分析仪评估核酸质量。将检测合格的样本送往上海中科新生命生物科技有限公司测序,采用Illumina TruseqTM RNA sample prep Kit方法构建文库,在Illumina NovaSeq 6000系统上进行测序,获取转录组数据。测序数据已上传至NCBI序列读取档案(SRA),登录号为PRJNA913787。
1.4.2 代谢物提取与色谱-质谱分析
肝脏样本在4 ℃环境下缓慢解冻后,取适量样本与预冷甲醇/乙腈/水溶液(甲醇∶乙腈∶水=2∶2∶1,体积比)涡旋混合,低温超声30 min,-20 ℃静置10 min,4 ℃下14 000×g离心20 min,取上清液真空干燥,质谱分析时加入100 μL乙腈/水溶液(乙腈∶水=1∶1,体积比)复溶,涡旋,4 ℃下14 000×g离心15 min,取上清液用于色谱-质谱分析。
采用Agilent 1290 Infinity LC超高效液相色谱(UHPLC)系统,配备亲水作用色谱柱(HILIC),进行样本分离;采用AB Triple TOF 6600质谱仪,在电喷雾电离(ESI)正、负离子模式下进行一级和二级谱图采集,获取代谢组数据。质控样本(QC)由样本的提取物等量混合而成,每个QC的体积及处理方式与样本相同,在分析过程中,每5~15个分析样本中插入1个QC,用来评估检测质量。
1.4.3 转录组学和代谢组学联合分析
将转录组筛选出的差异表达基因和代谢组学筛选出的差异表达代谢物集合,进行KEGG通路整合分析,识别共同参与的通路;比较转录组和代谢组关联后的通路富集情况,计算差异表达基因和差异表达代谢物在各通路的富集显著性;通过Spearman相关性网络分析,筛选处于网络中关键节点位置的差异表达基因和差异表达代谢物。
2 结果与分析
2.1 KEGG通路注释比较分析
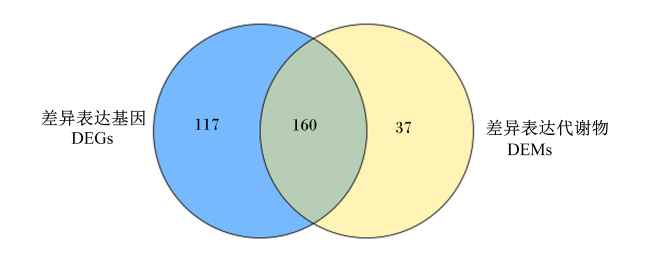
饥饿胁迫后,白甲鱼肝脏转录组中差异表达基因参与的通路有117条,代谢组中差异表达代谢物参与的通路有37条,2个组学共同参与的代谢通路有160条(图1)。
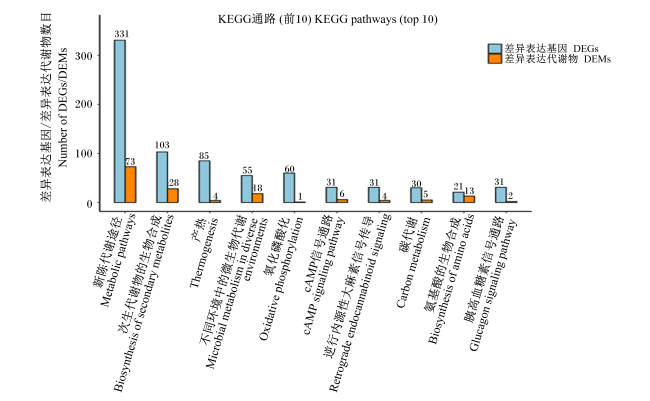
饥饿胁迫后,在白甲鱼肝脏鉴定到的差异表达基因和差异表达代谢物共同参与数排在前10的KEGG通路依次为新陈代谢途径(metabolic pathways)、次生代谢物的生物合成(biosynthesis of secondary metabolites)、产热(thermogenesis)、不同环境中的微生物代谢(microbial metabolism in diverse environments)、氧化磷酸化(oxidative phosphorylation)、环磷酸腺苷(cAMP) 信号通路(cAMP signaling pathway)、逆行内源性大麻素信号传导(retrograde endocannabinoid signaling)、碳代谢(carbon metabolism)、氨基酸的生物合成(biosynthesis of amino acids)和胰高血糖素信号通路(glucagon signaling pathway)(图2)。
2.2 KEGG通路富集比较分析
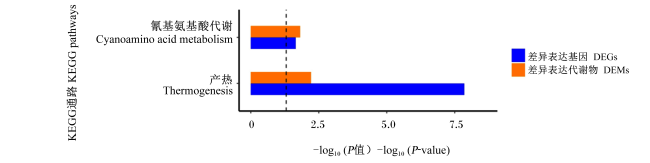
图3 差异表达基因与差异表达代谢物KEGG通路富集分析柱状图Fig.3 Bar chart of KEGG pathway enrichment analysis of DEGs and DEMs |
表1 饥饿组和对照组显著富集的KEGG通路的差异表达基因和差异表达代谢物数目Table 1 Numbers of DEGs and DEMs in KEGG pathways which were significantly enriched in control group and starvation group |
| 通路名称 Pathway names | 差异表达基因数目 DEGs number | 差异表达代谢物数目 DEMs number | 通路ID Pathway ID |
|---|---|---|---|
| 产热Thermogenesis | 85 | 4 | ko04714 |
| 氰基氨基酸代谢Cyanoamino acid metabolism | 5 | 5 | ko00460 |
2.3 转录组和代谢组相关性分析
为了直观揭示在饥饿胁迫下白甲鱼肝脏中差异表达基因与差异表达代谢物的表达模式差异,进行了基于Spearman相关性的层次聚类分析,将相关系数绝对值(|r|)≥0.5和P<0.01的差异表达基因和差异表达代谢物进行Spearman相关性网络分析。网络图中存在明显的6个差异表达基因簇和1个差异表达代谢物簇(图4),对网络图中的关键差异表达基因和关键差异表达代谢物进行功能注释或验证,进一步探索它们在白甲鱼饥饿胁迫中的作用机制。
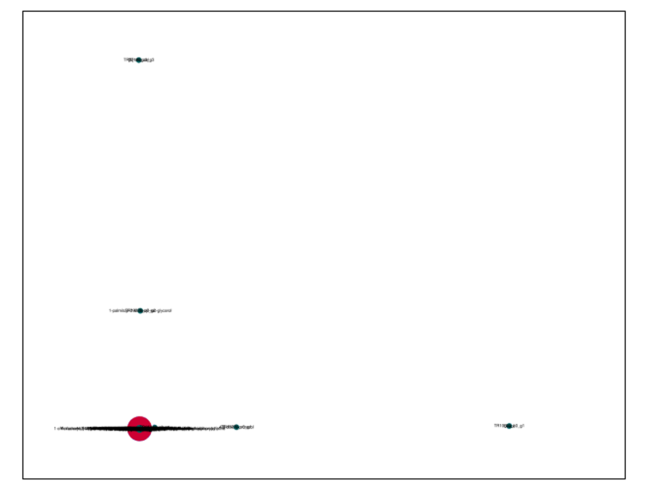
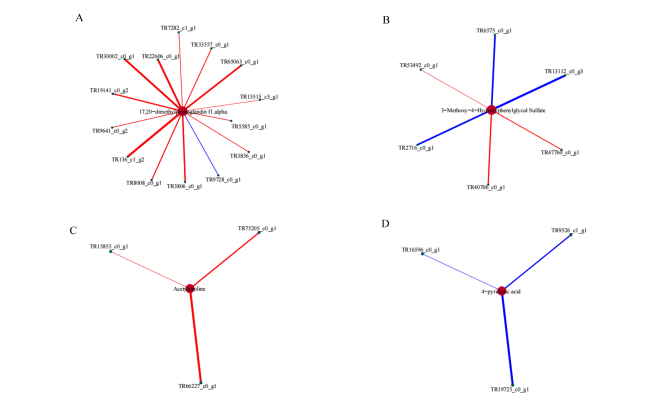
图5 关键差异表达基因与关键差异表达代谢物相关性分析的子网络图红色圆点代表关键差异表达代谢物,绿色圆点代表关键差异表达基因。红色连线代表正相关,蓝色连线代表负相关。 Fig.5 Sub-network diagram of correlation analysis of key DEGs and key DEMs Red dot represents key DEMs, whereas green dot represents key DEGs. The red line represents positive correlation, and the blue line represents negative correlation. |
3 讨论
饥饿胁迫是动物在长时间不摄入食物的情况下身体处于一种能量不足的状态。肝脏作为动物体内的关键代谢枢纽,扮演着至关重要的角色,它参与了包括脂肪代谢和糖代谢等在内的多种代谢过程[17-18]。在饥饿状态下,肝脏会调整代谢途径,以维持机体的能量平衡以适应环境的改变[13,19]。本研究中,白甲鱼肝脏的新陈代谢途径激活反映了机体在应对能量缺乏时,通过激活新的能量来源,重新编程新陈代谢[20]。饥饿胁迫后,动物体内能量物质会被优先用于维持生命活动,因此可能会出现一些次级代谢物合成增加,比如糖皮质激素的合成会增加,以提高血糖水平,保证身体有足够的能量供应[21];同时,蛋白质和氨基酸的合成也可能增加,因为它们是构成细胞和组织的基本成分,对于维持身体的结构和功能至关重要[22]。因此,本研究发现的白甲鱼肝脏中次级代谢物的生物合成途径激活可能与饥饿胁迫下机体的应激反应和适应机制有关。而白甲鱼幼鱼在饥饿胁迫时会产生热量的原因是,在饥饿应激条件下,大脑释放出内源性大麻素类物质,如花生四烯酸乙醇胺(AEA)、花生四烯酸甘油酯(2-AG),大麻素类物质作用于大麻素受体1(CNR1)后,对腺苷酸环化酶(AC)系统中的第二信使cAMP水平进行调控,通过Gs蛋白信号途径激活AC[23],增加细胞内cAMP含量,进而激活下游的蛋白激酶A(PKA),PKA激活下游转录因子如p38,通过上调产热相关基因环磷腺苷效应元件结合蛋白(CREB)、过氧化物酶体增殖物激活受体γ共激活因子-1α(PGC-1α)的表达,来提高脂肪组织的产热能力。左旋肉碱是脂肪酸从细胞质基质运输到线粒体基质过程中所必需的一种特异性载体,并有促进长链脂肪酸β-氧化的作用,脂肪酸经β-氧化作用生成乙酰辅酶A,乙酰辅酶A是三羧酸循环的重要底物,三羧酸循环是一种高效的产能方式,是生物体内最主要的能量代谢途径之一,它可以将底物乙酰辅酶A中的能量释放出来。本研究中,饥饿白甲鱼增加了肝脏中左旋肉碱和乙酰辅酶A的生物合成,同时通过AC-cAMP-PKA信号通路上调产热相关基因的表达来促进产热。
氰基氨基酸是一类含有氰基(-CN)基团的氨基酸,包括丝氨酸、天冬氨酸、酪氨酸和苯丙氨酸等。这些氨基酸在正常情况下参与蛋白质合成和其他生物化学过程,但在饥饿胁迫下它们的代谢会发生变化[16,24]。酪氨酸是非必需氨基酸和生酮生糖氨基酸,苯丙氨酸是必需氨基酸之一,在体内大部分经苯丙氨酸羟化酶催化作用氧化成酪氨酸,并与酪氨酸一起合成重要的神经递质和激素,参与机体的糖代谢和脂肪代谢。天冬氨酸属于非必需氨基酸,它是生物体内赖氨酸、苏氨酸、异亮氨酸、蛋氨酸等氨基酸及嘌呤、嘧啶碱基的合成前体。丝氨酸是一种非必需氨基酸,在脂肪和脂肪酸的新陈代谢及肌肉的生长中发挥着作用。本研究中,饥饿胁迫上调了白甲鱼幼鱼肝脏中酪氨酸、苯丙氨酸、丝氨酸和天冬氨酸的生物合成和转运,导致白甲鱼体内能量储备糖原和脂肪的消耗,为了维持生命活动,白甲鱼需要寻找其他能量来源,而此时氰基氨基酸可以通过一系列代谢途径被分解,产生能量供应。例如,丝氨酸可以被转化为丙酮酸,进而进入三羧酸循环产生能量[25];酪氨酸通过酪氨酸酶转化为4-羟基苯丙酮酸,4-羟基苯丙酮酸进一步被4-羟基苯基丙酮酸双加氧酶(HPD)分解成富马酸和乙酰乙酸[26],然后富马酸直接进入三羧酸循环参与ATP的产生,乙酰乙酸通过氧化磷酸化转化为乙酰辅酶A参与能量的产生[27]。由此可知,氰基氨基酸的代谢可以提供额外的能量来源,以满足白甲鱼在饥饿胁迫下的能量需求,维持机体正常生命活动。
17,20-二甲基前列腺素f1.α是一种类二十烷酸物质,在许多鱼类中由脑垂体前叶分泌,可以通过血液循环到达目标器官,发挥其生物学效应[28]。前列腺素可参与应激条件下下丘脑-垂体-肾上腺(HPA)轴活性的调节[29],F类前列腺素可加速脂质降解,促进线粒体β氧化和能量的产生[30]。乙酰胆碱作为一种关键的神经递质,在动物体内发挥着举足轻重的调控作用,包括调控食欲、促进生长[31],乙酰胆碱还可通过调节微小RNA(miRNA)和抗氧化酶活性起到减轻细胞氧化损伤的作用[32]。4-吡哆酸是维生素B6的主要代谢终产物,维生素B6是一种重要的水溶性维生素,也是一种重要的能量储存物质,通常在动物体内用于应对能量需求[33]。饥饿胁迫下,鱼类会优先维持基本的生命活动,减少与生长、繁殖等相关的代谢途径。维生素B6及其代谢产物参与多种代谢反应(如氨基酸代谢、糖异生等)[34],4-吡哆酸相关基因表达减少可能反映了代谢活动的整体下调,以减少能量消耗。研究发现,饥饿状态下,动物会经历一系列生理和行为的调整,以适应食物供应不足的情况[35-38]。此外,动物可能会改变其内分泌系统的工作方式,以适应新的营养状况[39],饥饿胁迫引起鱼类体内激素水平的变化,如去甲肾上腺素、皮质醇等,且这些激素之间通过复杂的相互作用共同调控机体的代谢和应激反应[40-41]。本研究发现,在饥饿胁迫下,白甲鱼的肝脏代谢产物(如17,20-二甲基前列腺素f1.α、3-甲氧基-4-羟基苯基乙二醇硫酸盐、乙酰胆碱以及4-吡哆酸)与一系列差异表达基因之间存在着正向或负向的调控关系,这些代谢物与基因表达的协同变化可能通过调节能量代谢途径,帮助白甲鱼适应饥饿状态,这种代谢物与基因的动态调控机制可能是白甲鱼应对饥饿胁迫的重要策略,有助于其在食物匮乏条件下延长生存时间。
4 结论
本研究通过整合白甲鱼幼鱼在饥饿胁迫下肝脏代谢组和转录组的联合分析结果,揭示了新陈代谢途径、次级代谢物的生物合成以及产热是差异表达基因和差异表达代谢物共同参与最多的前3条KEGG通路,进一步分析发现,差异表达基因和差异表达代谢物在产热和氰基氨基酸代谢通路中显著富集。饥饿胁迫下,白甲鱼通过激活AC-cAMP-PKA信号通路上调产热相关基因的表达,促进产热以维持能量平衡;同时,氰基氨基酸代谢的增强为机体提供了额外的能量来源,以维持机体正常生命活动。综上所述,本研究阐明了白甲鱼在饥饿胁迫下的能量代谢调控机制,可为白甲鱼养殖生产管理和投喂策略提供理论指导。
 京公网安备 11010802041926号


