

1 材料与方法
1.1 试验材料
1.2 主要试剂
1.3 细胞分离方法
1.3.1 组织块法
1.3.2 酶消化法
1.4 细胞培养方法
1.4.1 组织块法
1.4.2 酶消化法
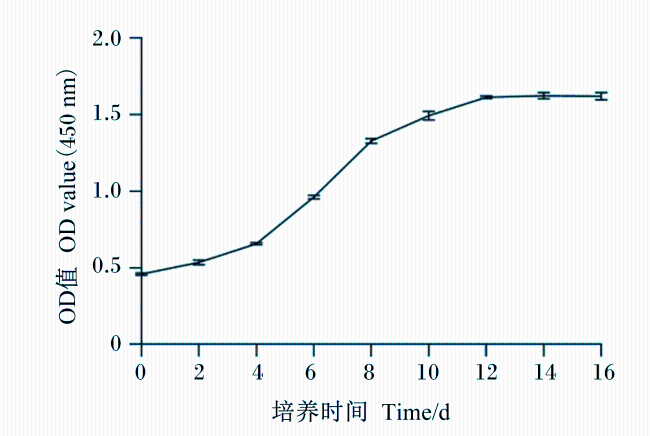
1.5 细胞生长曲线
1.6 细胞鉴定
1.6.1 碱性磷酸酶染色
1.6.2 透射电镜观察
1.6.3 序列分析
表1 引物序列Table 1 Sequences of primers |
| 基因 Genes | 正向引物序列 Forward primer sequence (5'—3') | 反向引物序列 Reverse primer sequence (5'—3') | 登录号 Accession No. |
|---|---|---|---|
| 18S rRNA | TACAGGACTCTTTCGAGGCC | CTTGCGCCGGTCCAAGAATTTC | DQ105651.1 |
| β-肌动蛋白β-actin | GATCTGGCATCACACCTTCT | CATCTTCTCCCTGTTGGCTT | AY5107102 |
| 密封蛋白Occludin | GGCTACGGTGATCGTGTTGTGT | CCGCCTCCATAACCTCCTCCAT | XM_033622283.1 |
| 闭合蛋白3 Claudin3 | GCATTGACGACGAGGCATCCAA | GCCGACCAGGAGACAGGAATGA | MK782153.1 |
| 上皮钙黏蛋白E-cadherin | CACCCTGCATTTCCCAGTGT | ATACGGCCCTCATCAACTCC | XM_033612833.1 |
1.6.4 肠道细胞标志性基因表达测定
1.7 数据统计分析
2 结果
2.1 不同原代培养方法的比较
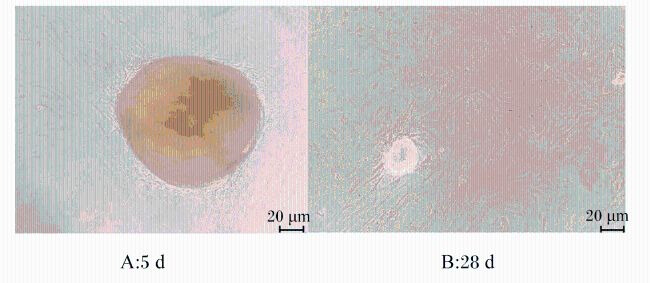
2.1.1 组织块法
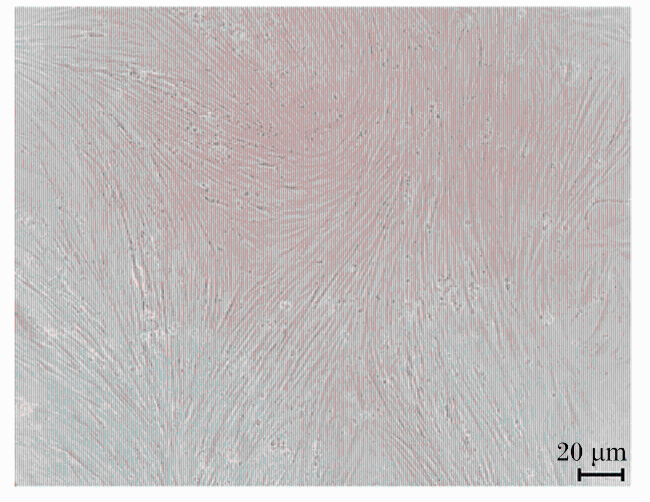
2.1.2 酶消化法
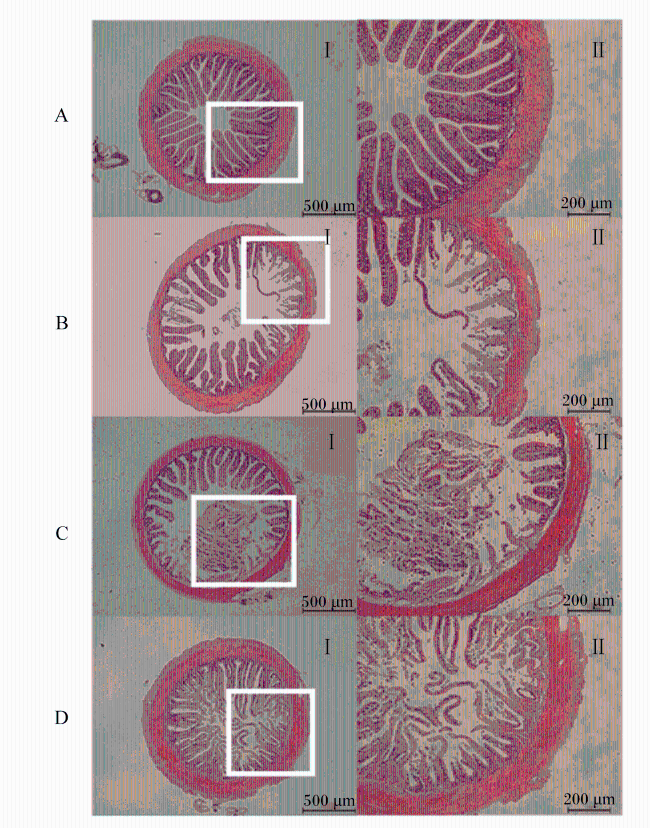
2.2 细胞消化条件筛选
表2 不同消化酶分离效果比对Table 2 Comparison of separation effects of different digestive enzymes |
| 项目 Items | 胰蛋白酶 | 胶原酶Ⅰ Collagenase Ⅰ | 胶原酶Ⅰ+胶原酶Ⅳ Collagenase Ⅰ+collagenase Ⅳ |
|---|---|---|---|
| 肠道重量Intestinal weight/g | 4.79±0.01 | 4.74±0.01 | 4.77±0.01 |
| 细胞总数Total cell count/×107个 | 2.02±0.05a | 1.54±0.03b | 1.49±0.02b |
| 活细胞数Viable cell count/×107个 | 1.78±0.02a | 1.02±0.02b | 0.96±0.05b |
| 细胞活率Cell viability/% | 88.23±0.03a | 66.20±0.02b | 64.75±0.02b |
同行数据肩标无字母或相同小写表示差异不显著(P>0.05),不同小写字母表示差异显著(P<0.05)。 | |
No letter or the same letter on the shoulder of peer data indicated no significant difference (P>0.05), while different lowercase letters indicated significant difference (P<0.05). |
2.3 细胞培养条件优化
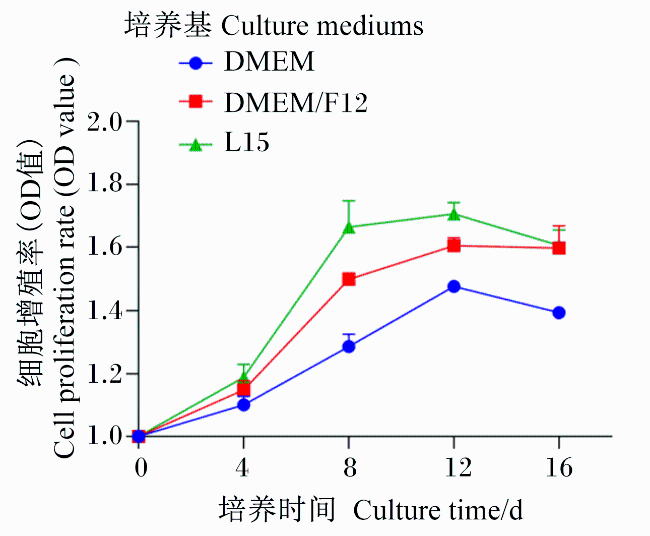
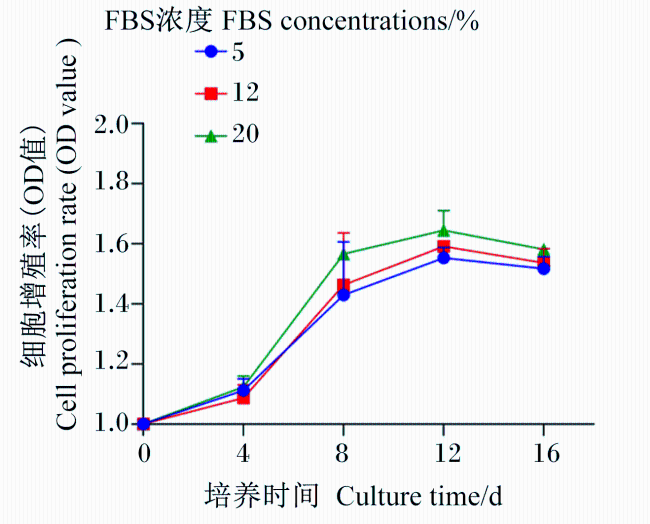
2.4 生长曲线
2.5 肠上皮细胞鉴定
2.5.1 碱性磷酸酶染色
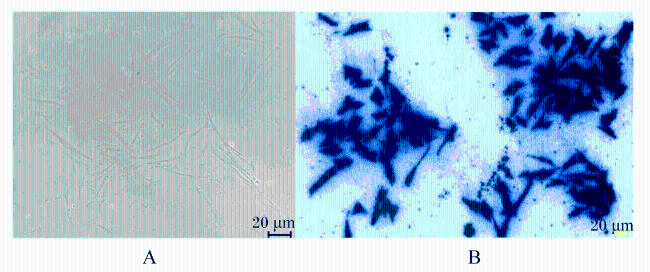
图7 肠上皮细胞碱性磷酸酶染色鉴定结果图A:肠上皮细胞碱性磷酸酶染色阴性;B:肠上皮细胞碱性磷酸酶染色阳性。 Fig.7 Identification results of alkaline phosphatase staining in intestinal epithelial cells (200×) A: negative staining for alkaline phosphatase in intestinal epithelial cells; B: positive staining for alkaline phosphatase in intestinal epithelial cells. |
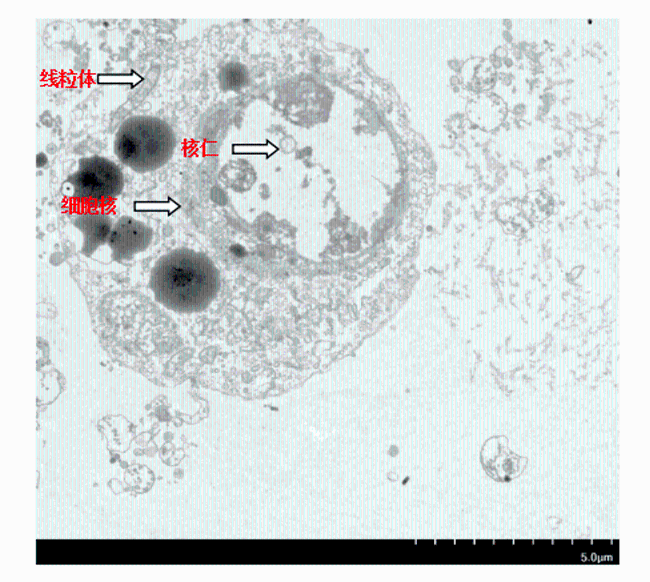
2.5.2 透射电镜观察
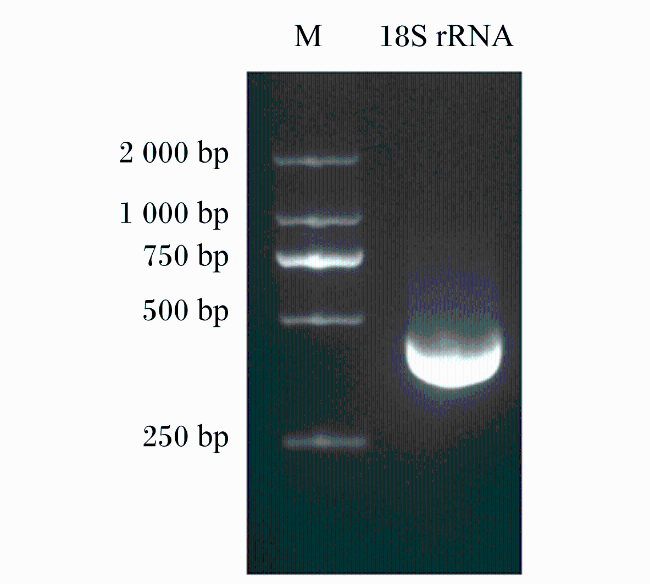
2.5.3 序列分析
2.5.4 肠道细胞标志性基因表达
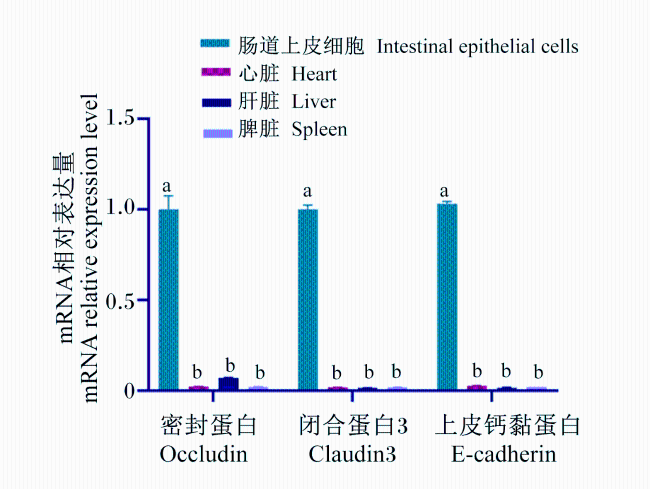
图10 斜带石斑鱼肠道上皮细胞和心脏、肝脏、脾脏中occludin、claudin3和E-cadherin基因的mRNA相对表达量 同一指标不同组织之间,数据柱标注不同字母表示差异显著(P<0.05)。 Fig.10 mRNA relative expression levels of occludin, claudin3 and E-cadherin genes in intestinal epithelial cells and heart, liver, spleen of Epinephelus coioides For the same index among different tissues, the data columns marked with different letters indicate significant difference (P<0.05). |
 京公网安备 11010802041926号


