

1 材料与方法
1.1 数据收集
1.2 数据提取
1.3 数据预处理
1.3.1 探索离群值
1.3.2 归一化处理
1.3.3 数据聚类
1.4 数据建模
1.4.1 训练DT模型
1.4.2 训练ANN模型
1.4.3 训练KNN模型
1.5 模型筛选与评估
2 结果与分析
2.1 文献筛选
表1 文献检索结果Table 1 Results of literature search |
| 数据库 Database | 检索式 Search patterns | 总数目 Total items | 2012—2022年数目 Items from 2012 to 2022 | 相关文献数目 Items of relevant literature |
|---|---|---|---|---|
Web of Science | TS=(pig) | 715 757 | 185 423 | 5 463 |
| TS=(swine) | 427 776 | 139 362 | 1 276 | |
| TS=(growth performance) | 654 814 | 406 397 | 7 242 | |
| (TS=(pig) or TS=(swine)) and TS=(growth performance) | 28 446 | 13 488 | 1 330 |
相关文献数目为2012—2022年间排除兽医学、微生物学和遗传学等不相关研究领域后剩余的文献数量。 | |
The items of relevant literature are the quantity of literature remaining after excluding irrelevant research fields such as veterinary medicine, microbiology and genetics during 2012 to 2022. |
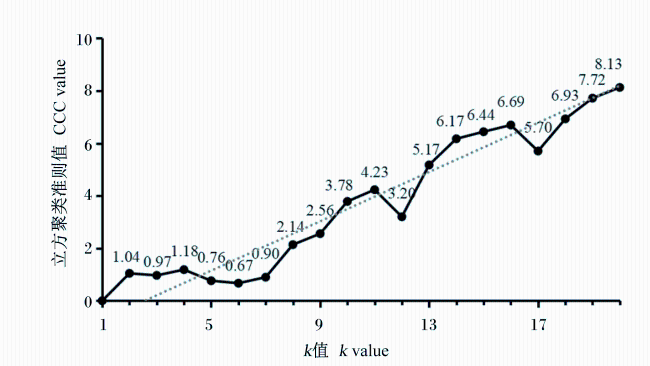
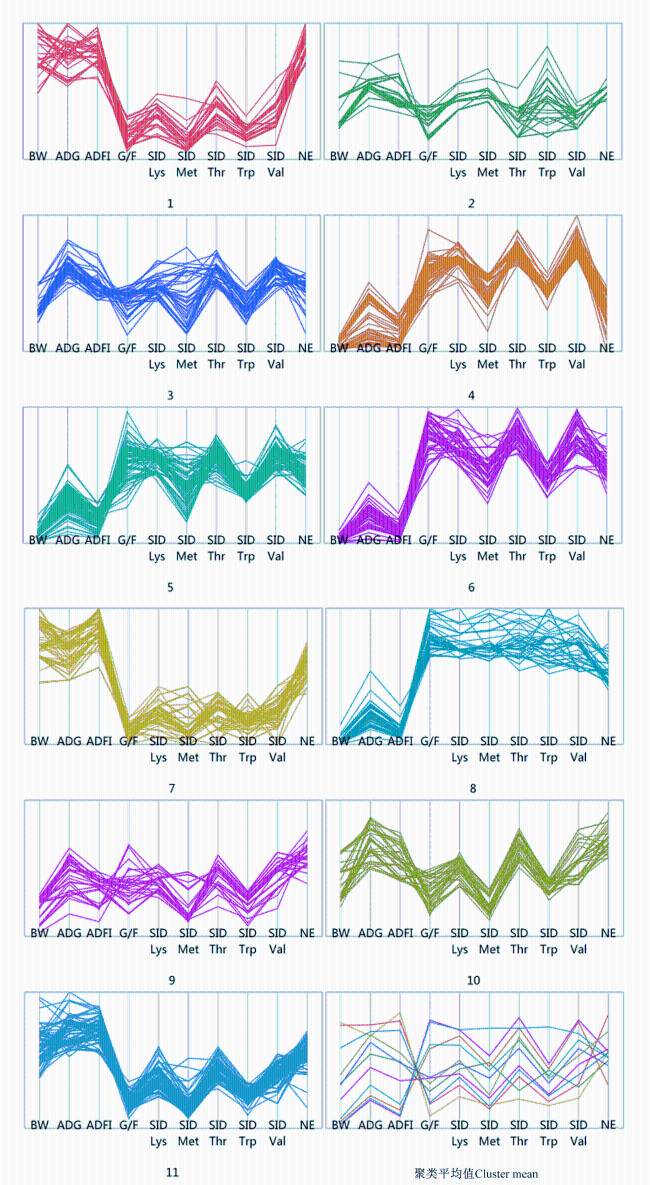
2.2 数据预处理和聚类结果
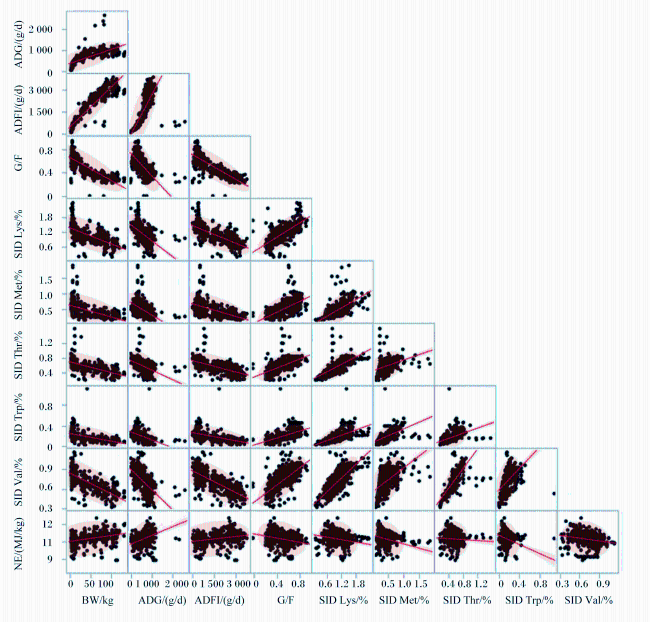
图1 原始数据集的散点图矩阵BW:体重 body weight;ADG:平均日增重 average daily gain;ADFI:平均日采食量 average daily feed intake;G/F:增重耗料比 gain to feed ratio;SID Lys:标准回肠可消化赖氨酸 standardized ileal digestible lysine;SID Met:标准回肠可消化蛋氨酸 standardized ileal digestible methionine;SID Thr:标准回肠可消化苏氨酸 standardized ileal digestible threonine;SID Trp:标准回肠可消化色氨酸 standardized ileal digestible tryptophan;SID Val:标准回肠可消化缬氨酸 standardized ileal digestible valine;NE:净能 net energy。下图同 The same as below。 图片显示了原始数据集中数据的分布情况,其中每个点均代表1条完整数据,浅红色区域为95%置信椭圆,红色部分为趋势线。The image shows the distribution of data in the original dataset, where each point represents a complete piece of data, the light red area is the 95% confidence ellipse, and the red part is the trend line. Fig.1 Scatterplot matrix of original dataset |
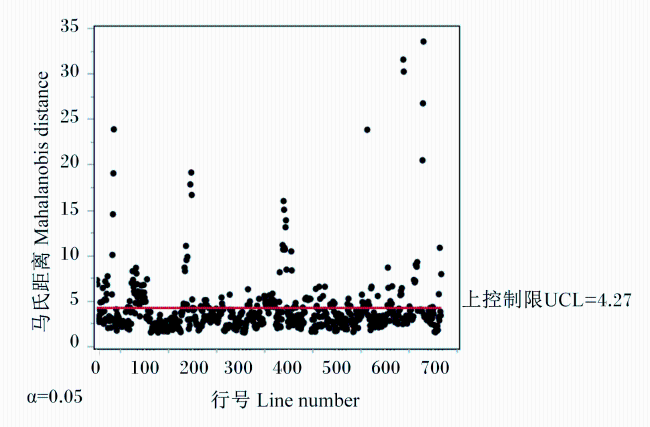
表2 数据预处理后的猪生长性能和饲粮营养水平的描述性统计结果Table 2 Descriptive statistics results of pig growth performance and dietary nutrient levels after data preprocessing |
| 项目 Items | 生长性能Growth performance | 营养水平Nutrient levels | ||||||||||
|---|---|---|---|---|---|---|---|---|---|---|---|---|
| 体重 BW/kg | 平均 日增重 ADG/(g/d) | 平均日 采食量 ADFI/(g/d) | 增重 耗料比 G/F | 标准回肠可 消化赖氨酸 SID Lys/% | 标准回肠可 消化蛋氨酸 SID Met/% | 标准回肠可 消化苏氨酸 SID Thr/% | 标准回肠可 消化色氨酸 SID Trp/% | 标准回肠 可消化缬氨酸 SID Val/% | 净能 NE/ (MJ/kg) | |||
| 训练集Training dataset | ||||||||||||
| 样本量Sample number | 393 | 393 | 393 | 393 | 393 | 393 | 393 | 393 | 393 | 393 | ||
| 最小值Min | 6.83 | 101.0 | 179.0 | 0.24 | 0.36 | 0.16 | 0.22 | 0.05 | 0.37 | 9.42 | ||
| 最大值Max | 119.30 | 1 270.0 | 3 613.0 | 0.86 | 1.86 | 0.92 | 0.87 | 0.40 | 1.02 | 12.02 | ||
| 极差Range | 112.47 | 1 169.0 | 3 434.0 | 0.62 | 1.50 | 0.76 | 0.65 | 0.35 | 0.65 | 2.61 | ||
| 均值Mean | 43.03 | 662.8 | 1 599.4 | 0.50 | 1.10 | 0.43 | 0.58 | 0.18 | 0.72 | 10.83 | ||
| 标准差SD | 33.01 | 269.7 | 991.0 | 0.16 | 0.28 | 0.16 | 0.13 | 0.06 | 0.14 | 0.38 | ||
| 验证集Validation dataset | ||||||||||||
| 样本量Sample number | 131 | 131 | 131 | 131 | 131 | 131 | 131 | 131 | 131 | 131 | ||
| 最小值Min | 7.75 | 98.0 | 164.0 | 0.23 | 0.28 | 0.16 | 0.23 | 0.08 | 0.38 | 9.81 | ||
| 最大值Max | 123.80 | 1 250.0 | 3 618.6 | 0.85 | 1.89 | 0.79 | 0.87 | 0.40 | 1.00 | 11.97 | ||
| 极差Range | 116.05 | 1 152.0 | 3 454.6 | 0.62 | 1.61 | 0.63 | 0.63 | 0.31 | 0.62 | 2.17 | ||
| 均值Mean | 46.04 | 665.4 | 1 652.7 | 0.50 | 1.09 | 0.43 | 0.58 | 0.17 | 0.71 | 10.84 | ||
| 标准差SD | 37.47 | 288.2 | 1 057.3 | 0.16 | 0.31 | 0.17 | 0.14 | 0.06 | 0.14 | 0.38 | ||
表中饲粮营养水平(干物质基础)为基于《猪营养需要量》(GB/T 39235—2020)[18]中收录的“猪常用饲料原料描述及营养价值表”内各原料营养成分含量信息,根据文献资料中提供的饲粮配方计算所得。 | |
The dietary nutrient levels (DM basis) in the table were calculated based on the nutrient composition information of each raw material in the “Table of Descriptive and Nutritional Values of Common Swine Feed Ingredients” included in Nutrient Requirements of Swine (GB/T 39235—2020)[18], combined with the dietary formulations provided in the literature. |
2.3 数据建模
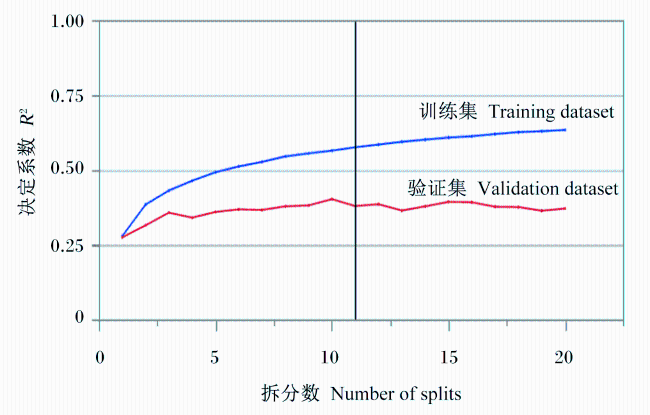
表3 不同节点数与激活函数的ANN模型分类效果Table 3 Classification performance of ANN models with different numbers of nodes and activation functions |
| 节点数 Number of nodes | 激活函数Activation functions | ||||
|---|---|---|---|---|---|
| 双曲正切函数Hyperbolic tangent function | 高斯径向基函数Gaussian radial basis function | ||||
| 误分类率MCR | 均方根误差RMSE | 误分类率MCR | 均方根误差RMSE | ||
| 1 | 0.542 | 0.677 | 0.517 | 0.675 | |
| 2 | 0.448 | 0.625 | 0.447 | 0.624 | |
| 3 | 0.450 | 0.640 | 0.417 | 0.615 | |
| 4 | 0.422 | 0.619 | 0.410* | 0.601* | |
| 5 | 0.430 | 0.610 | 0.432 | 0.596 | |
*表示数据集中表现最佳的模型的相关拟合系数数值。 | |
* indicates the value of the model correlation coefficient fit that performs best in the dataset. |
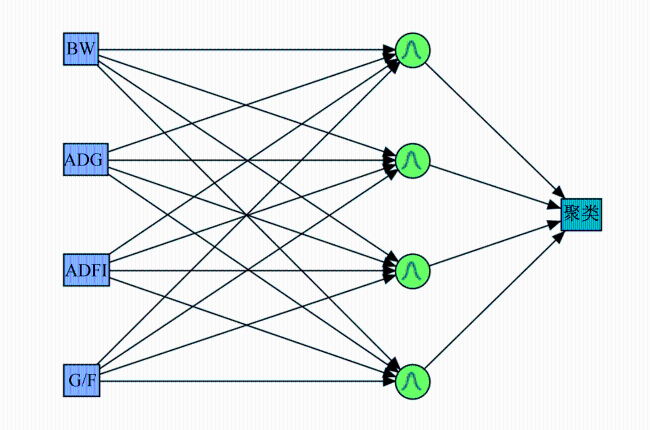
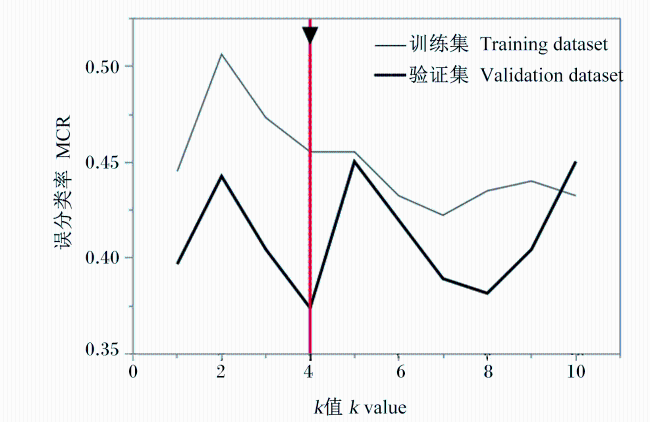
表4 3种模型分类效果的比较Table 4 Comparison of classification performance among three models |
| 项目 Items | 决策树DT | 人工神经网络ANN | k-最近邻KNN | |||||
|---|---|---|---|---|---|---|---|---|
| 训练集 Training dataset | 验证集 Validation dataset | 训练集 Training dataset | 验证集 Validation dataset | 训练集 Training dataset | 验证集 Validation dataset | |||
| 参数Parameters | 拆分数=11 | 节点数=4,高斯径向基函数 | k=4 | |||||
| 误分类率MCR | 0.412 | 0.481 | 0.410 | 0.450 | 0.455 | 0.374 | ||
表5 基于最佳分类算法模型的瘦肉型生长育肥猪营养需要量推荐值(干物质基础)Table 5 Recommended nutrient requirements for lean-type growing-finishing pigs based on the optimal classification algorithm model (DM basis) |
| 项目 Items | 体重BW/kg | ||||||||||||||||
|---|---|---|---|---|---|---|---|---|---|---|---|---|---|---|---|---|---|
| 10.4 | 12.8 | 15.1 | 31.7 | 44.7 | 53.1 | 76.1 | 96.8 | ||||||||||
| 饲粮营养需要量Dietary nutrient requirements | |||||||||||||||||
| 净能NE/(MJ/kg) | 10.82 | 10.23 | 10.76 | 10.93 | 10.65 | 11.27 | 10.86 | 11.14 | |||||||||
| 标准回肠可消化赖氨酸SID Lys/% | 1.45 | 1.38 | 1.26 | 0.93 | 1.02 | 1.09 | 0.88 | 0.71 | |||||||||
| 标准回肠可消化蛋氨酸SID Met/% | 0.64 | 0.51 | 0.48 | 0.33 | 0.48 | 0.35 | 0.28 | 0.28 | |||||||||
| 标准回肠可消化苏氨酸SID Thr/% | 0.72 | 0.70 | 0.64 | 0.52 | 0.52 | 0.66 | 0.50 | 0.40 | |||||||||
| 标准回肠可消化色氨酸SID Trp/% | 0.26 | 0.20 | 0.18 | 0.14 | 0.18 | 0.18 | 0.13 | 0.11 | |||||||||
| 标准回肠可消化缬氨酸SID Val/% | 0.85 | 0.88 | 0.79 | 0.67 | 0.67 | 0.72 | 0.62 | 0.54 | |||||||||
| 每日营养需要量Daily nutrient requirements | |||||||||||||||||
| 净能NE/(MJ/d) | 5.23 | 6.39 | 8.28 | 14.96 | 19.56 | 23.41 | 28.77 | 33.62 | |||||||||
| 标准回肠可消化赖氨酸SID Lys/(g/d) | 7.00 | 8.62 | 9.70 | 12.73 | 18.72 | 22.65 | 23.31 | 21.42 | |||||||||
| 标准回肠可消化蛋氨酸SID Met/(g/d) | 3.09 | 3.19 | 3.69 | 4.52 | 8.81 | 7.27 | 7.42 | 8.45 | |||||||||
| 标准回肠可消化苏氨酸SID Thr/(g/d) | 3.48 | 4.37 | 4.93 | 7.12 | 9.55 | 13.71 | 13.25 | 12.07 | |||||||||
| 标准回肠可消化色氨酸SID Trp/(g/d) | 1.26 | 1.25 | 1.39 | 1.92 | 3.30 | 3.74 | 3.44 | 3.32 | |||||||||
| 标准回肠可消化缬氨酸SID Val/(g/d) | 4.10 | 5.50 | 6.08 | 9.17 | 12.30 | 14.96 | 16.42 | 16.29 | |||||||||
| 满足最低营养需要量时达到的生长性能Growth performance achieved when meeting the minimum nutrient requirements | |||||||||||||||||
| 平均日增重ADG/(g/d) | 347.6 | 378.6 | 470.2 | 620.2 | 794.7 | 900.3 | 930.0 | 929.2 | |||||||||
| 平均日采食量ADFI/(g/d) | 482.8 | 624.8 | 769.7 | 1 368.6 | 1 835.6 | 2 077.8 | 2 649.0 | 3 017.0 | |||||||||
| 增重耗料比G/F | 0.73 | 0.60 | 0.62 | 0.47 | 0.44 | 0.44 | 0.35 | 0.31 | |||||||||
每日营养需要量=饲粮营养需要量×ADFI。 | |
Daily nutrient requirements=dietary nutrient requirements×ADFI. |
 京公网安备 11010802041926号


