

1 材料与方法
1.1 伦理声明
1.2 试验鱼及日常管理
1.3 生物饵料与人工配合饲料配制
1.4 试验设计
1.4.1 开口饵料试验
存活率(%)=(Nt/N0)×100;
绝对增重(mg/d)=(m1-m0)/(t2-t1);
特定生长率(%/d)=[(lnm1-lnm0)/(t2-t1)]×100。
1.4.2 转食开始时间试验
1.5 肠道样品采集
1.6 肠道组织结构分析
1.7 肠道微生物分析
1.8 数据统计分析
2 结果与分析
2.1 不同开口饵料对大口黑鲈仔鱼生长和存活的影响
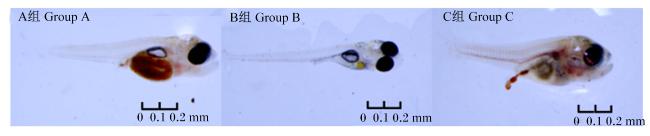
图1 试验结束时不同开口饵料投喂下大口黑鲈仔鱼的形态Fig.1 Morphology of largemouth bass larvae fed with different starter feeds at the end of experiment |
表1 不同开口饵料对大口黑鲈仔鱼生长和存活的影响Table 1 Effects of different starter feeds on growth and survival of largemouth bass larvae |
| 项目 Items | 组别Groups | ||
|---|---|---|---|
| A | B | C | |
| 初始体重Initial body weight/mg | 0.05±0.01 | 0.05±0.01 | 0.05±0.01 |
| 终末体重Final body weight/mg | 0.97±0.01b | 0.79±0.02a | 0.90±0.01b |
| 初始体长Initial body length/mm | 0.58±0.05 | 0.58±0.05 | 0.58±0.05 |
| 终末体长Final body length/mm | 11.17±0.04b | 10.20±0.02a | 10.81±0.01ab |
| 存活率SR/% | 56.43±0.31a | 67.52±0.13b | 65.77±0.18b |
| 绝对增重AG/(mg/d) | 0.09±0.01b | 0.07±0.01a | 0.09±0.01b |
| 特定生长率SGR/(%/d) | 3.00±0.01b | 2.77±0.03a | 2.90±0.01b |
2.2 不同转食开始时间对大口黑鲈仔鱼生长和存活的影响
表2 不同转食开始时间对大口黑鲈仔鱼生长和存活的影响Table 2 Effects of different starting time of weaning on growth and survival of largemouth bass larvae |
| 项目 Items | 组别Groups | |||
|---|---|---|---|---|
| All | D8 | D12 | D16 | |
| 初始体重Initial body weight/mg | 0.90±0.01 | 0.90±0.01 | 0.90±0.01 | 0.90±0.01 |
| 终末体重Final body weight/mg | 5.70±0.53a | 9.10±1.64b | 9.37±0.78b | 7.00±0.71a |
| 初始体长Initial body length/mm | 10.81±0.01 | 10.81±0.01 | 10.81±0.01 | 10.81±0.01 |
| 终末体长Final body length/mm | 35.07±2.43a | 40.52±3.69a | 42.93±2.92b | 38.73±1.87a |
| 存活率SR/% | 71.51±0.78d | 46.57±1.78a | 63.78±0.89c | 54.87±1.43b |
| 绝对增重AG/(mg/d) | 0.19±0.01a | 0.33±0.04b | 0.34±0.04b | 0.24±0.02a |
| 特定生长率SGR/(%/d) | 73.83±5.85a | 92.55±3.50c | 93.71±4.04c | 87.80±3.45b |
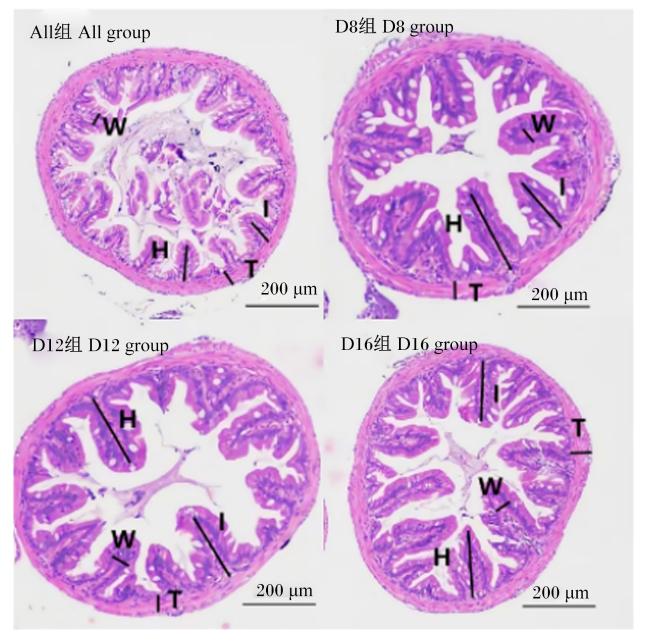
2.3 不同转食开始时间对大口黑鲈仔鱼肠道组织结构的影响
表3 不同转食开始时间对大口黑鲈肠道组织结构的影响Table 3 Effects of different starting time of weaning on intestinal tissue structure of largemouth bass larvae μm |
| 项目 Items | 组别Groups | |||
|---|---|---|---|---|
| All | D8 | D12 | D16 | |
| 绒毛高度Villus length | 124.13±32.54a | 142.84±52.07b | 181.78±34.16c | 211.74±21.97d |
| 绒毛宽度Villus width | 11.57±1.09a | 13.15±3.87a | 17.67±5.17b | 19.79±0.02b |
| 肌层厚度Muscular thickness | 19.77±1.09a | 21.78±3.35a | 24.69±1.08b | 26.74±2.92b |
2.3 不同转食开始时间对大口黑鲈仔鱼肠道微生物群落结构的影响
表4 4组大口黑鲈仔鱼肠道微生物测序结果Table 4 Intestinal microbiota sequencing results of largmouth bass larvae in four groups |
| 组别 Groups | 原始数据 Raw reads | 拼接序列 Raw tags | 去噪后序列 Clean tags | 高质量序列 Effective tags | 高质量率 Effective ratio/% |
|---|---|---|---|---|---|
| D8 | 77 687±2 776 | 64 360±2 372 | 63 504±2 339 | 59 722±1 913 | 76.93±0.37 |
| D12 | 75 097±3 396 | 62 006±2 746 | 60 979±2 698 | 55 177±2 387 | 73.52±0.55 |
| D16 | 83 202±2 337 | 67 612±1 699 | 66 678±1 684 | 61 388±1 548 | 73.82±0.43 |
| ALL | 77 746±773 | 63 262±705 | 62 161±733 | 55 633±1 086 | 71.57±1.33 |
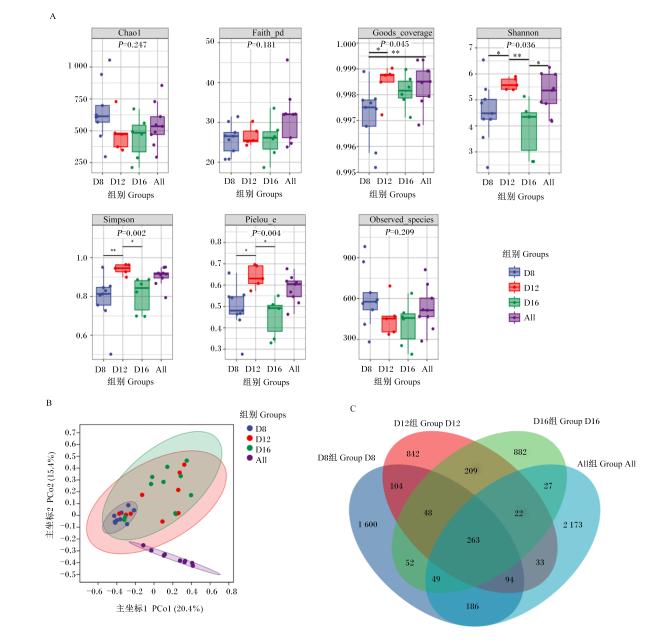
图3 肠道微生物α多样性分析、β多样性分析及OTU聚类分析图A:Chao1、Faith_pd、Goods_coverage、Shannon、Simpson、Pielou_e和Observed_species指数的分析结果,图中“*”和“* *”分别表示组间存在显著(P<0.05)和极显著差异(P<0.01);图B:不同组间微生物组分差异的主坐标分析图;图C:肠道微生物OTU韦恩图。 Fig.3 α diversity analysis, β diversity analysis and OTU cluster analysis of intestinal microbiota Figure A: analysis results of Chao1, Faith_pd, Goods_coverage, Shannon, Simpson, Pielue_e and Observed_speices indexes, and significant difference (P<0.05) and extremely significant difference (P<0.01) between groups was marked with “*” and “* *” in the figure, respectively; figure B: PCoA plot of microbial component differences between groups; figure C: Venn diagram of intestinal microbiota OTU. |
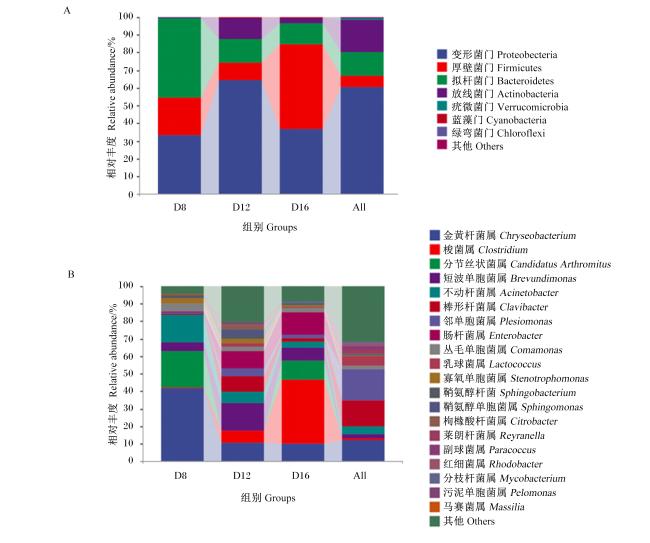
图4 肠道微生物门水平(A)和属水平(B)相对丰度柱状图Fig.4 Histograms of relative abundance of intestinal microbiota on phylum level (A) and genus level (B) |
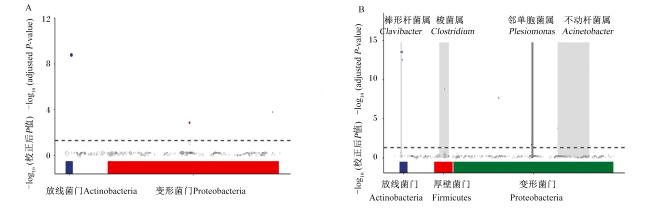
图6 MetagenomeSeq分析图A:D12组相对于D16组的显著上调菌群分布;图B:D16组相对于D12组的显著上调菌群分布。 Fig.6 MetagenomeSeq analysis Figure A: significantly upregulated intestinal microbiota in D12 group compared with D16 group; figure B: significantly upregulated intestinal microbiota in D16 group compared with D12 group. |
 京公网安备 11010802041926号


