

1 材料与方法
1.1 伦理声明
1.2 试验设计与饲养管理
表1 试验饲粮组成及营养水平(干物质基础)Table 1 Composition and nutrient levels of experimental diets (DM basis) |
| 原料 Ingredients | 组别 Groups | 营养水平 Nutrient levels2) | 组别 Groups | |||||
|---|---|---|---|---|---|---|---|---|
| LL | ML | HL | LL | ML | HL | |||
| 玉米 Corn | 34.58 | 38.99 | 40.46 | 代谢能 ME/(MJ/kg) | 12.34 | 12.51 | 12.72 | |
| 小麦 Wheat | 3.29 | 3.33 | 3.33 | 淀粉 Starch | 24.00 | 27.00 | 30.00 | |
| 麸皮 Wheat bran | 6.34 | 1.89 | 0.42 | 粗蛋白质 CP | 16.20 | 15.80 | 15.50 | |
| 菜籽粕 Rapeseed meal | 11.04 | 11.04 | 11.04 | 酸性洗涤纤维 ADF | 22.50 | 22.40 | 21.60 | |
| 豆粕 Soybean meal | 6.50 | 6.50 | 6.50 | 中性洗涤纤维 NDF | 36.90 | 37.76 | 34.51 | |
| 苜蓿干草 Alfalfa hay | 17.65 | 17.65 | 17.65 | 钙 Ca | 0.92 | 0.76 | 0.96 | |
| 小麦秸秆 Wheat straw | 17.35 | 17.35 | 17.35 | 磷 P | 0.51 | 0.46 | 0.44 | |
| 食盐 NaCl | 0.65 | 0.65 | 0.65 | |||||
| 预混料 Premix1) | 2.60 | 2.60 | 2.60 | |||||
| 合计 Total | 100.00 | 100.00 | 100.00 | |||||
1)预混料为每千克饲粮提供 The premix provided the following per kg of diets:Cu 10 mg,Fe 65 mg,Mn 30 mg,Zn 25 mg,I 0.5 mg,Se 0.1 mg,Co 0.1 mg,VA 4 000 IU,VD 500 IU,VE 40 IU。 | |
2)代谢能为计算值,其余均为实测值。ME was a calculated value, while the others were measured values. |
1.3 样品采集及指标测定
1.3.1 饲粮营养水平测定
1.3.2 生长性能测定
1.3.3 粪便样品采集
1.3.4 粪便菌群16S rDNA测序和分析
1.4 统计分析
2 结果与分析
2.1 饲粮不同淀粉水平对牦牛生长性能的影响
表2 饲粮不同淀粉水平对牦牛生长性能的影响Table 2 Effects of dietary different starch levels on growth performance of yaks |
| 项目 Items | 组别 Groups | P值 P-value | ||
|---|---|---|---|---|
| LL | ML | HL | ||
| 初重 IBW/kg | 129.63±21.48 | 130.38±13.21 | 121.38±22.15 | 0.595 |
| 末重 FBW/kg | 169.94±24.09 | 176.56±16.81 | 160.75±32.58 | 0.468 |
| 平均日增重 ADG/(kg/d) | 0.67±0.14 | 0.77±0.11 | 0.66±0.21 | 0.322 |
同行数据肩标无字母表示差异不显著(P>0.05)。 | |
In the same row, values with no letter superscripts mean no significant difference (P>0.05). |
2.2 饲粮不同淀粉水平对牦牛粪便细菌丰富度和多样性的影响
2.2.1 OTU分析
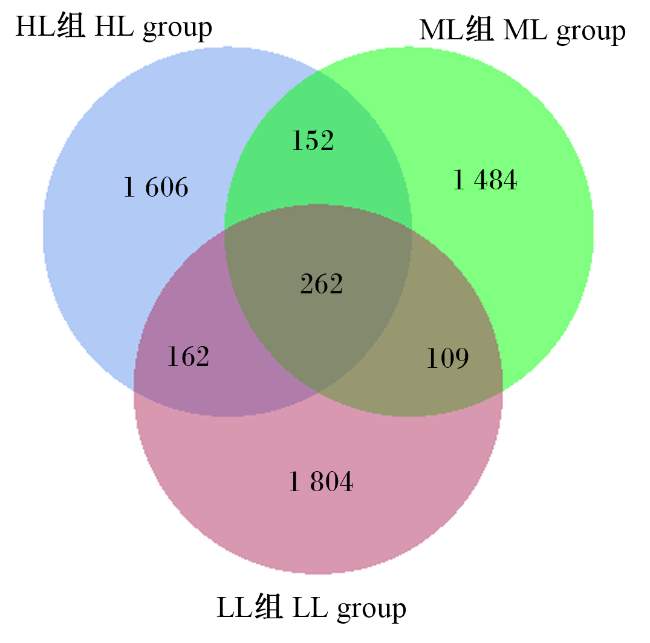
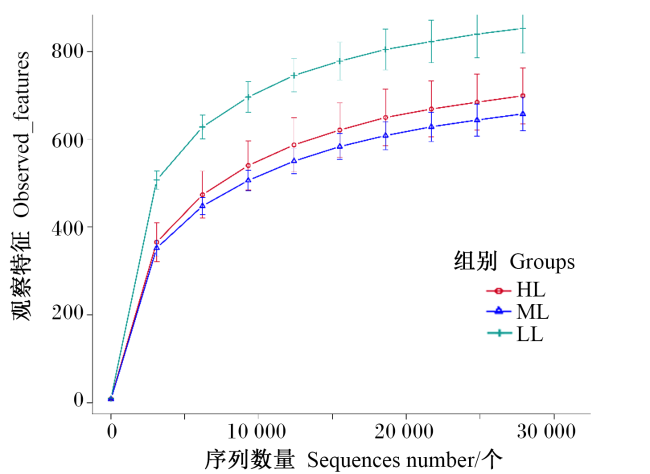
2.2.2 Alpha多样性分析
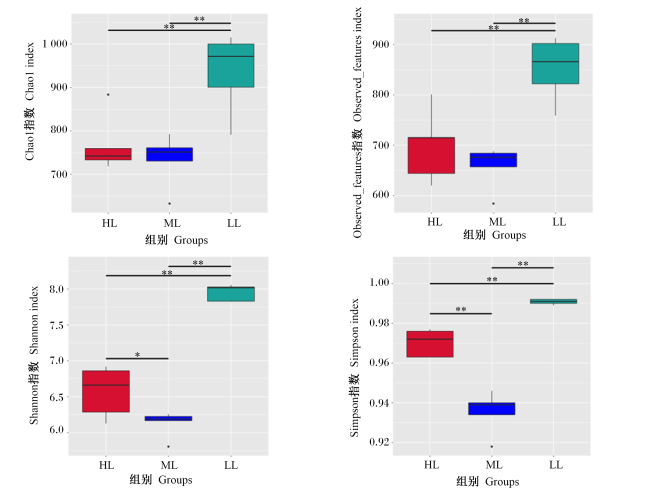
2.2.3 Beta多样性与群落结构差异
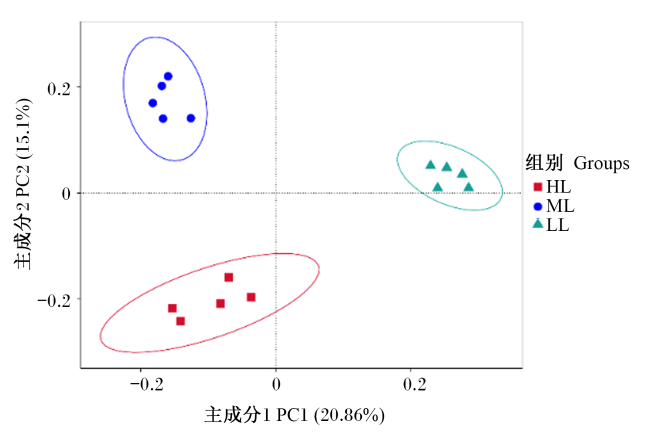
表3 Anosim组间差异分析Table 3 Anosim between-group difference analysis |
| 项目 Items | R值 R-value | P值 P-value |
|---|---|---|
| HL组vs ML组 HL group vs ML group | 1.000 | 0.007 |
| HL组vs LL组 HL group vs LL group | 1.000 | 0.008 |
| ML组vs LL组 ML group vs LL group | 1.000 | 0.008 |
2.3 不同淀粉水平对牦牛粪便细菌组成的影响
2.3.1 门水平上细菌组成
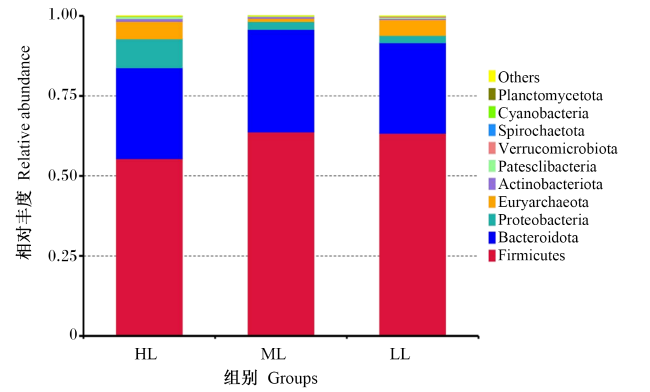
图5 牦牛粪便细菌门水平相对丰度图Others:其他;Planctomycetota:浮霉菌门;Cyanobacteria:蓝藻菌门;Spirochaetota:螺旋体门;Verrucomicrobiota:疣微菌门;Patesclibacteria:帕特斯奇菌门;Actinobacteriota:放线菌门;Euryarchaeota:广古菌门;Proteobacteria:变形菌门;Bacteroidota:拟杆菌门;Firmicutes:厚壁菌门。图6同 the same as Fig.6。 Fig.5 Relative abundance diagram of fecal bacterial at phylum level of yaks |
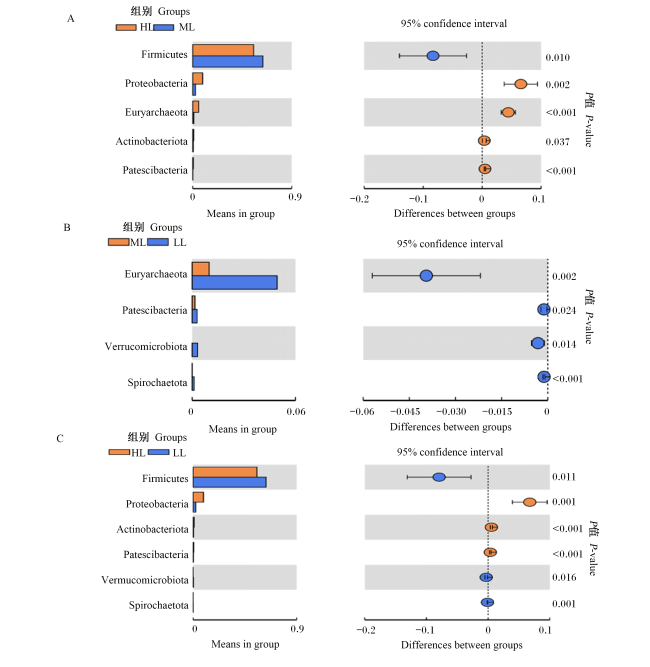
图6 牦牛粪便细菌门水平差异分析A:HL组和ML组差异分析图;B:ML组和LL组差异分析图;C:HL组和LL组差异分析图。A: differential analysis diagram between HL group and ML group; B: differential analysis diagram between ML group and LL group; C: differential analysis diagram between HL group and LL group. Means in group:组内均值;differences between groups:组间差异;95% confidence interval:95%置信区间。 Fig.6 Analysis of differences of fecal bacterial at phylum level of yaks |
2.3.2 属水平上细菌组成
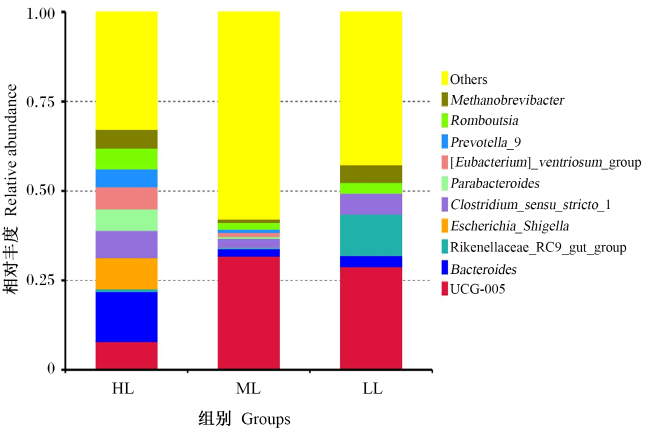
图7 牦牛粪便细菌属水平相对丰度图Others:其他;Methanobrevibacter:甲烷短杆菌属;Romboutsia:罗姆布茨菌属;Prevotella_9:普雷沃氏菌属9;[Eubacterium]_ventriosum_group:丰腹真杆菌群;Parabacteroides:副拟杆菌属;Clostridium_sensu_stricto_1:狭义梭菌属1;Escherichia_Shigella:大肠杆菌-志贺氏菌属;Rikenellaceae_RC9_gut_group:理研菌科RC9肠道群;Bacteroides:拟杆菌属。 Fig.7 Relative abundance diagram of fecal bacterial at genus level of yaks |
2.4 饲粮不同淀粉水平对牦牛粪便细菌组间差异的影响
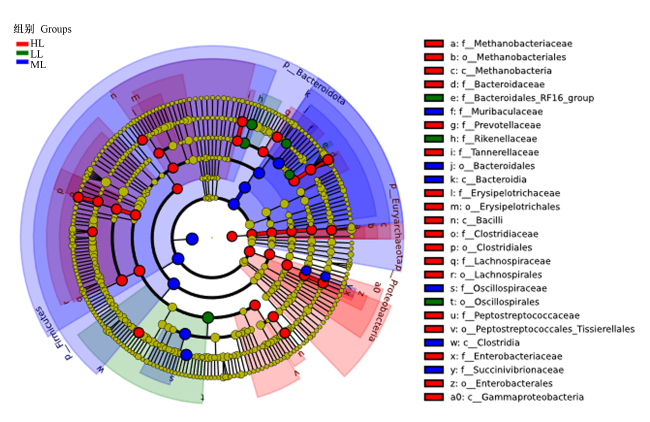
图8 LEfSe进化分支图f_Methanobacteriaceae:甲烷杆菌科;o_Methanobacteriales:甲烷杆菌目;c_Methanobacteria:甲烷杆菌纲;f_Bacteroidaceae:拟杆菌科;f_Bacteroidales_RF16_group:拟杆菌目RF16群;f_Muribaculaceae:鼠杆菌科;f_Prevotellaceae:普雷沃氏菌科;f_Rikenellaceae:理研菌科;f_Tannerellaceae:坦纳菌科;o_Bacteroidales:拟杆菌目;c_Bacteroidia:拟杆菌纲;f_Erysipelotrichaceae:丹毒丝菌科;o_Erysipelotrichales:丹毒丝菌科;c_Bacilli:芽孢杆菌纲;Erysipelotrichaceaef_Clotridiaceae:梭菌科;o_Clotridiales:梭菌目;f_Lachnospiraceae:毛螺菌科;o_Lachnospirales:毛螺菌目;f_Oscillospiraceae:颤螺菌科;o_Oscillospirales:颤螺菌目;f_Peptostreptococcaceae:肽链球菌科;o_Peptostreptococcales_Tissierellales:肽链球菌-毛螺旋菌目;c_Clotridia:梭菌纲;f_Enterobacteriaceae:肠杆菌科;f_Succinivibrionaceae:琥珀酸菌科;o_Enterobacterales:肠杆菌目;c_Gammaproteobacteria:伽马变形菌纲。图9同 the same as Fig.9。 Fig.8 LEfSe evolutionary clade diagram |
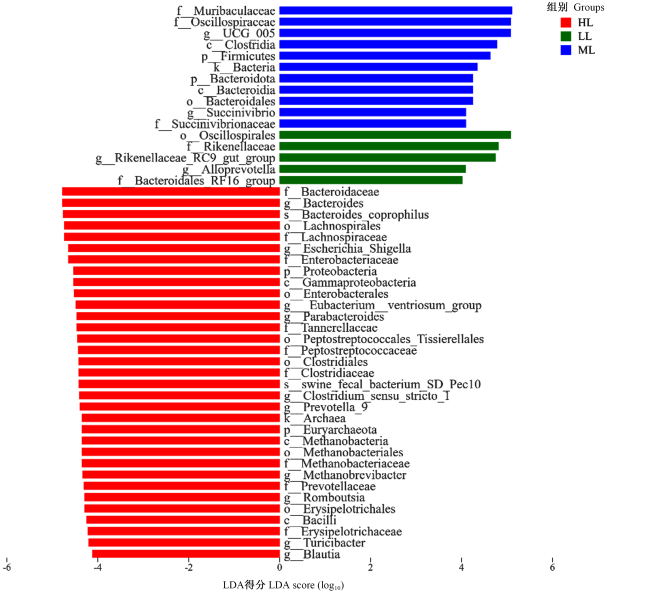
图9 LEfSe柱状图p_Firmicutes厚壁菌门;k_Bacteria:细菌;p_Bacteroidota:拟杆菌门;g_Succinivibrio琥珀酸菌属;g_Rikenellaceae_RC9_gut_group:理研菌科RC9肠道群;g_Alloprevotella:拟普雷沃菌属;g_Bacteroides:拟杆菌属;s_Bacteroides coprophilus:嗜粪拟杆菌;g_Escherichia_Shigella:大肠杆菌-志贺氏菌属;p_Proteobacteria:变形菌门;g_Eubacterium_ventriosum_group:丰腹真杆菌群;g_Parabacteroides:副拟杆菌属;s_swine_fecal_bacterium_sD_Pec10:猪粪便细菌sD Pec10;g_Clostridium_sensu_stricto_1:狭义梭菌属1;g_Prevotella_9:普雷沃氏菌属9;k_Archaea:古菌;p_Euryarchaeota:广古菌门;g_Romboutsia:罗姆布茨菌属;g_Turicibacter:苏黎世杆菌属;g_Blautia:布劳特氏菌属。 Fig.9 LEfSe histogram |
 京公网安备 11010802041926号


