研究论文

基于自动头室技术的山羊瘤胃甲烷排放监测时长效应与评估可靠性分析

  • 李慧 , 1, 2 ,
  • 冯鑫辉 3 ,
  • 张秀敏 2 ,
  • 王敏 2 ,
  • 谭支良 2 ,
  • 王荣 , 2, * ,
  • 张军霞 , 1, *
展开
  • 1 青海大学农牧学院, 西宁 810016
  • 2 中国科学院亚热带农业生态研究所, 长沙 410125
  • 3 湖南农业大学动物科学技术学院, 长沙 410128
*王 荣,副研究员,E-mail: ;
张军霞,副教授,硕士生导师,E-mail:

李 慧(2000—),女,河南商丘人,硕士研究生,从事反刍动物营养与饲料科学研究。E-mail:

Office editor: 陈燕

收稿日期: 2025-11-28

  网络出版日期: 2026-05-14

基金资助

国家重点研发计划项目(2023YFD1300900)

湖南省科技创新计划项目(2024RC3244)

Analysis on Monitoring Duration Effect and Evaluation Reliability of Rumen Methane Emissions in Goat Based on Automatic Head-Chamber Technology

  • LI Hui , 1, 2 ,
  • FENG Xinhui 3 ,
  • ZHANG Xiumin 2 ,
  • WANG Min 2 ,
  • TAN Zhiliang 2 ,
  • WANG Rong , 2, * ,
  • ZHANG Junxia , 1, *
Expand
  • 1 College of Agriculture and Animal Husbandry, Qinghai University, Xining 810016, China
  • 2 Institute of Subtropical Agriculture, Chinese Academy of Sciences, Changsha 410125, China
  • 3 College of Animal Science and Technology, Hunan Agricultural University, Changsha 410128, China
*WANG Rong, associate professor, E-mail: ;
ZHANG Junxia, associate professor, E-mail:

Received date: 2025-11-28

  Online published: 2026-05-14

摘要

本试验旨在通过自动头室(AHC)技术探究监测时长对评估山羊瘤胃甲烷排放的影响。选取15只湘东黑山羊作为试验动物,通过AHC设备对山羊瘤胃甲烷排放进行测定,设定的监测时间点分别为01:00、04:00、07:00、10:00、13:00、16:00、19:00和22:00,每次连续监测30 min。在此基础上,分别截取3、5、10、15和20 min的监测数据评估山羊瘤胃甲烷日排放量,并且对不同监测时间点和不同监测时长的甲烷排放峰形特性进行对比分析。结果表明:与其他监测时长相比,当监测时长为3 min时,山羊瘤胃甲烷日排放量与排放速率平均值和最大值以及波峰高度均显著升高(P<0.05),波峰数量显著减少(P<0.05);当监测时长≥5 min时,山羊瘤胃甲烷日排放量与排放速率平均值、最大值、最小值和中位值以及波峰高度均无显著差异(P>0.05)。相关性分析表明,山羊瘤胃甲烷日排放量与波峰高度呈显著的正相关关系(P<0.05),且该相关性不受监测时长的影响。综上所述,在监测山羊瘤胃甲烷排放时,最低监测时长应不少于5 min;甲烷排放波峰高度可作为快速预测山羊瘤胃甲烷排放量高低的潜在参考依据。

本文引用格式

李慧 , 冯鑫辉 , 张秀敏 , 王敏 , 谭支良 , 王荣 , 张军霞 . 基于自动头室技术的山羊瘤胃甲烷排放监测时长效应与评估可靠性分析[J]. 动物营养学报, 2026 , 38(5) : 3520 -3529 . DOI: 10.12418/CJAN2026.281

Abstract

This experiment aimed to investigate the effects of monitoring duration on the assessment of ruminal methane emissions in goats using automated head-chamber (AHC) technology. Fifteen Xiangdong black goats were selected as experimental animals. Ruminal methane emissions were monitored using the AHC system at eight time points (01:00, 04:00, 07:00, 10:00, 13:00, 16:00, 19:00 and 22:00), with a continuous monitoring period of 30 min per session. Based on these data, monitoring segments of 3, 5, 10, 15, and 20 min were extracted to evaluate ruminal methane daily emission quantity. The peak shape characteristics of methane emission profiles were compared across different monitoring time points and durations. The results showed as follows: compared with other monitoring durations, when the monitoring duration was 3 min, the ruminal methane daily emission quantity, mean and maximum emission rates, and peak height were significantly increased (P<0.05), while the number of peaks was significantly decreased (P<0.05). When the monitoring duration was ≥5 min, there were no significant differences in ruminal methane daily emission quantity, mean, maximum, minimum and median emission rates, or peak height (P>0.05). Correlation analysis revealed that ruminal methane daily emission quantity was significantly positively correlated with peak height (P<0.05), and this correlation was not affected by monitoring duration. In conclusion, when monitoring ruminal methane emissions in goats, the minimum monitoring duration should be no less than 5 min; peak height of methane emission can serve as a potential reference for rapidly predicting the level of ruminal methane emission in goats.

随着全球气候持续变暖,减少温室气体排放,尤其是二氧化碳和甲烷(CH4)排放,已成为国际社会共同关注的焦点[1]。研究发现,甲烷增温潜势约为二氧化碳的28倍,是仅次于二氧化碳的第二大温室气体[2]。反刍动物是全球人为甲烷排放的最大来源,约占全球人为甲烷总排放量的33%,其中瘤胃发酵产生的甲烷量占胃肠道甲烷排放总量的80%以上[3-4]。因此,准确监测反刍动物的甲烷排放对于建立可靠的温室气体排放清单和制定减排策略至关重要[5]
目前,直接测定反刍家畜甲烷排放的技术主要包括呼吸代谢室法、六氟化硫(SF6)示踪法以及GreenFeed系统[6-8]。呼吸代谢室法能够精确测定动物瘤胃和后肠道发酵产生的甲烷排放量,被认为是测定反刍动物甲烷排放量的“黄金标准”[9-10];然而,该方法存在测定效率低、造价高的问题,甚至会对试验动物的采食量造成负面影响[11-13]。SF6示踪法是一种适用于放牧、舍饲等多种方式的甲烷测定方法,因其能够实现原位测定而备受关注[14-15];但在通风不良的情况下,环境空气中的甲烷和SF6浓度会干扰甲烷排放量的计算[16],且SF6本身就是强效温室气体,其增温潜势约为二氧化碳的23 900倍,在测定过程中SF6的泄露会加剧温室效应[17]。GreenFeed系统是一种最新的甲烷测定技术,具有测量时间短和可用于大群动物等优势,但同时存在设备成本高昂、在国内应用受到限制等问题[18]
作为一种替代方案,最近国内研究团队研发了自动头室(automated head-chamber,AHC)瘤胃甲烷排放监测设备,该设备基于流量法原理对动物呼出和打嗝的气体进行连续监测分析,具有无创伤、测量时间短和可用于大群动物的优点,能够实现养殖场牛、羊甲烷的原位测定[19-21]。然而,在使用AHC设备进行检测时,选择合适的监测时长至关重要,测定的时间过长易引发动物应激,而时间过短则可能造成检测结果缺乏代表性。本试验利用AHC设备对15头山羊开展连续30 min的甲烷监测,在此基础上,分别截取3、5、10、15和20 min的监测数据,探究不同监测时长对评估甲烷排放速率变化特征、波峰日变化规律及日排放量的影响,为建立山羊瘤胃甲烷排放的精准测定方法提供理论依据。

1 材料与方法

1.1 试验动物和饲养管理

试验于2024年12月—2025年1月在浏阳市浏安农业科技综合开发有限公司进行,所有试验内容严格遵循实验动物伦理审查相关规范要求,且获得中国科学院亚热带农业生态研究所动物伦理委员会审核批准(批准编号:ISA-2024-0056)。
选取15头健康的湘东黑山羊作为试验动物,试验期间山羊按照养殖场常规饲粮饲喂,饲粮组成及营养水平见表1。所有试验山羊采用舍饲的饲养方式,每天09:00和15:00各饲喂1次,自由采食和饮水。每天清扫圈舍,保持圈舍干净。
表1 饲粮组成及营养水平(干物质基础)

Table 1 Composition and nutrient levels of the diet (DM basis)%

项目 Items 含量 Content
原料 Ingredients
精料补充料 Concentrate supplement1) 29.58
稻草 Straw 3.70
谷壳 Rice husk 3.70
大蒜皮 Garlic skin 1.24
中草药药渣 Chinese herb residue 3.34
小麦麸 Wheat bran 7.40
茶叶渣 Tea leaf residue 11.09
发酵豆渣 Fermented bean residue 39.95
合计 Total 100.00
营养水平 Nutrient levels2)
有机物 OM 91.23
粗蛋白质 CP 15.69
中性洗涤纤维 NDF 42.94
酸性洗涤纤维 ADF 29.46
总能 GE/(MJ/kg) 16.48

1)精料补充料由玉米、豆粕、麸皮、多种微量元素、多种维生素等组成,含粗蛋白质≥18.5%、粗纤维≤14.8%、粗灰分≤17.8%、赖氨酸≥0.4%、钙1.5%、氯化钠1.0%、总磷≥0.4%、水分≤13%,其营养成分标准按GB/T 18823—2010执行。Concentrate supplement was composed of corn, soybean meal, bran, various trace elements, multiple vitamins, etc. It contained CP≥18.5%, CF≤14.8%, Ash≤17.8%, Lys≥0.4%, Ca 1.5%, NaCl 1.0%, TP≥0.4% and moisture ≤13%. Its nutrient composition standards were implemented in accordance with GB/T 18823—2010.

2)营养水平均为实测值。Nutrient values were measured values.

饲粮的干物质(DM)、有机物(OM)和粗蛋白质(CP)含量参考张丽英[22]的方法进行测定;中性洗涤纤维(NDF)和酸性洗涤纤维(ADF)含量参照Van Soest等[23]的方法进行测定;总能(GE)采用等温式全自动热量仪(5E-AC8018,长沙开元仪器有限公司)进行测定。

1.2 AHC设备

AHC设备是用于精准监测反刍动物温室气体排放的智能化检测设备,主要由自动下料系统、负压装置、流量计、空气过滤系统、样品采集与测定系统、数据传输系统等组成,并且配备可拆卸的小型反刍家畜适配组件,降低呼出气体逃逸概率[20-21]。试验开始之前,先对设备进行甲烷回收率的测定,具体操作如下:将已知固定体积(300 mL)的甲烷(>99.9%)分5次等量释放在设备的料槽中,释放点位于料槽的底部和进料口的中心,用于模拟山羊在料槽采食时的瘤胃甲烷排放过程。根据AHC设备监测的甲烷排放量和注射甲烷的实际体积,计算甲烷回收率,重复3次,确保甲烷回收率在95%~105%。

1.3 试验设计

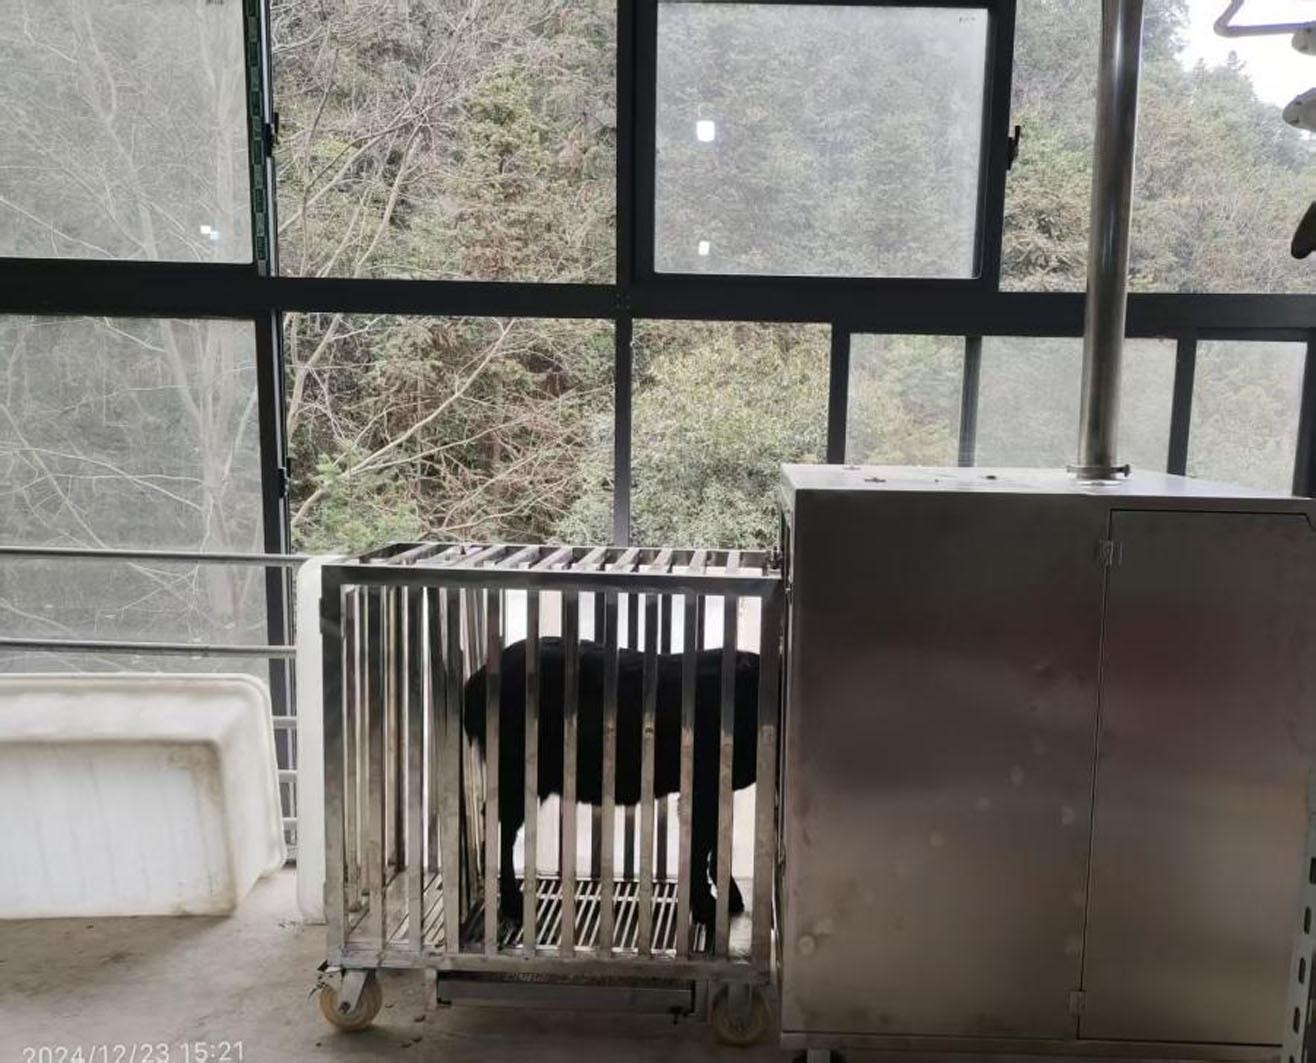
通过AHC设备对15只山羊瘤胃甲烷排放进行测定,如图1所示,设定的8个监测时间点分别为01:00、04:00、07:00、10:00、13:00、16:00、19:00和22:00,每次连续监测30 min。在此基础上,分别截取3、5、10、15和20 min的监测数据评估山羊瘤胃甲烷日排放量,并且对不同监测时间点和不同监测时长的甲烷排放峰形特性进行对比分析。预试期7 d,山羊适应AHC设备;正试期9 d,山羊随机分为3组(每组5头),依次监测各组瘤胃甲烷排放,使得每只羊均获得8个时间点的数据。8个时间点分3 d完成测定:第1天为01:00、10:00和19:00,第2天为04:00、13:00和22:00,第3天为07:00和16:00。每组山羊均按此3 d流程进行监测,每组用时3 d,3组共用9 d。每次测定时,先连续测定外界环境空气2 min,再连续测定试验山羊30 min。每次所有山羊的甲烷测定需在3 h内完成,且同一头山羊相邻2次监测时间间隔≥6 h,以避免影响其采食行为[20-21]。在测定过程中,通过代谢笼固定山羊进入AHC设备的料槽,并确保在整个监测期间内山羊始终处于AHC设备内。
图1 利用AHC设备监测山羊瘤胃甲烷排放特征

Fig.1 Monitoring the characteristics of goat rumen methane emission by AHC equipment

1.4 指标测定与计算

山羊瘤胃甲烷排放速率(Ri)计算公式如下[24]:
Ri (g/h)={Fi×(CCi-CBj)×16/(Rg×106×22.4) }。
式中:Fi是管道中气体的流量(L/h);CCi是在ti时管道出口气体中的甲烷浓度(μL/L);CBj是在tj时外界环境中的甲烷浓度(μL/L);Rg是AHC设备的甲烷回收率(%);ij是在每次测定中的样本数量;16是甲烷的摩尔质量(g/mol);106是单位换算系数;22.4是标准状况(0 ℃、101.325 kPa)下甲烷的摩尔体积(L/mol)。
在每天测定试验羊8次甲烷排放的基础上,选择不同监测时长(即3、5、10、15、20和30 min)计算试验山羊瘤胃甲烷日排放量(M24 h),计算公式如下:
M24 h (g/d)= ${\stackrel{-}{R}}_{k}$×24。
式中:k是不同监测时间点; ${\stackrel{-}{R}}_{k}$是在24 h内测定8次的甲烷排放速率的平均值(g/h)。
在对所有试验山羊开展连续30 min的监测后,分别截取3、5、10、15和20 min时长的甲烷排放波峰用于后续甲烷排放峰形特征分析。分析指标包括波峰频率、波峰时长、波峰高度和波峰数量,波峰时长是指每次气体呼出到结束所用时间(s);波峰频率是指每分钟出现的波峰数量,波峰频率(peaks/min)=60/波峰时长;波峰高度是指气体呼出时波峰的最大甲烷浓度,波峰高度(μL/L)=每次呼出的甲烷浓度最大值-外界环境中甲烷浓度[20]

1.5 数据统计与分析

数据采用SPSS 24.0软件进行统计分析,通过一般线性模型(GLM)分析监测时长对甲烷排放量的影响,以监测时长为固定影响因子(a=6;3、5、10、15、20和30 min),山羊为随机因子(b=15,1、2、3、4、5、6、7、8、9、10、11、12、13、14和15),并采用Duncan氏法进行多重比较。利用RStudio(R×64 3.5.0)软件对山羊瘤胃甲烷日排放量与甲烷峰形特征进行相关性分析,获得相关系数(R2)及其统计显著性结果。P<0.05表示差异显著,P≥0.05表示差异不显著。
回归模型如下:
Y01X1+ε。
式中:Y是山羊瘤胃甲烷日排放量;β0是截距;X1是甲烷排放峰形特征的主效应;β1是甲烷峰形特征的回归系数;ε是随机误差。

2 结果与分析

2.1 监测时长对山羊瘤胃甲烷日排放量及排放速率的影响

表2可知,与其他监测时长相比,当监测时长为3 min时,山羊瘤胃甲烷日排放量及排放速率平均值和最大值均显著升高(P<0.05);而甲烷排放速率最小值和中位值在各监测时长之间无显著差异(P>0.05);当监测时长≥5 min时,山羊瘤胃甲烷日排放量及排放速率平均值、最大值、最小值和中位值均无显著差异(P>0.05)。
表2 监测时长对山羊瘤胃甲烷日排放量及排放速率的影响

Table 2 Effects of monitoring durations on ruminal methane daily emission quantity and emission rates in goats

项目
Items
甲烷日排放量
Methane daily emission
quantity/(g/d)
甲烷排放速率 Methane emission rates/(g/h)
平均值
Mean
最大值
Maximum
最小值
Minimum
中位值
Median
监测时长 Monitoring durations/min
3 18.36a 0.77a 1.15a 0.44 0.76
5 16.56b 0.69b 0.99b 0.43 0.68
10 16.73b 0.70b 0.98b 0.44 0.70
15 16.41b 0.68b 0.94b 0.42 0.68
20 16.30b 0.68b 0.93b 0.43 0.68
30 16.42b 0.68b 0.93b 0.44 0.69
均值标准误 SEM 0.659 0.027 0.046 0.022 0.030
PP-value <0.001 <0.001 0.007 0.995 0.368

同列数据肩标无字母或相同字母表示差异不显著(P>0.05),不同小写字母表示差异显著(P<0.05)。下表同。

In the same column, values with no letter or the same letter superscripts mean no significant difference (P>0.05), while with different lowercase letter superscripts mean significant differences (P<0.05). The same as below.

2.2 监测时长对山羊不同监测时间点瘤胃甲烷排放速率的影响

表3可知,在不同监测时间点,山羊瘤胃甲烷排放速率在各监测时长之间无显著差异(P>0.05);而甲烷排放速率的最低值发生在07:00,最高值发生在19:00,到22:00时下降至晨饲前的水平。
表3 监测时长对山羊不同监测时间点瘤胃甲烷排放速率的影响

Table 3 Effects of monitoring durations on ruminal methane emission rates at different monitoring time points in goatsg/h

项目
Items
监测时间点 Monitoring time points
01:00 04:00 07:00 10:00 13:00 16:00 19:00 22:00
监测时长 Monitoring durations/min
3 0.70 0.63 0.63 0.83 0.79 0.92 0.98 0.66
5 0.59 0.57 0.56 0.71 0.75 0.83 0.89 0.64
10 0.61 0.61 0.54 0.71 0.72 0.86 0.85 0.67
15 0.62 0.59 0.53 0.70 0.72 0.83 0.86 0.64
20 0.62 0.58 0.53 0.69 0.69 0.83 0.86 0.62
30 0.62 0.57 0.54 0.70 0.70 0.84 0.86 0.63
均值标准误 SEM 0.041 0.051 0.047 0.045 0.054 0.041 0.052 0.045
PP-value 0.443 0.953 0.626 0.251 0.788 0.617 0.470 0.971

2.3 监测时长对山羊瘤胃甲烷排放峰形特征的影响

表4可知,与其他监测时长相比,当监测时长为3 min时,山羊瘤胃甲烷排放波峰高度显著升高(P<0.05),波峰数量显著减少(P<0.05);监测时长为3 min时波峰频率显著高于监测时长≥15 min时(P<0.05);而波峰时长在各监测时长之间无显著差异(P>0.05);当监测时长≥5 min时,波峰高度无显著差异(P>0.05)。
表4 监测时长对山羊瘤胃甲烷排放峰形特征的影响

Table 4 Effects of monitoring durations on peak shape characteristics of ruminal methane emission in goats

项目
Items
波峰频率
Peak frequency/
(peaks/min)
波峰时长
Peak duration/s
波峰高度
Peak height/
(μL/L)
波峰数量
Number of
peaks/个
监测时长 Monitoring durations/min
3 0.76a 90.42 29.20a 1.91f
5 0.73ab 96.00 26.34b 3.21e
10 0.71abc 96.00 26.12b 6.72d
15 0.67bc 100.33 26.07b 9.77c
20 0.66c 100.55 25.83b 12.90b
30 0.66c 100.86 26.15b 18.76a
均值标准误 SEM 0.037 5.201 1.688 0.535
监测时间点 Monitoring time points
01:00 0.72ab 91.24bc 23.50 9.12ab
04:00 0.67ab 96.82bc 24.28 8.53ab
07:00 0.58b 122.24a 23.24 7.41b
10:00 0.69ab 97.87bc 26.27 8.62ab
13:00 0.59b 115.12ab 31.77 7.42b
16:00 0.81a 80.29c 27.59 10.24a
19:00 0.78a 87.34c 31.81 9.85a
22:00 0.75ab 86.92c 23.40 9.73a
均值标准误 SEM 0.077 11.662 3.611 1.001
PP-value
监测时长 Monitoring durations <0.001 0.068 0.030 <0.001
监测时间点 Monitoring time points 0.032 0.005 0.061 0.031
监测时长×监测时间点
Monitoring durations×monitoring time points
1.000 1.000 1.000 0.260
监测时间点为07:00时波峰频率显著低于监测时间点为16:00和19:00时(P<0.05),波峰数量显著低于监测时间点为16:00、19:00和22:00时(P<0.05),波峰时长显著高于除13:00以外的其他监测时间点(P<0.05)。
监测时长和监测时间点对甲烷排放峰形特征指标均无显著的交互作用(P>0.05)。

2.4 不同监测时长下山羊瘤胃甲烷日排放量与峰形特征的相关性

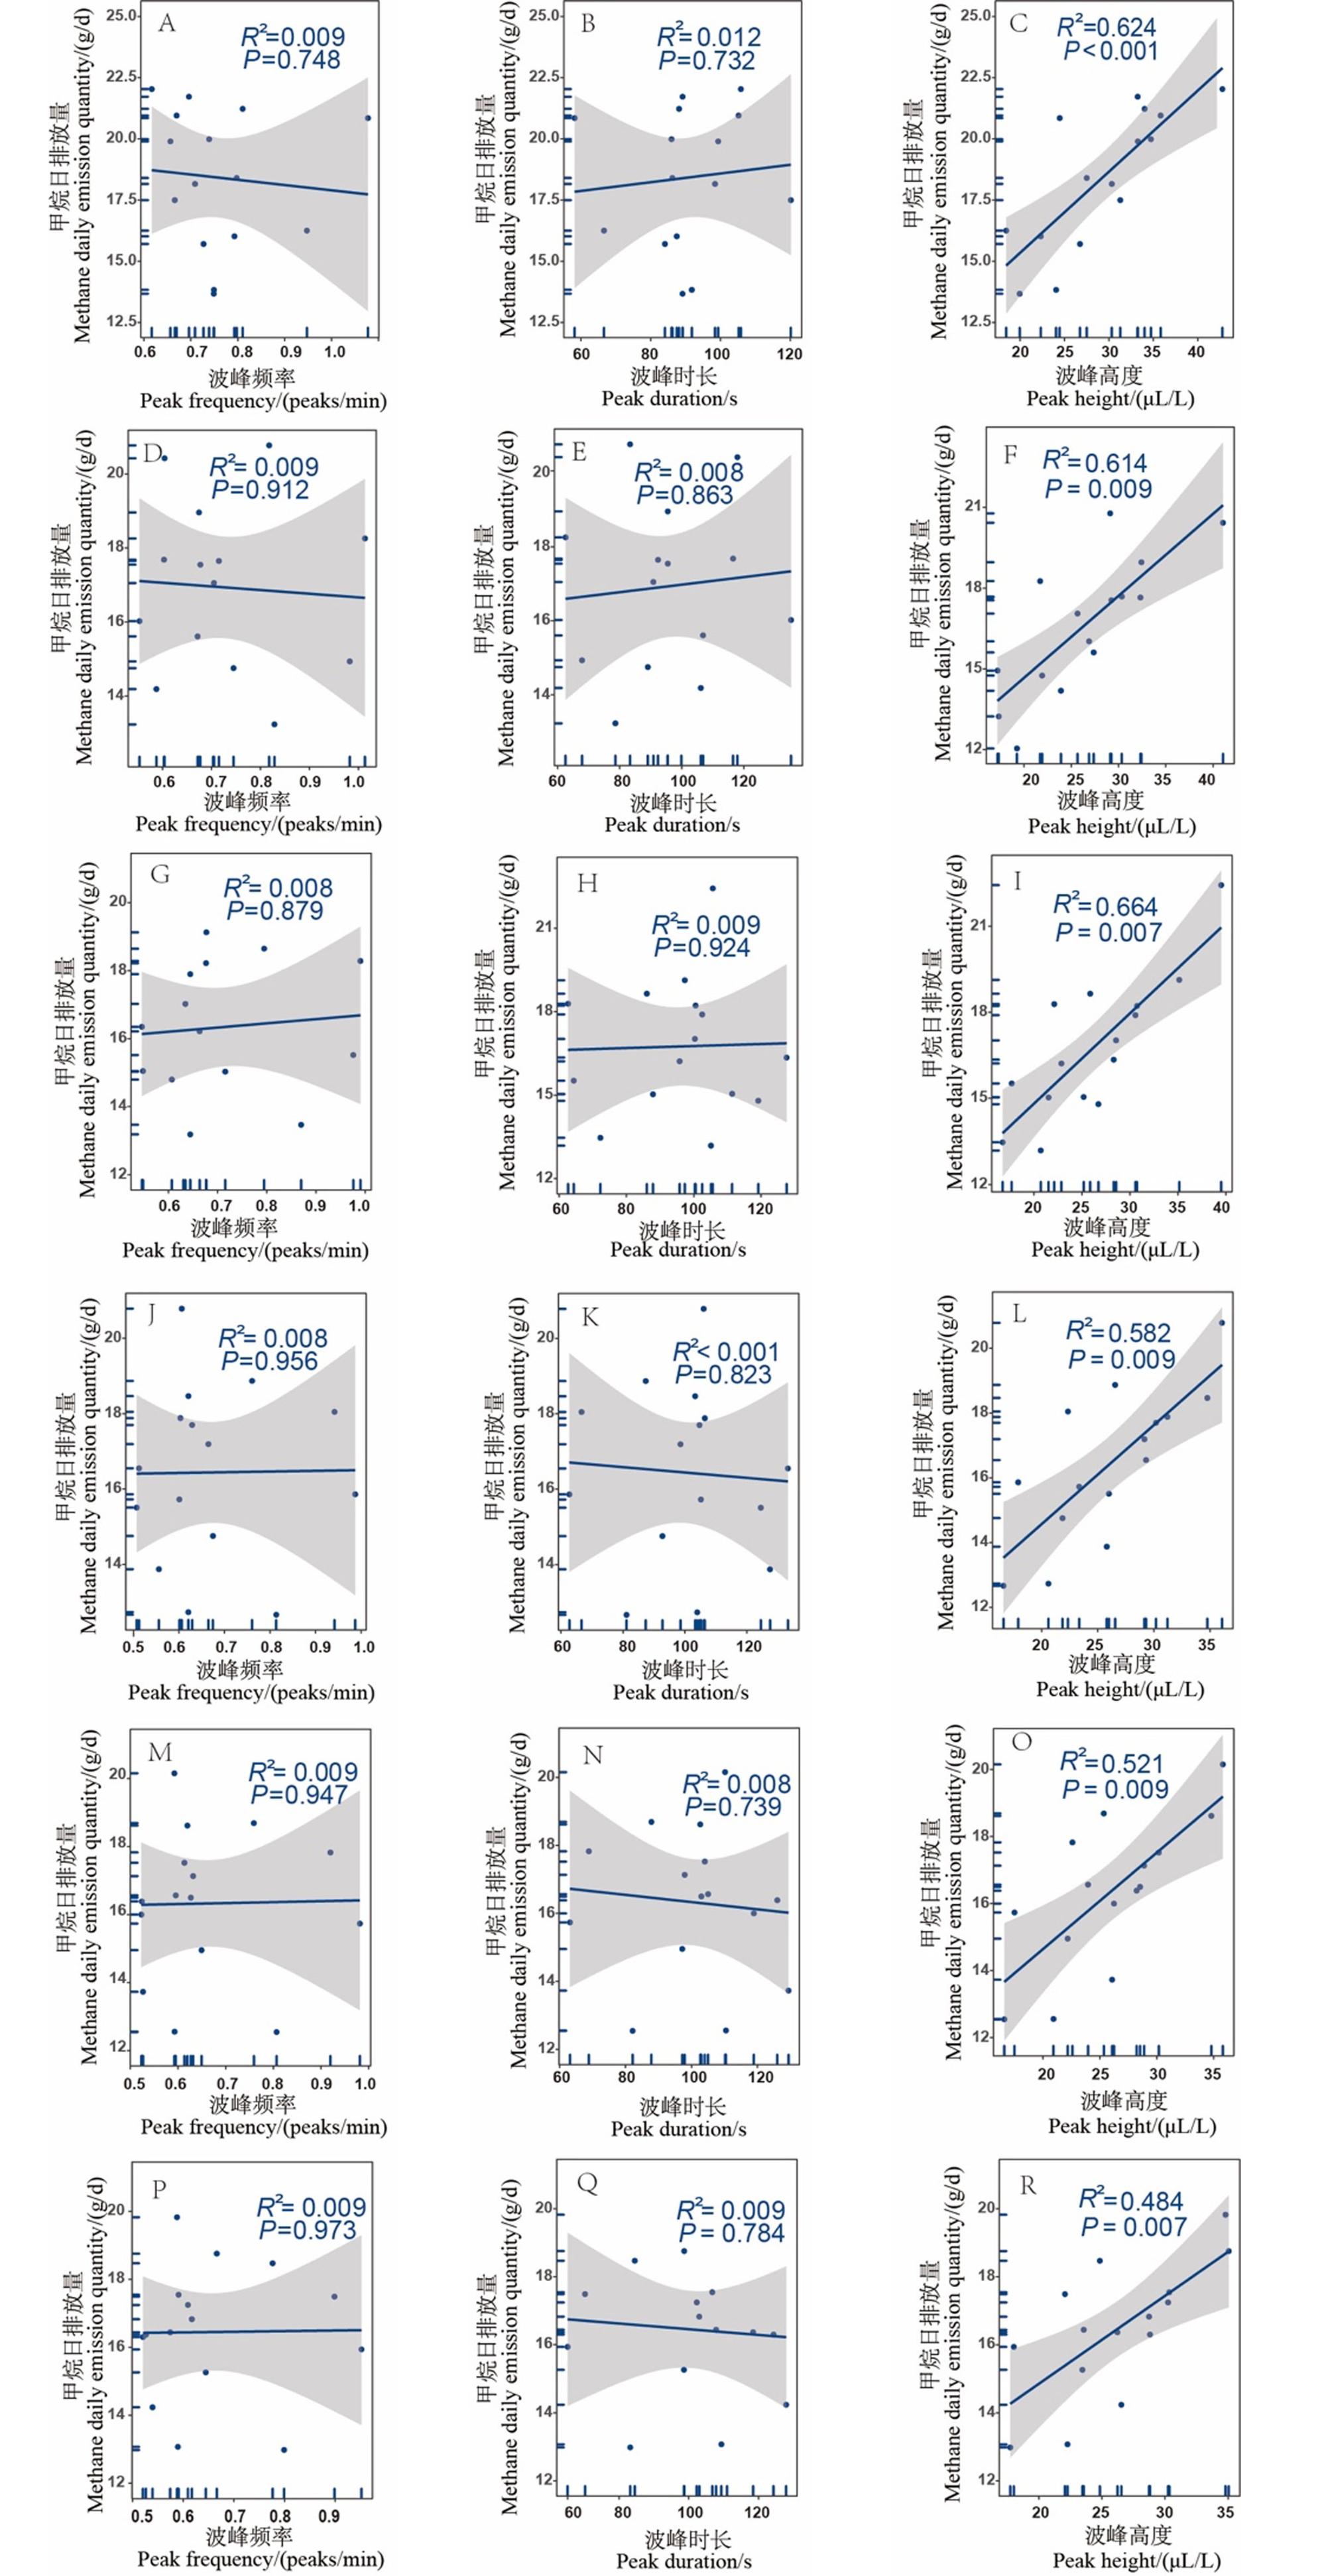
图2可知,进一步的相关性分析表明,山羊瘤胃甲烷日排放量与波峰高度呈显著的正相关关系(R2≥0.484,P<0.010),而甲烷日排放量与波峰频率(R2≤0.009,P≥0.748)和波峰时长(R2≤0.012,P≥0.732)之间均无显著的相关关系。不同监测时长情况下,甲烷日排放量与波峰特性之间的相关性没有明显变化。
图2 不同监测时长下山羊瘤胃甲烷日排放量与峰形特征的相关性

A、B、C:监测时长为3 min monitoring durations was 3 min;D、E、F:监测时长为5 min monitoring durations was 5 min;G、H、I:监测时长为10 min monitoring durations was 10 min;J、K、L:监测时长为15 min monitoring durations was 15 min;M、N、O:监测时长为20 min monitoring durations was 20 min;P、Q、R:监测时长为30 min monitoring durations was 30 min。

Fig.2 Correlation between ruminal methane daily emission quantity and peak shape characteristics in goats under different monitoring durations

3 讨论

3.1 监测时长对山羊瘤胃甲烷日排放量及排放速率的影响

反刍家畜排放的甲烷大部分是由瘤胃内产甲烷菌生成,并通过嗳气排出体外,而少量通过后肠道排出[25-26]。Sorg等[27]研究发现,测定反刍动物嗳气过程释放的甲烷通常会表现出独特的脉冲式模式,包括甲烷释放的快速上升继而迅速下降趋势。此外,饲料在瘤胃内的发酵过程具有波动性,短时间测定容易受到偶然性产气高峰的影响[28]。在本试验中,与其他监测时长相比,当监测时长为3 min时,山羊瘤胃甲烷日排放量及排放速率平均值和最大值均显著升高;当监测时长≥5 min时,山羊瘤胃甲烷日排放量及排放速率平均值、最大值、最小值和中位值均无显著差异;监测时长为3 min时的甲烷日排放量与30 min时相比差异为12%,而其他监测时长与30 min时的差异均不超过2%。Arthur等[29]基于嗅探法对肉牛进行甲烷排放测定时发现,当监测时长>3 min且监测次数达到30次,将会提高甲烷监测数据的精确度,这有助于获得可靠的甲烷排放数据。Hristov等[30]利用Greenfeed系统开展奶牛甲烷排放研究,结果表明,对试验动物连续监测5 min,既能在短时间内获得多个数据点,又能准确评估其甲烷日排放量,这与本试验结果相符。

3.2 监测时长对山羊不同监测时间点瘤胃甲烷排放速率的影响

研究发现,反刍动物甲烷排放速率并不是恒定不变的,通常会随着饲喂时间和饲喂频率的变化而波动,并在24 h的饲喂周期中形成明显的昼夜节律[31]。Fresco等[32]研究表明,甲烷排放速率在饲喂前最低,饲喂后增加至峰值,然后逐渐降低至饲喂前水平,直至下一次饲喂。最近的多项研究表明,干物质采食量是瘤胃甲烷产生的主要驱动因素[33-34]。此外,还有研究表明,瘤胃甲烷排放的峰值大多出现在饲喂后1~3 h[35-36]。在本试验结果中,甲烷排放速率的最高值和最低值分别发生在19:00和07:00,并且伴随着明显差异的峰形特征,这与前人研究结果[37]一致。

3.3 监测时长对山羊瘤胃甲烷排放峰形特征的影响

研究表明,反刍动物嗳气频率和每次嗳气释放的甲烷量与甲烷排放总量密切相关,可用于计算全天甲烷排放量[38]。在本试验结果中,监测时长显著影响瘤胃甲烷排放波峰频率、波峰高度和波峰数量,与其他监测时长相比,当监测时长为3 min时,山羊瘤胃甲烷排放波峰高度显著升高,波峰数量显著减少;监测时长为3 min时波峰频率显著高于监测时长≥15 min时;而波峰时长在各监测时长之间无显著差异;当监测时长≥5 min时,波峰高度无显著差异。Bell等[39]通过对36头奶牛的甲烷排放监测数据进行分析,结果发现波峰高度与奶牛日甲烷排放量、干物质采食量均呈正相关,且这波峰高度的重复性高达0.81,这为通过峰形特征参数估算甲烷排放量提供了关键依据。在本试验结果中,监测时长为3 min时的峰值高度与30 min时相比差异为12%,而其他监测时长与30 min时的差异均不超过1%,这说明短时间监测容易受到偶然性产气高峰的影响,从而影响甲烷排放量评估的准确性。

3.4 监测时长对甲烷日排放量与峰形特征相关性的影响

在本试验结果中,甲烷日排放量与波峰频率和波峰时长之间均无显著的相关关系。因此,山羊瘤胃甲烷日排放量的变化并未受到波峰频率和波峰时长的影响。然而,甲烷日排放量与波峰高度呈现显著的正相关关系,这与前人研究结果[20]一致。本试验还发现,在不同监测时长情况下,甲烷日排放量与波峰高度之间相关性的整体趋势均是一致的,这说明山羊瘤胃甲烷日排放量与波峰高度之间的相关性与监测时长无关。这些结果也证明了甲烷排放波峰高度可作为快速预测山羊瘤胃甲烷排放量高低的潜在参考依据。

4 结论

综上所述,在监测山羊瘤胃甲烷排放时,最低监测时长应不少于5 min;甲烷排放波峰高度可作为快速预测山羊瘤胃甲烷排放量高低的潜在参考依据。
[1]
SHAN Y L, TIAN K L, LI R Q, et al. Global methane footprints growth and drivers 1990-2023[J]. Nature Communications, 2025, 16(1):8184.

DOI

[2]
ZHAO M, TIAN X J, WANG Y L, et al. Slowdown in China’s methane emission growth[J]. National Science Review, 2024, 11(8):nwae223.

[3]
NUGRAHAENINGTYAS E, LEE J S, PARK K H. Greenhouse gas emissions from livestock:sources,estimation,and mitigation[J]. Journal of Animal Science and Technology, 2024, 66(6):1083-1098.

DOI

[4]
LIEBIG M A, GROSS J R, KRONBERG S L, et al. Grazing management contributions to net global warming potential:a long-term evaluation in the northern great plains[J]. Journal of Environmental Quality, 2010, 39(3):799-809.

DOI

[5]
ARNDT C, HRISTOV A N, PRICE W J, et al. Full adoption of the most effective strategies to mitigate methane emissions by ruminants can help meet the 1.5 ℃ target by 2030 but not 2050[J]. Proceedings of the National Academy of Sciences, 2022, 119(20):e2111294119.

[6]
ZHAO Y G, O’CONNELL N E, YAN T. Prediction of enteric methane emissions from sheep offered fresh perennial ryegrass (Lolium perenne) using data measured in indirect open-circuit respiration chambers[J]. Journal of Animal Science, 2016, 94(6):2425-2435.

DOI

[7]
MCGINN S M, BEAUCHEMIN K A, IWAASA A D, et al. Assessment of the sulfur hexafluoride (SF6) tracer technique for measuring enteric methane emissions from cattle[J]. Journal of Environmental Quality, 2006, 35(5):1686-1691.

PMID

[8]
HAMMOND K J, WAGHORN G C, HEGARTY R S. The GreenFeed system for measurement of enteric methane emission from cattle[J]. Animal Production Science, 2016, 56(3):181-189.

DOI

[9]
ZHAO Y G, NAN X M, YANG L, et al. A review of enteric methane emission measurement techniques in ruminants[J]. Animals, 2020, 10(6):1004.

DOI

[10]
JOHNSON K A, JOHNSON D E. Methane emissions from cattle[J]. Journal of Animal Science, 1995, 73(8):2483-2492.

DOI PMID

[11]
HAMMOND K J, HUMPHRIES D J, CROMPTON L A, et al. Methane emissions from cattle:estimates from short-term measurements using a GreenFeed system compared with measurements obtained using respiration chambers or sulphur hexafluoride tracer[J]. Animal Feed Science and Technology, 2015, 203:41-52.

DOI

[12]
PINARES-PATIÑO C S, LASSEY K R, MARTIN R J, et al. Assessment of the sulphur hexafluoride (SF6) tracer technique using respiration chambers for estimation of methane emissions from sheep[J]. Animal Feed Science and Technology, 2011,166-167:201-209.

[13]
HUHTANEN P, RAMIN M, HRISTOV A N. Enteric methane emission can be reliably measured by the GreenFeed monitoring unit[J]. Livestock Science, 2019, 222:31-40.

DOI

[14]
JOHNSON K, HUYLER M, WESTBERG H, et al. Measurement of methane emissions from ruminant livestock using a sulfur hexafluoride tracer technique[J]. Environmental Science & Technology, 1994, 28(2):359-362.

DOI

[15]
DEIGHTON M H, WILLIAMS S R O, HANNAH M C, et al. A modified sulphur hexafluoride tracer technique enables accurate determination of enteric methane emissions from ruminants[J]. Animal Feed Science and Technology, 2014, 197:47-63.

DOI

[16]
PINARES-PATIÑO C S, CLARK H. Reliability of the sulfur hexafluoride tracer technique for methane emission measurement from individual animals:an overview[J]. Australian Journal of Experimental Agriculture, 2008, 48(1/2):223-229.

DOI

[17]
HAMMOND K J, CROMPTON L A, BANNINK A, et al. Review of current in vivo measurement techniques for quantifying enteric methane emission from ruminants[J]. Animal Feed Science and Technology, 2016, 219:13-30.

DOI

[18]
HRISTOV A N, OH J, GIALLONGO F, et al. Short communication:comparison of the GreenFeed system with the sulfur hexafluoride tracer technique for measuring enteric methane emissions from dairy cows[J]. Journal of Dairy Science, 2016, 99(7):5461-5465.

DOI

[19]
普宣宣, 王荣, 张秀敏, 等. 豆渣混贮对青年期奶牛生长性能、营养物质表观消化率、瘤胃发酵及甲烷排放的影响[J]. 动物营养学报, 2024, 36(3):1724-1733.

DOI

PU X X, WANG R, ZHANG X M, et al. Effects of soybean residue mixed silage on growth performance,nutrient apparent digestibility,rumen fermentation and methane emission of cows[J]. Chinese Journal of Animal Nutrition, 2024, 36(3):1724-1733. (in Chinese)

[20]
WANG R, CAO Y R, ZHANG X M, et al. Relationship between daily variations of methane emissions and eructation peaks in dairy cows measured with an automated head-chamber system[J]. Animal Feed Science and Technology, 2023, 303:115714.

DOI

[21]
王荣, 王敏, 张秀敏, 等. 一种智能反刍家畜瘤胃温室气体测定系统:CN202320336714.4[P].2023-02-28.

WANG R, WANG M, ZHANG X M, et al. An intelligent greenhouse gas assay system for ruminant livestock:CN202320336714.4[P].2023-02-28. (in Chinese)

[22]
张丽英. 饲料分析及饲料质量检测技术[M]. 3版. 北京: 中国农业大学出版社, 2007:140-147.

ZHANG L Y. Feed analysis and feed quality testing technology[M]. 3rd ed. Beijing: China Agricultural University Press, 2007:140-147. (in Chinese)

[23]
VAN SOEST P J, ROBERTSON J B, LEWIS B A. Methods for dietary fiber,neutral detergent fiber,and nonstarch polysaccharides in relation to animal nutrition[J]. Journal of Dairy Science, 1991, 74(10):3583-3597.

DOI

[24]
中国科学院亚热带农业生态研究所. AHC瘤胃甲烷排放数据拟合分析软件V1.0:2025SR1666389[CP].2025-09-01.

Institute of Subtropical Agricultural Ecology,Chinese Academy of Sciences. AHC rumen methane emission data fitting analysis software V1.0:2025SR1666389[CP].2025-09-01. (in Chinese)

[25]
GLASSON C R K, KINLEY R D, DE NYS R, et al. Benefits and risks of including the bromoform containing seaweed Asparagopsis in feed for the reduction of methane production from ruminants[J]. Algal Research, 2022, 64:102673.

DOI

[26]
WANG R, WANG M, ZHANG X M, et al. Effects of rumen cannulation on dissolved gases and methanogen community in dairy cows[J]. Journal of Dairy Science, 2019, 102(3):2275-2282.

DOI PMID

[27]
SORG D, DIFFORD G F, MÜHLBACH S, et al. Comparison of a laser methane detector with the GreenFeed and two breath analysers for on-farm measurements of methane emissions from dairy cows[J]. Computers and Electronics in Agriculture, 2018, 153:285-294.

DOI

[28]
O’CONNOR S, NOONAN F, SAVAGE D, et al. Advancements in real-time monitoring of enteric methane emissions from ruminants[J]. Agriculture, 2024, 14(7):1096.

DOI

[29]
ARTHUR P F, BARCHIA I M, WEBER C, et al. Optimizing test procedures for estimating daily methane and carbon dioxide emissions in cattle using short-term breath measures[J]. Journal of Animal Science, 2017, 95(2):645-656.

DOI PMID

[30]
HRISTOV A N, OH J, GIALLONGO F, et al. The use of an automated system (GreenFeed) to monitor enteric methane and carbon dioxide emissions from ruminant animals[J/OL]. Journal of Visualized Experiments, 2015(103):52904[2025-11-28].https://pmc.ncbi.nlm.nih.gov/articles/PMC4692587/. doi:10.3791/52904.

[31]
WANG R, WANG M, UNGERFELD E M, et al. Nitrate improves ammonia incorporation into rumen microbial protein in lactating dairy cows fed a low-protein diet[J]. Journal of Dairy Science, 2018, 101(11):9789-9799.

DOI PMID

[32]
FRESCO S, BOICHARD D, FRITZ S, et al. Comparison of methane production,intensity,and yield throughout lactation in Holstein cows[J]. Journal of Dairy Science, 2023, 106(6):4147-4157.

DOI

[33]
HRISTOV A N, KEBREAB E, NIU M, et al. Symposium review:uncertainties in enteric methane inventories,measurement techniques,and prediction models[J]. Journal of Dairy Science, 2018, 101(7):6655-6674.

DOI

[34]
NIU M, HARVATINE K J. Short communication:the effects of morning compared with evening feed delivery in lactating dairy cows during the summer[J]. Journal of Dairy Science, 2018, 101(1):396-400.

DOI

[35]
WANG M, WANG R, SUN X Z, et al. A mathematical model to describe the diurnal pattern of enteric methane emissions from non-lactating dairy cows post-feeding[J]. Animal Nutrition, 2015, 1(4):329-338.

DOI PMID

[36]
WANG R, WANG M, ZHANG X M, et al. Technical note:evaluation of interval between measurements and calculation method for the quantification of enteric methane emissions measured by respiration chamber[J]. Journal of Dairy Science, 2019, 102(7):6242-6247.

DOI

[37]
DELLA ROSA M M, DURANOVICH F N, PACHECO D, et al. Forage type affects the temporal methane emission profiles in dairy cows fed fresh forages[J]. Animal Feed Science and Technology, 2023, 298:115604.

DOI

[38]
BELL M J, SAUNDERS N, WILCOX R H, et al. Methane emissions among individual dairy cows during milking quantified by eructation peaks or ratio with carbon dioxide[J]. Journal of Dairy Science, 2014, 97(10):6536-6546.

DOI

[39]
BELL M J, GARNSWORTHY P, MALLIS D, et al. Modified approach to estimating daily methane emissions of dairy cows by measuring filtered eructations during milking[J]. Landbauforschung, 2019, 69(1):47-56.

文章导航

/