

1 材料与方法
1.1 试验动物与饲粮
表1 基础饲粮组成及营养水平(干物质基础)Table 1 Composition and nutrient levels of the basal diets (DM basis) % |
| 项目 Items | 含量Content | |
|---|---|---|
| 6月龄 6 months old | 12月龄 12 months old | |
| 原料Ingredients | ||
| 玉米Corn | 20.35 | 23.72 |
| 全脂大豆Full-fat soybean | 10.42 | 8.92 |
| 菜籽粕Rapeseed meal | 3.55 | 7.20 |
| 小麦麸Wheat bran | 8.68 | 7.32 |
| 碳酸氢钠NaHCO3 | 0.42 | 0.52 |
| 食盐NaCl | 0.43 | 0.43 |
| 预混料Premix1) | 2.15 | 2.69 |
| 玉米秸秆Corn stalk | 10.00 | 19.33 |
| 全株玉米青贮Whole-corn silage | 44.00 | 29.87 |
| 合计Total | 100.00 | 100.00 |
| 营养水平Nutrient levels2) | ||
| 综合净能NEmf/(MJ/kg) | 6.20 | 6.48 |
| 粗蛋白质CP | 16.00 | 14.40 |
| 中性洗涤纤维NDF | 32.50 | 35.33 |
| 酸性洗涤纤维ADF | 19.50 | 21.22 |
| 钙Ca | 0.88 | 0.75 |
| 磷P | 0.45 | 0.48 |
1)每千克预混料含 One kilogram of the premix contained the following:VA 180 000 IU,VD 45 000 IU,VE 650 IU,Fe 1 600 mg,Cu 350 mg,Zn 1 800 mg,Mn 850 mg,I 20 mg,Co 7 mg,Se 10 mg,Ca 288 g,P 50 g,S 2.47 g。 2)综合净能参考《肉牛饲养标准》(NY/T 815—2004)计算所得,其余为实测值。NEmf was calculated in accordance with the Feeding Standard of Beef Cattle (NY/T 815—2004), while the others were measured values. |
1.2 饲粮营养物质含量测定
1.3 采样与体重、体尺信息测定
1.4 宏基因组测序
1.5 生物信息学数据分析
2 结果
2.1 杂交肉牛体重、体尺信息
表2 6和12月龄杂交肉牛体重、体尺信息Table 2 Body weight and body measurements information of crossbred beef cattle at 6 and 12 months of age (n=8) |
| 项目Items | 6月龄6 months old | 12月龄12 months old |
|---|---|---|
| 体重BW/kg | 150.12±20.04 | 412.75±42.11 |
| 体高BH/cm | 95.63±4.41 | 117.31±2.46 |
| 十字部高CSH/cm | 100.50±4.54 | 126.00±6.12 |
| 体斜长BSL/cm | 101.25±4.71 | 154.75±11.74 |
| 胸围BM/cm | 119.75±6.27 | 179.50±6.26 |
| 腹围AC/cm | 145.63±5.97 | 193.25±6.71 |
| 管围TC/cm | 14.28±0.65 | 19.81±0.92 |
2.2 宏基因组测序结果分析
表3 样品测序及组装结果Table 3 Sample sequencing and assembly results |
| 样本名 Sample names | 原始序列数 Raw reads | 清洁序列数 Clean reads | GC含量 GC content/% | Q20值 Q20 value/% | Q30值 Q30 value/% | 重叠群数 Number of contigs | N50长度 N50 length bp |
|---|---|---|---|---|---|---|---|
| 6-1 | 80 235 320 | 78 454 648 | 48.27 | 98.29 | 93.66 | 1 119 788 | 916 |
| 6-2 | 83 024 362 | 80 890 552 | 46.09 | 98.20 | 93.37 | 1 100 547 | 922 |
| 6-3 | 83 025 728 | 81 007 182 | 45.56 | 98.23 | 93.46 | 1 201 869 | 947 |
| 6-4 | 79 059 466 | 77 249 118 | 42.56 | 98.10 | 93.01 | 1 377 041 | 872 |
| 6-5 | 79 398 558 | 74 581 268 | 47.61 | 96.25 | 91.37 | 655 268 | 1 181 |
| 6-6 | 81 183 962 | 76 997 862 | 43.37 | 96.45 | 91.79 | 1 321 731 | 802 |
| 6-7 | 79 076 254 | 75 443 888 | 38.28 | 96.66 | 92.25 | 1 521 389 | 754 |
| 6-8 | 80 722 388 | 76 950 086 | 45.69 | 96.67 | 92.24 | 1 034 241 | 857 |
| 12-1 | 80 182 434 | 78 568 806 | 41.69 | 98.25 | 93.58 | 1 059 217 | 969 |
| 12-2 | 79 329 006 | 77 493 792 | 44.08 | 98.25 | 93.56 | 1 650 077 | 750 |
| 12-3 | 78 490 078 | 75 286 600 | 42.40 | 96.85 | 92.53 | 1 181 061 | 807 |
| 12-4 | 77 459 116 | 75 931 960 | 37.37 | 98.16 | 93.35 | 1 485 863 | 754 |
| 12-5 | 77 217 352 | 75 370 658 | 44.95 | 98.15 | 93.20 | 1 314 099 | 794 |
| 12-6 | 77 585 722 | 75 906 276 | 44.50 | 98.16 | 93.20 | 1 571 732 | 749 |
| 12-7 | 81 473 298 | 79 603 768 | 33.49 | 98.14 | 93.42 | 832 073 | 871 |
| 12-8 | 79 026 196 | 77 210 776 | 42.27 | 98.20 | 93.42 | 1 580 951 | 736 |
| 合计Total | 1 276 489 240 | 1 236 947 240 | 20 006 947 | 13 681 |
“6-1~8”代表来自6月龄的样本;“12-1~8”代表来自12月龄的样本。 | |
“6-1~8” represented samples from 6-month-old individuals; “12-1~8” represented samples from 12-month-old individuals. |
2.3 不同月龄杂交肉牛瘤胃微生物多样性分析
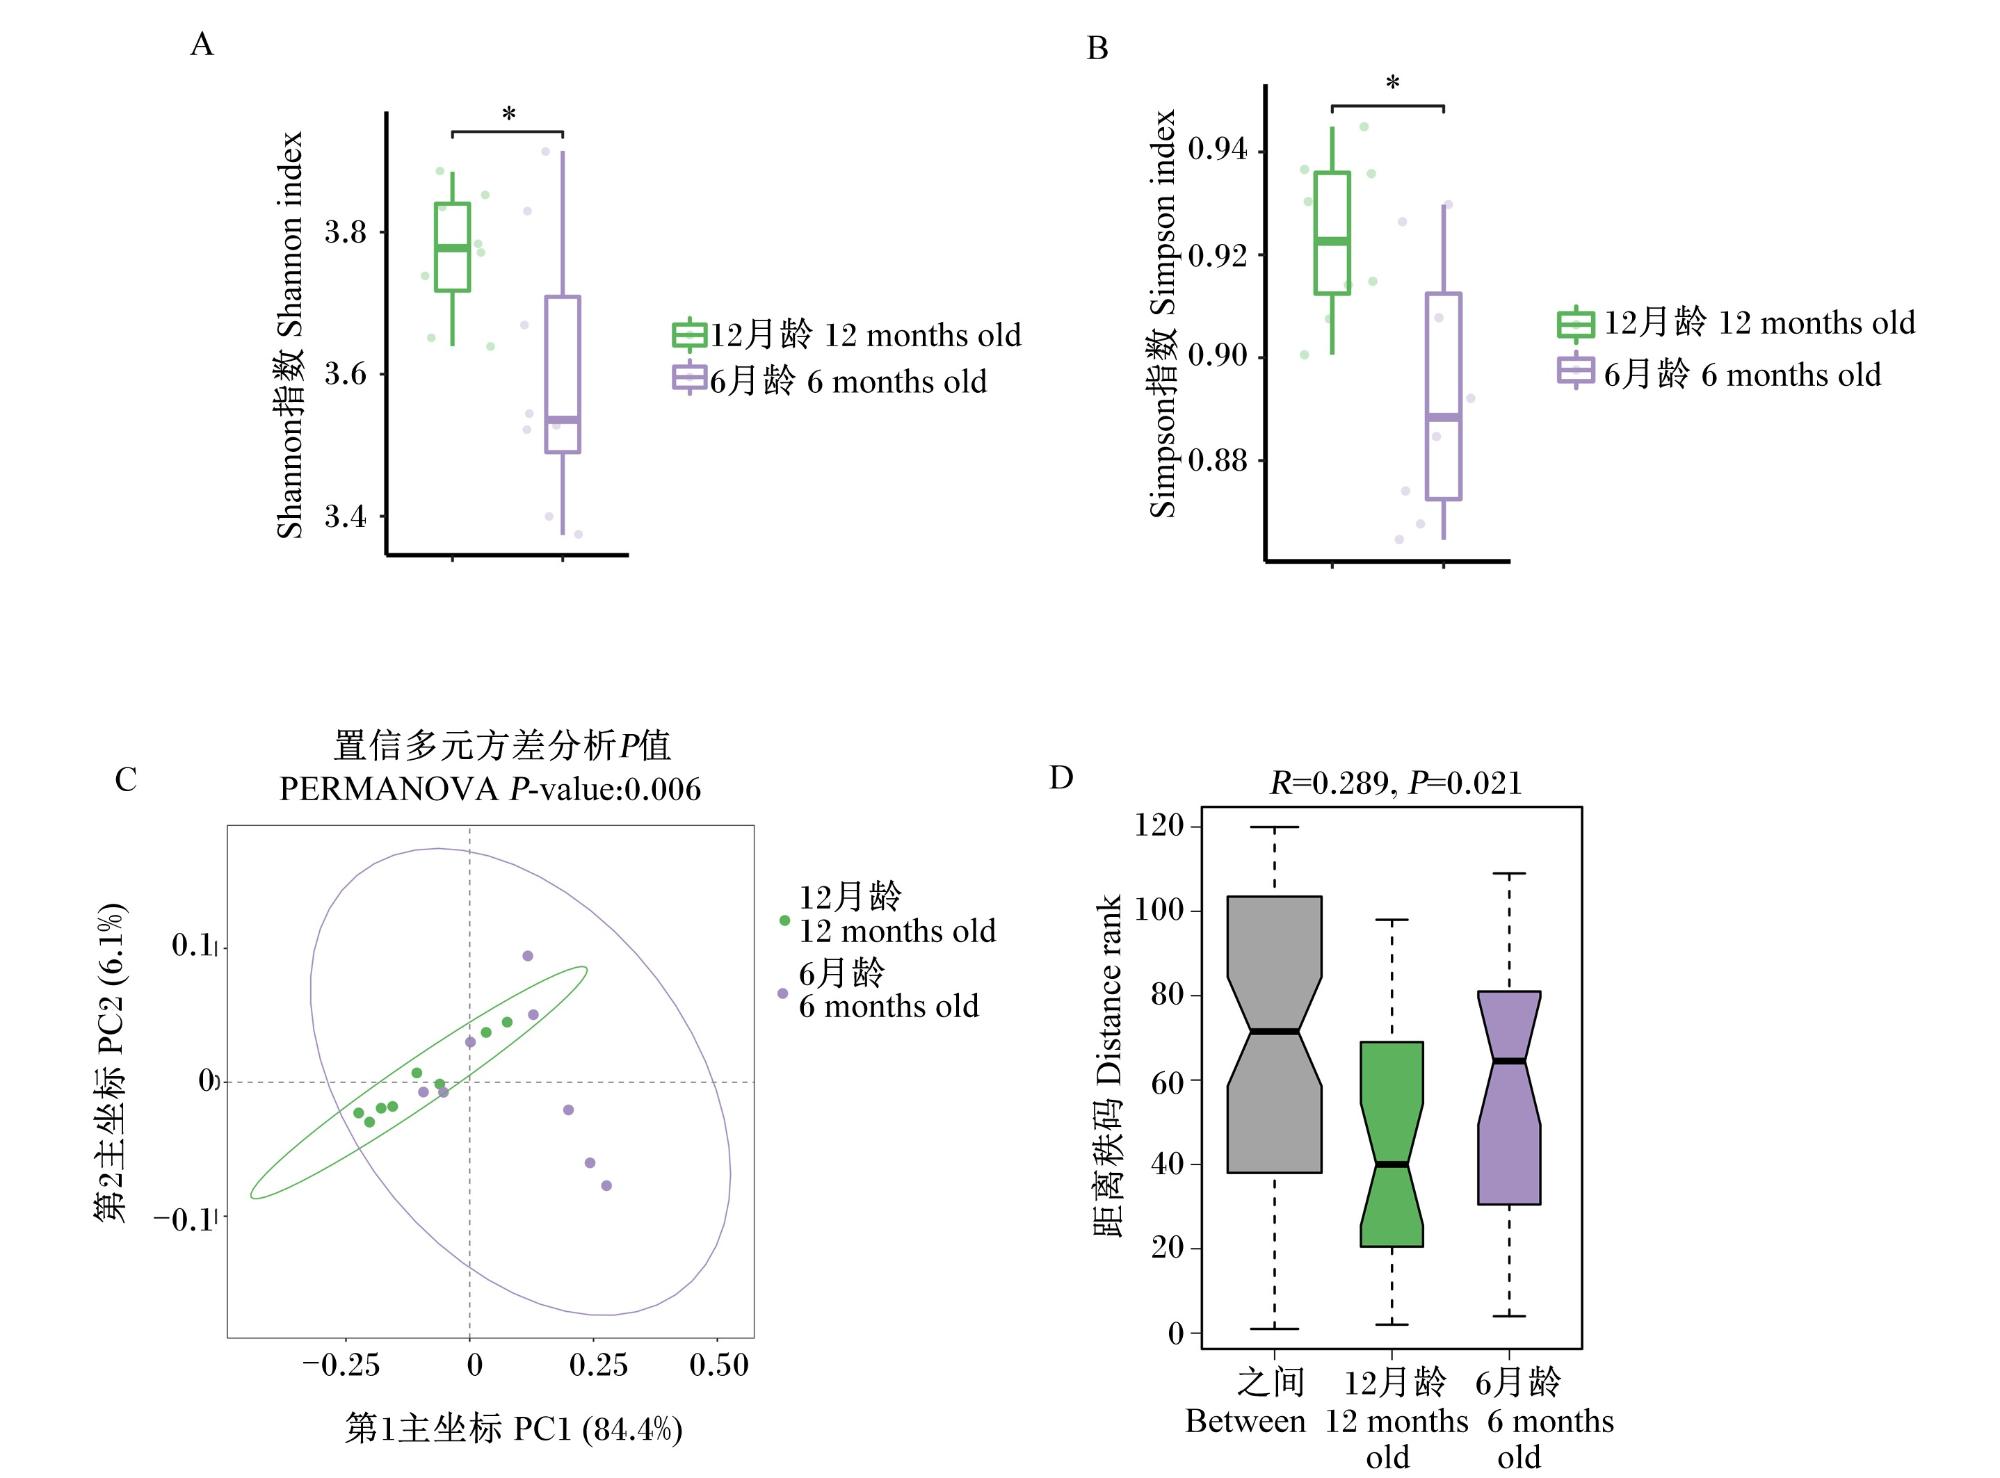
2.4 不同月龄杂交肉牛瘤胃微生物组成分析
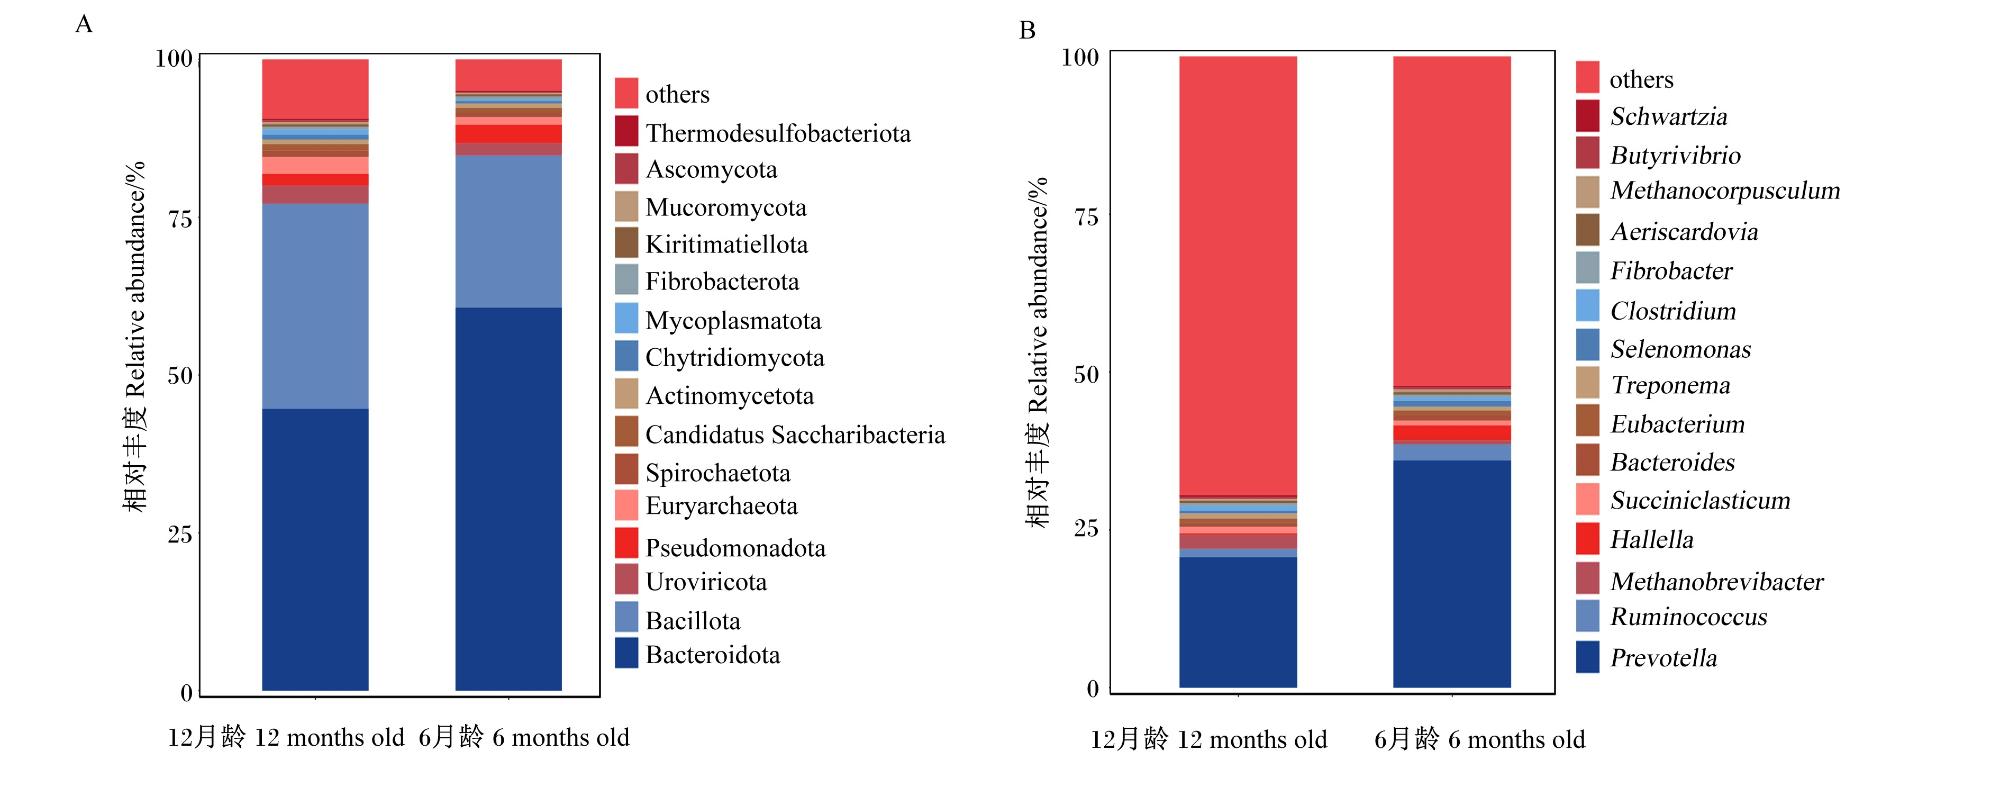
图2 杂交肉牛瘤胃微生物群落组成分析A:门水平 phylum level;B:属水平 genus level Fig.2 Analysis of rumen microbial community composition in crossbred beef cattle |
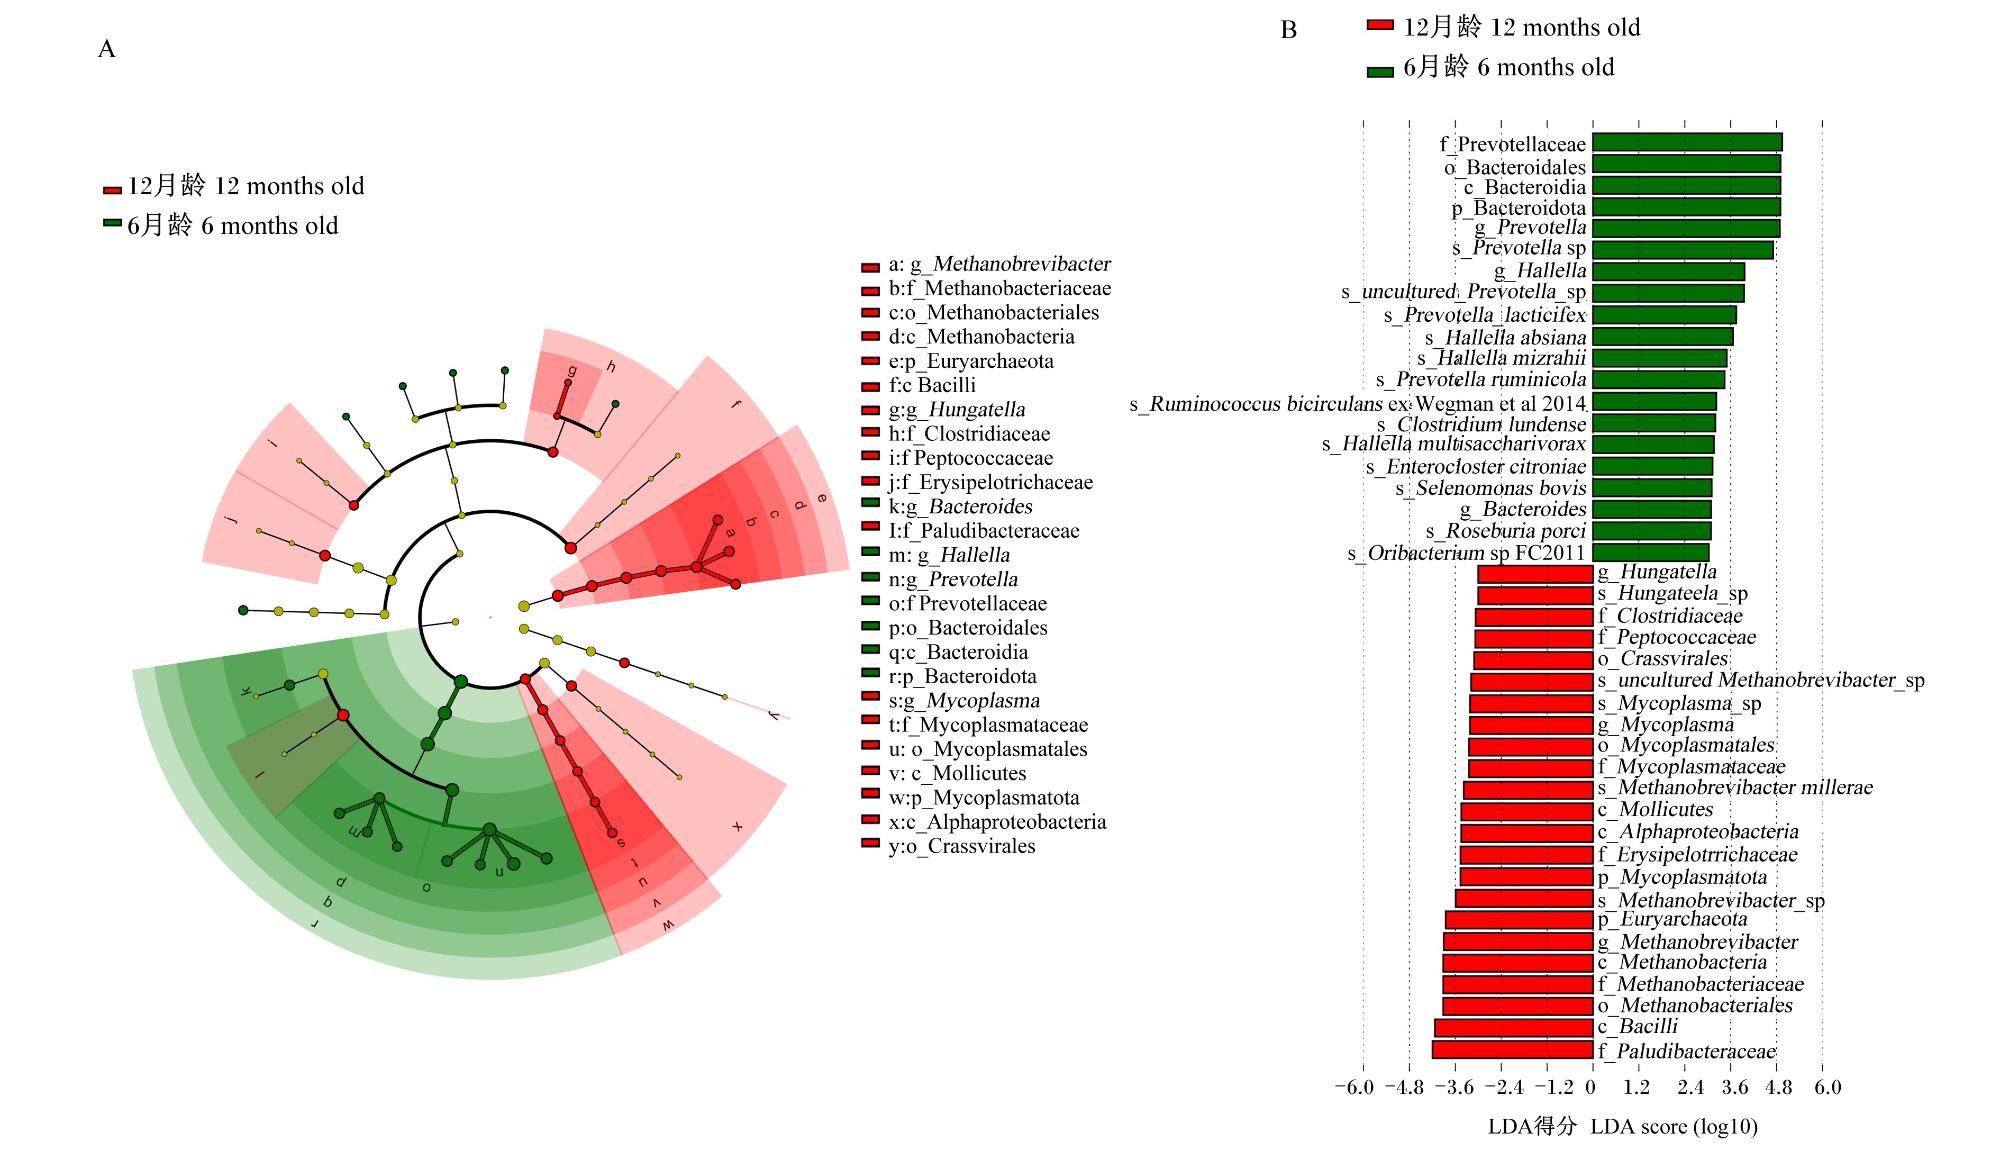
图3 杂交肉牛瘤胃差异物种相对丰度的LEfSe分析A:差异物种注释分支图 differential species annotation branch diagram;B:差异物种LDA评分图 LDA score plot of differential species Fig.3 LEfSe analysis of relative abundance of differential species in rumen of crossbred beef cattle |
2.5 杂交肉牛瘤胃微生物与体重、体尺的相关性分析
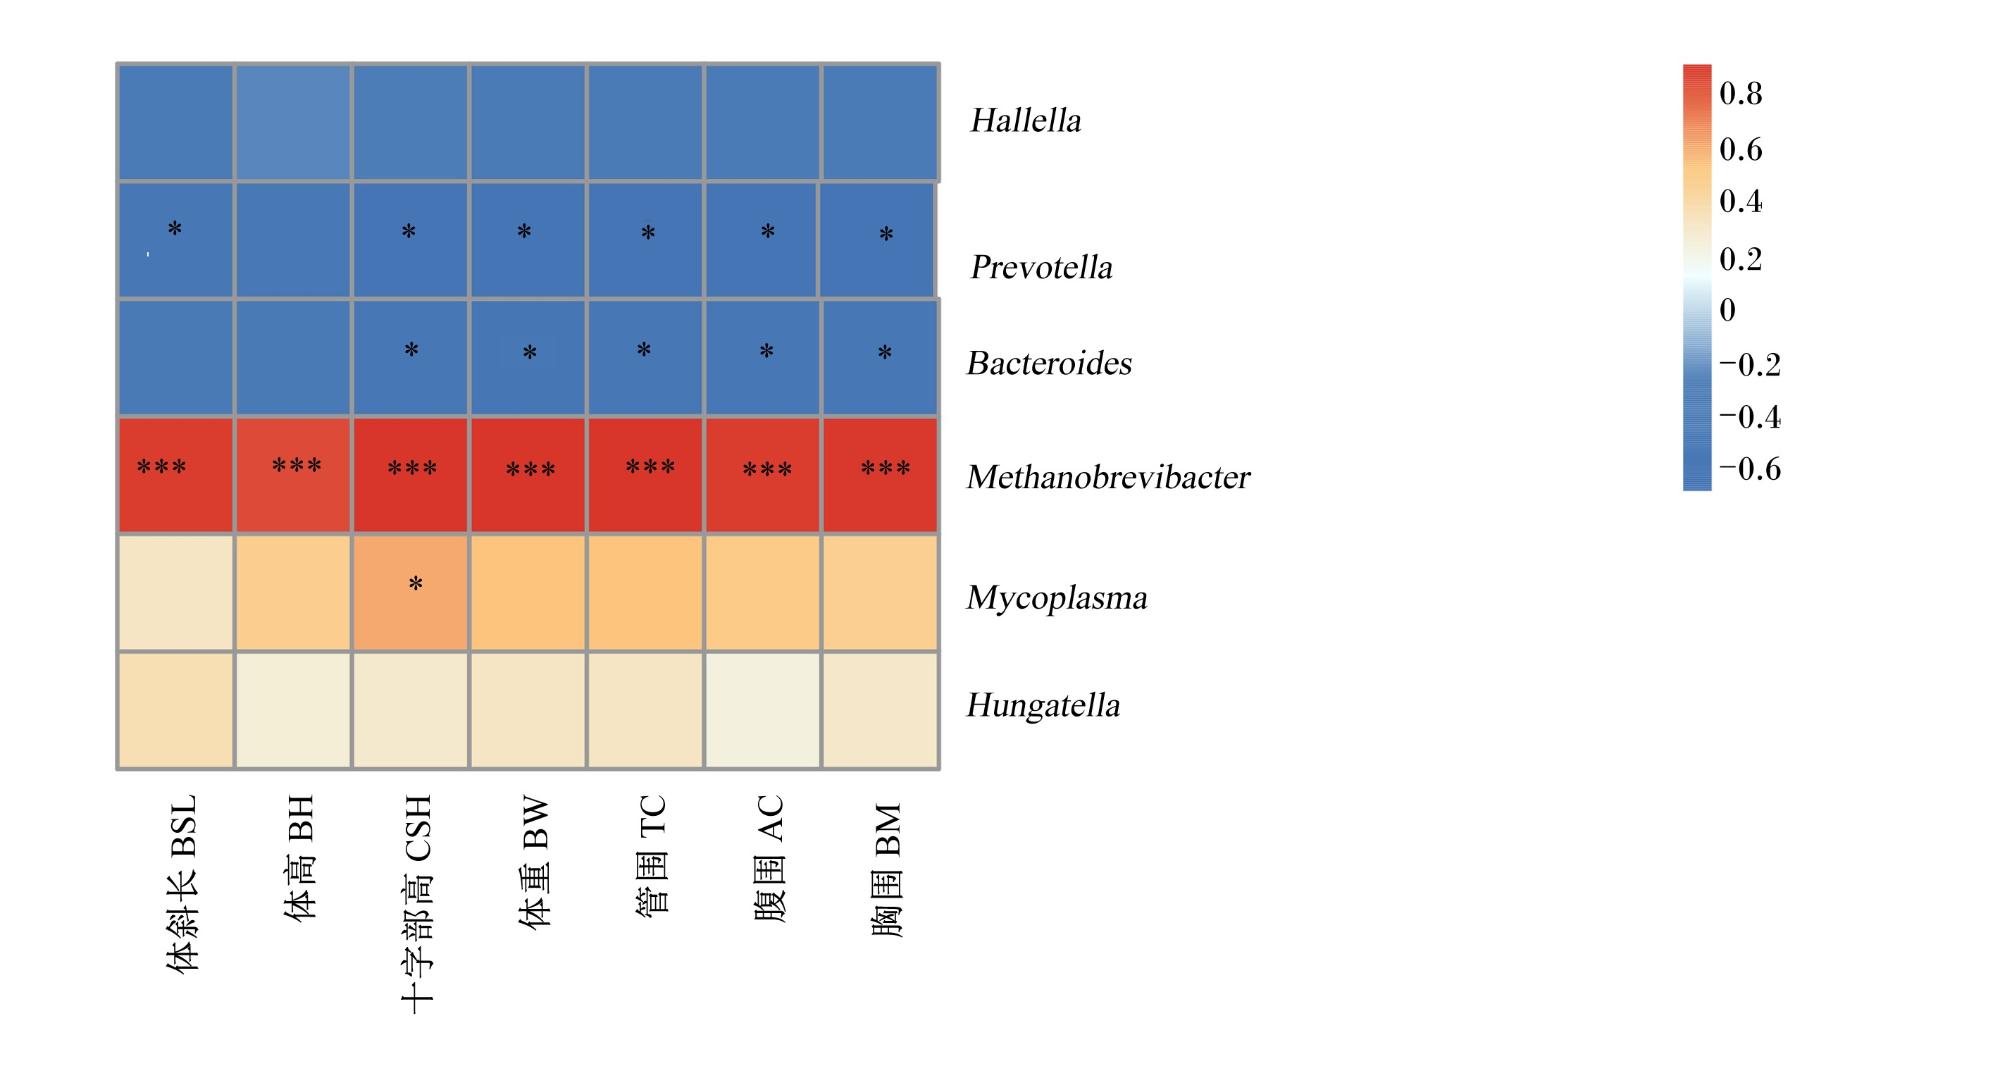
图4 杂交肉牛瘤胃特征微生物与体重、体尺的相关性分析红色表示正相关,蓝色表示负相关,颜色越深表示相关性越强;“*”表示P<0.05,“**”表示P<0.01,“***”表示P<0.001。Red indicated positive correlation, blue indicated negative correlation, and the deeper color indicated the stronger correlation; “*” indicated P<0.05, “**” indicated P<0.01, “***” indicated P<0.001. Fig.4 Correlation analysis of characteristic microorganisms in the rumen of crossbred beef cattle with body weight and body measurements |
2.6 不同月龄杂交肉牛瘤胃微生物功能分析
2.6.1 KEGG通路富集分析
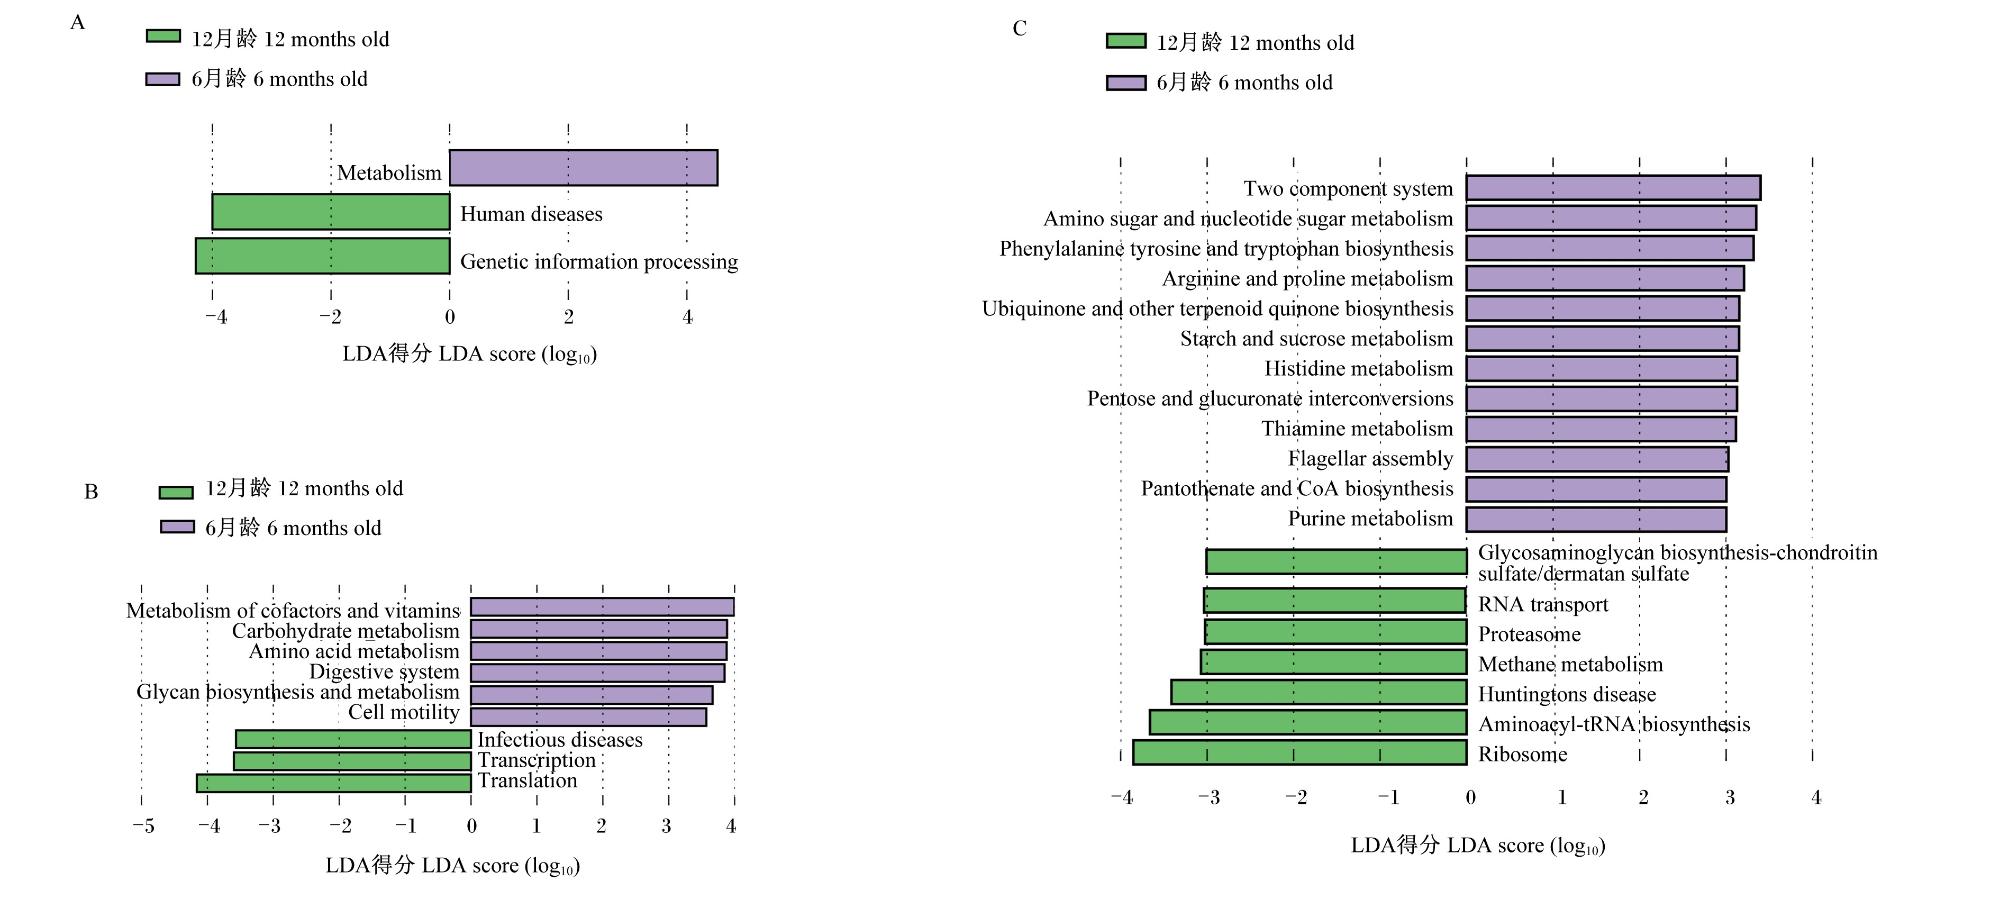
图5 KEGG通路LEfSe分析A、B和C分别表示1级、2级和3级水平。A, B and C represented level 1, level 2 and level 3, respectively. Fig.5 LEfSe analysis of KEGG pathways |
2.6.2 CAZy功能注释分析
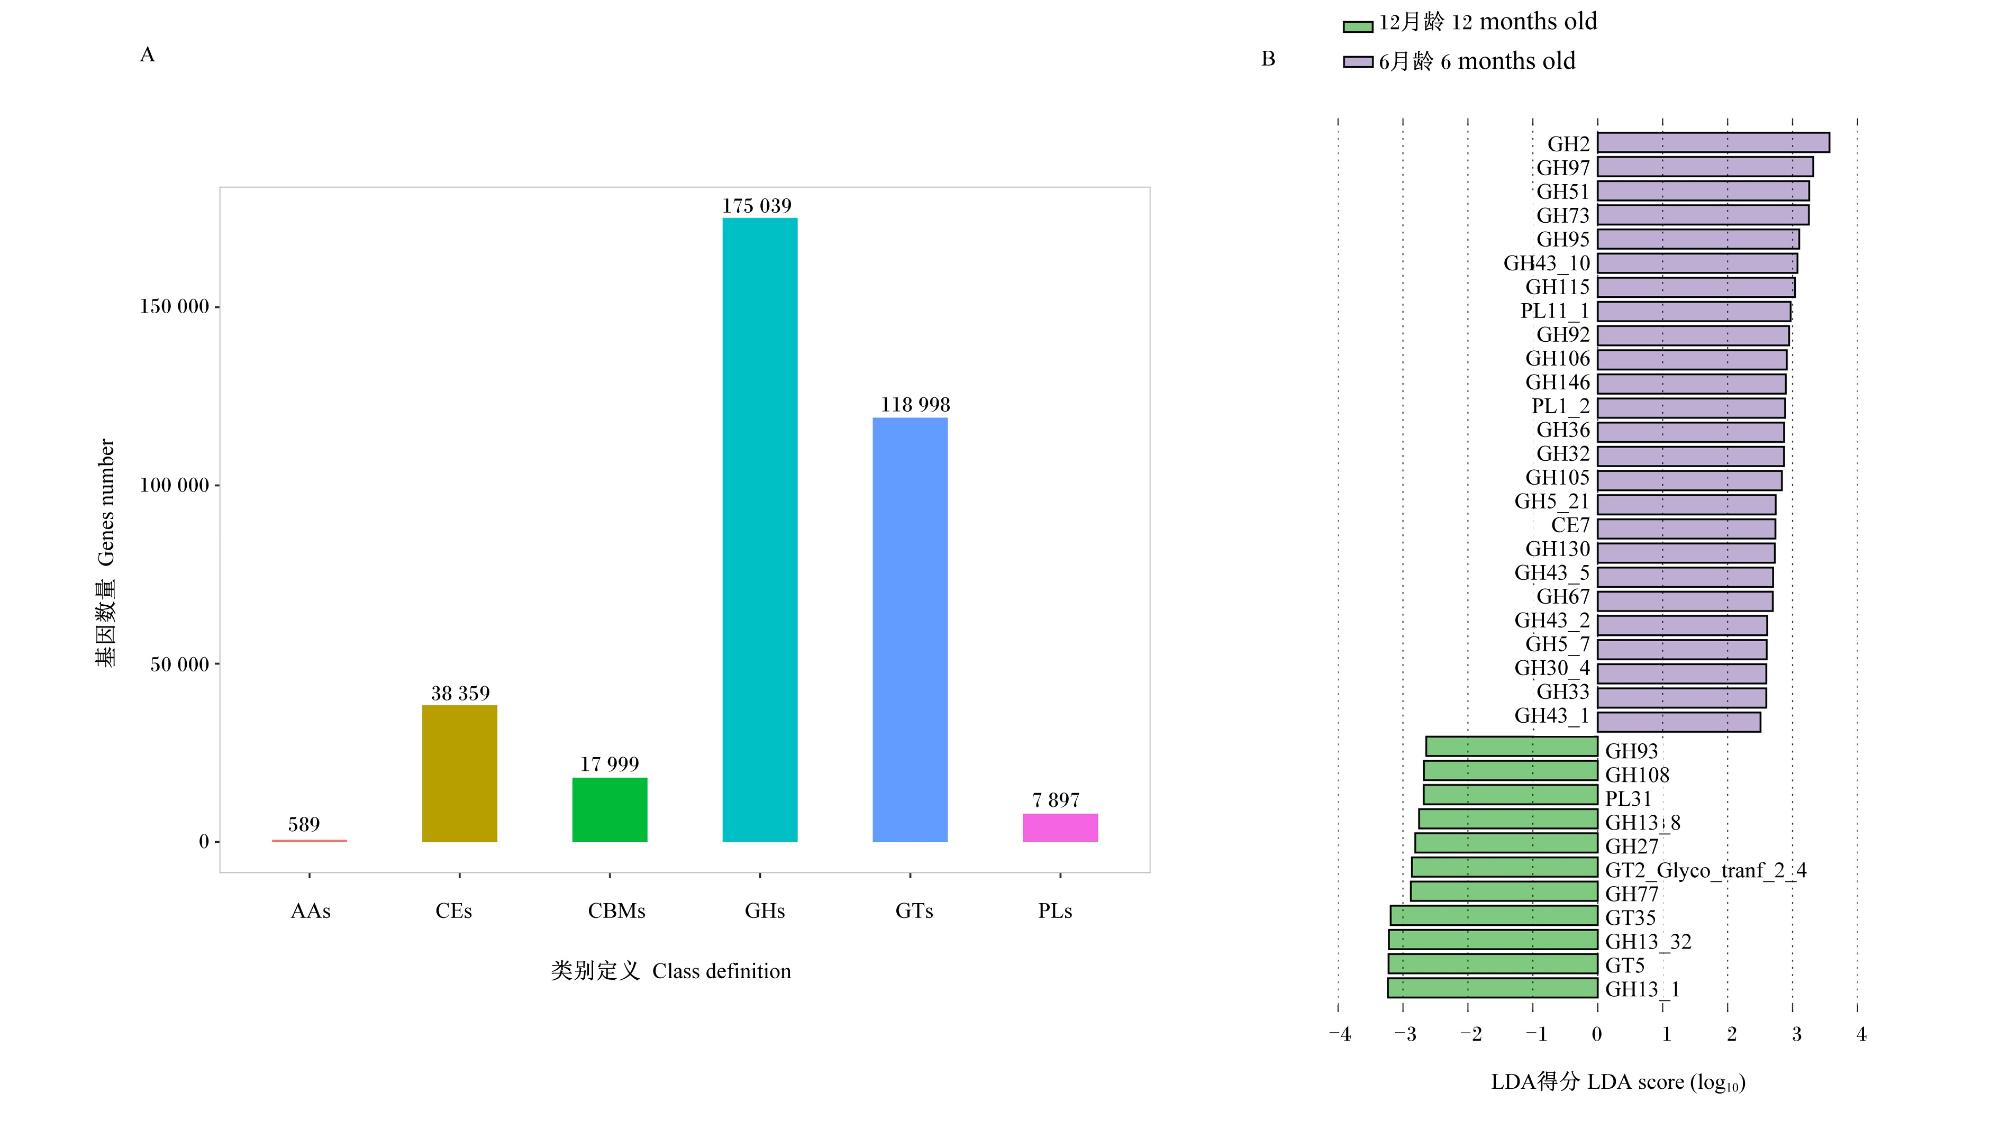
图6 CAZy功能注释LefSe分析A:CAZy功能注释柱状图;B:差异CAZy的LDA评分图。A: CAZy functional annotation bar chart; B: LDA score plot of differential CAZy. AAs:辅助氧化还原酶 auxiliary activities;CEs:碳水化合物酯酶 carbohydrate esterases;CBMs:碳水化合物结合模块 carbohydrate-binding modules;GHs:糖苷水解酶 glycoside hydrolases;GTs:糖基转移酶 glycosyl transferases;PLs:多糖裂合酶 polysaccharide lyases。 Fig.6 LefSe analysis of CAZy functional annotation |
 京公网安备 11010802041926号


