

1 材料与方法
1.1 伦理声明
1.2 试验设计
1.3 饲养管理
表1 饲粮组成及营养水平(干物质基础)Table 1 Composition and nutrient levels of diets (DM basis) % |
| 项目 Items | 对照组 Control group | 试验组 Experimental group |
|---|---|---|
| 原料Ingredients | ||
| 全株玉米青贮 Whole-plant corn silage | 30.0 | 30.0 |
| 棉渣Cotton residue | 30.0 | 30.0 |
| 普通玉米Common corn | 24.0 | 12.0 |
| 高湿玉米High moisture corn | 12.0 | |
| 棉籽粕Cottonseed meal | 6.0 | 6.0 |
| 豆粕Soybean meal | 6.0 | 6.0 |
| 麦麸Wheat bran | 1.2 | 1.2 |
| 预混料Premix1) | 2.0 | 2.0 |
| 食盐NaCl | 0.4 | 0.4 |
| 小苏打NaHCO3 | 0.4 | 0.4 |
| 合计Total | 100.0 | 100.0 |
| 营养水平Nutrient levels2) | ||
| 代谢能ME/(MJ/kg) | 13.81 | 13.83 |
| 粗蛋白质CP | 13.25 | 13.27 |
| 粗脂肪EE | 4.21 | 4.35 |
| 酸性洗涤纤维ADF | 25.35 | 25.19 |
| 中性洗涤纤维NDF | 67.25 | 68.01 |
| 粗灰分Ash | 8.35 | 8.64 |
| 钙Ca | 0.66 | 0.67 |
| 磷P | 0.34 | 0.35 |
1)预混料为每千克饲粮提供 The premix provided the following per kg of diets:VA 130 000~250 000 IU,VD 34 000~100 000 IU,VE 1 400 IU,Cu (as copper sulfate) 550~800 mg,Fe (as ferrous sulfate) 1 500~7 000 mg,Mn (as manganese sulfate) 1 100~3 000 mg,Zn (as zinc sulfate) 800~2 000 mg,I (as potassium iodide) 20~30 mg,Se 8~12 mg,Co 20~30 mg。 2)代谢能为计算值,其他营养水平为实测值。ME was a calculated value, while the other nutrient levels were measured values. |
1.4 样品采集和指标测定
1.4.1 生产性能
1.4.2 饲粮营养成分和营养物质表观消化率
1.4.3 血清生化指标
1.4.4 肠道非靶向代谢组学分析
1.4.4.1 样本采集
1.4.4.2 样本制备
1.5 数据分析
2 结果与分析
2.1 高湿玉米对哈萨克公羊生产性能的影响
表2 高湿玉米对哈萨克公羊生产性能的影响Table 2 Effects of high moisture corn on performance of Kazakh rams |
| 项目 Items | 对照组 Control group | 试验组 Experimental group | P值 P-value |
|---|---|---|---|
| 初始体重IBW/kg | 35.19±4.68 | 35.82±3.27 | 0.269 |
| 终末体重FBW/kg | 59.24±9.21 | 61.94±9.89 | 0.965 |
| 平均日增重ADG/(kg/d) | 0.20±0.04 | 0.22±0.07 | 0.174 |
| 平均日采食量ADFI/(kg/d) | 2.28±0.49 | 2.15±0.04 | 0.093 |
| 料重比F/G | 11.36±0.01a | 9.84±0.00b | 0.041 |
| 胴体重Carcass weight/kg | 26.45±3.54 | 28.57±5.27 | 0.433 |
| 屠宰率Slaughter rate/% | 44.64±2.26 | 46.12±1.89 | 0.347 |
同行数据肩标不同小写字母表示差异显著(P<0.05),不同大写字母表示差异极显著(P<0.01),无字母表示差异不显著(P>0.05)。下表同。 | |
In the same row, values with different small letter superscripts mean significant difference (P<0.05), and with different capital letter superscripts mean extremely significant difference (P<0.01), while with no letter superscript mean no significant difference (P>0.05). The same as below. |
2.2 高湿玉米对哈萨克公羊营养物质表观消化率的影响
表3 高湿玉米对哈萨克公羊营养物质表观消化率的影响Table 3 Effects of high moisture corn on nutrient apparent digestibility of Kazakh rams % |
| 项目 Items | 对照组 Control group | 试验组 Experimental group | P值 P-value |
|---|---|---|---|
| 粗蛋白质CP | 63.52±1.38 | 68.44±1.31 | 0.067 |
| 粗脂肪EE | 78.22±2.52 | 84.66±1.71 | 0.072 |
| 中性洗涤纤维NDF | 75.78±2.37 | 79.98±2.34 | 0.054 |
| 酸性洗涤纤维ADF | 65.77±2.03 | 69.88±1.95 | 0.072 |
| 粗灰分Ash | 55.28±1.83 | 59.58±1.73 | 0.071 |
2.3 高湿玉米对哈萨克公羊血清生化指标的影响
表4 高湿玉米对哈萨克公羊血清生化指标的影响Table 3 Effects of high moisture corn on serum biochemical indices of Kazakh rams |
| 项目 Items | 时间 Time | 对照组 Control group | 试验组 Experimental group | P值 P-value | |||||
|---|---|---|---|---|---|---|---|---|---|
总蛋白 TP/(g/L) | 第1天Day 1 | 64.45±2.65 | 64.94±3.34 | 0.793 | |||||
| 第40天Day 40 | 65.77±3.98 | 68.88±3.19 | 0.364 | ||||||
| 第80天Day 80 | 63.39±5.82 | 67.29±1.07 | 0.179 | ||||||
| 第120天Day 120 | 65.54±2.06 | 69.38±1.22 | 0.444 | ||||||
总胆固醇 TC/(mmol/L) | 第1天Day 1 | 1.20±0.08 | 1.07±0.15 | 0.115 | |||||
| 第40天Day 40 | 1.79±0.46 | 1.67±0.36 | 0.655 | ||||||
| 第80天Day 80 | 1.83±0.48 | 1.57±0.25 | 0.272 | ||||||
| 第120天Day 120 | 1.49±0.32 | 1.29±0.18 | 0.211 | ||||||
甘油三酯 TG/(mmol/L) | 第1天Day 1 | 0.26±0.10 | 0.26±0.05 | 0.944 | |||||
| 第40天Day 40 | 0.33±0.09 | 0.39±0.16 | 0.468 | ||||||
| 第80天Day 80 | 0.27±0.07 | 0.28±0.05 | 0.522 | ||||||
| 第120天Day 120 | 0.23±0.05 | 0.25±0.04 | 0.526 | ||||||
高密度脂蛋白 HDL/(mmol/L) | 第1天Day 1 | 0.60±0.04 | 0.60±0.08 | 0.894 | |||||
| 第40天Day 40 | 0.81±0.16 | 0.90±0.30 | 0.538 | ||||||
| 第80天Day 80 | 0.77±0.13 | 0.79±0.09 | 0.827 | ||||||
| 第120天Day 120 | 0.71±0.09 | 0.69±0.06 | 0.671 | ||||||
葡萄糖 GLU/(mmol/L) | 第1天Day 1 | 4.42±0.53 | 4.46±0.69 | 0.925 | |||||
| 第40天Day 40 | 5.49±0.78 | 5.19±0.49 | 0.435 | ||||||
| 第80天Day 80 | 4.95±0.65 | 4.90±0.20 | 0.851 | ||||||
| 第120天Day 120 | 5.15±0.61 | 4.73±0.54 | 0.233 | ||||||
低密度脂蛋白 LDL/(mmol/L) | 第1天Day 1 | 0.47±0.14 | 0.39±0.11 | 0.336 | |||||
| 第40天Day 40 | 0.66±0.22 | 0.65±0.25 | 0.941 | ||||||
| 第80天Day 80 | 0.61±0.08 | 0.53±0.07 | 0.111 | ||||||
| 第120天Day 120 | 0.49±0.16 | 0.35±0.12 | 0.114 | ||||||
尿素氮 UN/(mg/dL) | 第1天Day 1 | 16.00±2.61 | 13.65±1.00 | 0.084 | |||||
| 第40天Day 40 | 15.22±2.29A | 10.09±3.14B | 0.009 | ||||||
| 第80天Day 80 | 15.36±1.42 | 13.98±0.94 | 0.128 | ||||||
| 第120天Day 120 | 15.37±1.77A | 11.28±2.07B | 0.004 |
2.4 高湿玉米对哈萨克公羊肠道代谢的影响
2.4.1 代谢物正交偏最小二乘判别分析(OPLS-DA)
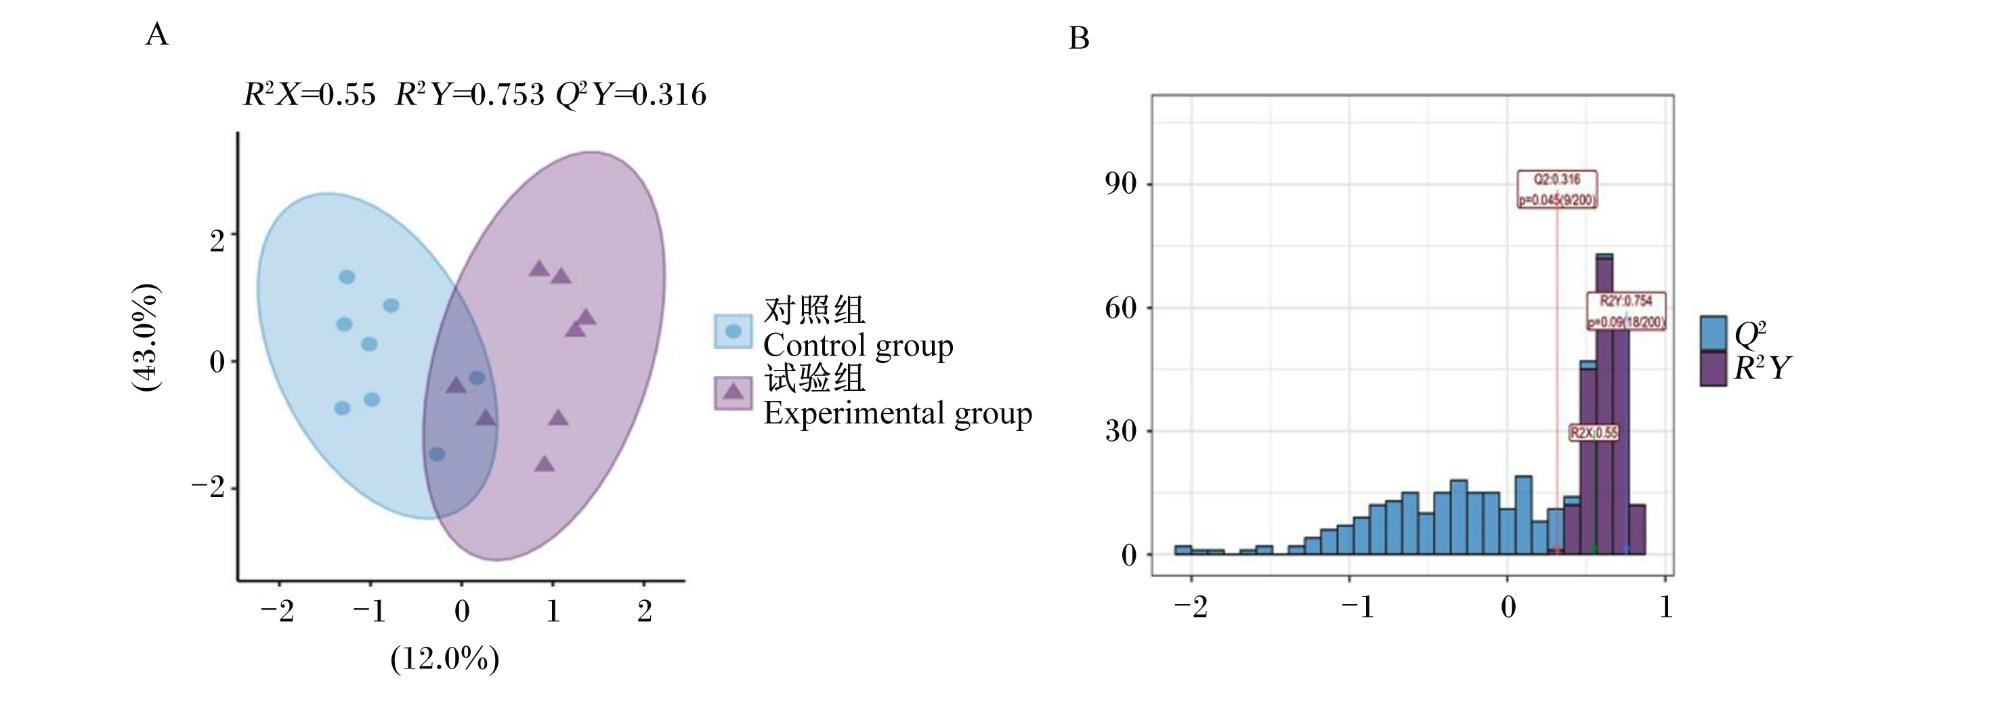
图1 OPLS-DA得分图和OPLS-DA验证图A:OPLS-DA得分图。横坐标表示预测主成分,其方向可以看出组间的差距;纵坐标表示正交主成分,其方向可以看出组内的差距;百分比表示该成分对数据集的解释率。图中的每个点表示一个样品,同一个组的样品使用同一种颜色表示。B:OPLS-DA验证图。横坐标表示模型准确率,纵坐标是模型分类效果出现的频数。 Fig.1 OPLS-DA score plot and OPLS-DA validation plot A: OPLS-DA score plot. The x-axis represents the predicted principal component, and its direction indicates the differences between groups; the y-axis represents the orthogonal principal component, and its direction indicates the differences within groups; the percentage indicates the contribution rate of this component to the dataset. Each point in the plot represents a sample, with samples in the same group represented by the same color. B: OPLS-DA validation plot. The x-axis represents model accuracy, and the y-axis represents the frequency of occurrence of the model’s classification performance. |
2.4.2 差异代谢物筛选与分析
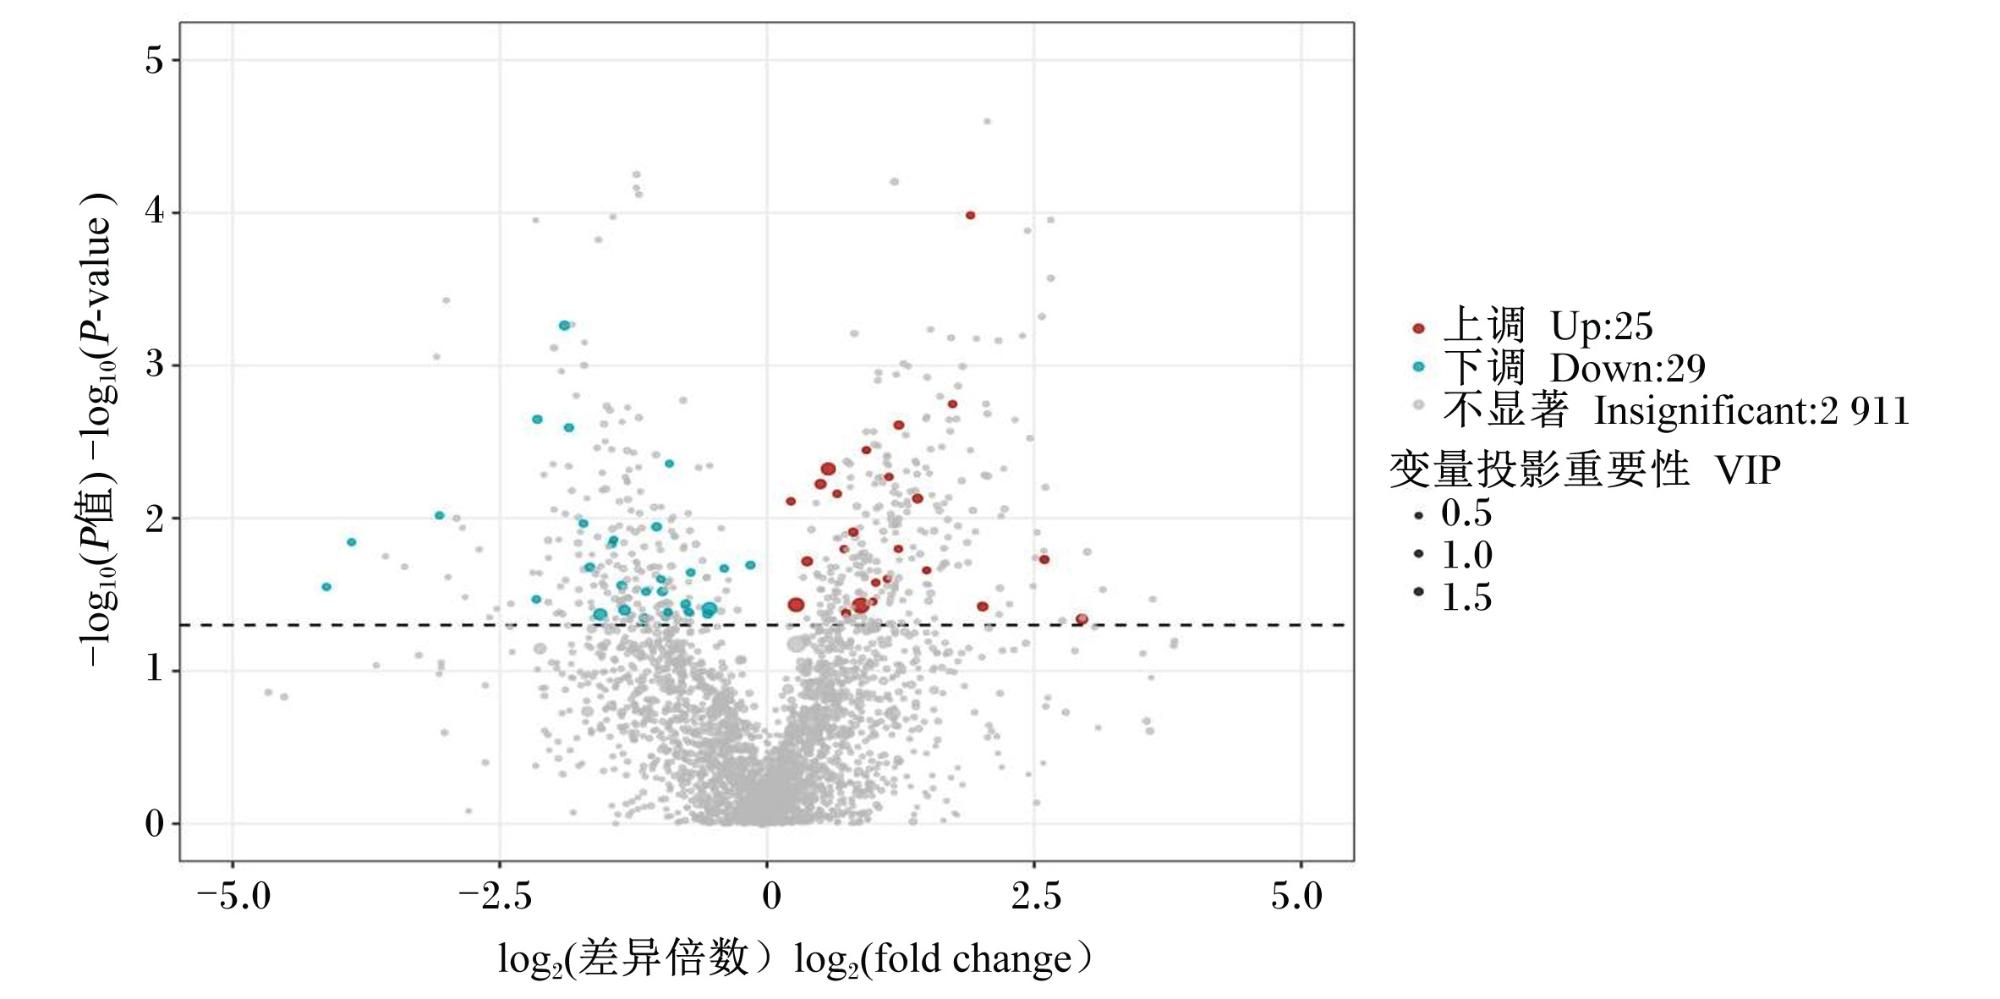
图2 差异代谢物火山图火山图中的每1个点表示1种代谢物,其中蓝色的点代表下调差异代谢物,红色的点代表上调差异代谢物,灰色的点代表检测到但差异不显著的代谢物。 Fig.2 Volcano plot of differential metabolites Each point in the volcano plot represents a metabolite, where blue points indicate downregulated differential metabolites, red points indicate upregulated differential metabolites, and gray points represent detected metabolites with no significant difference. |
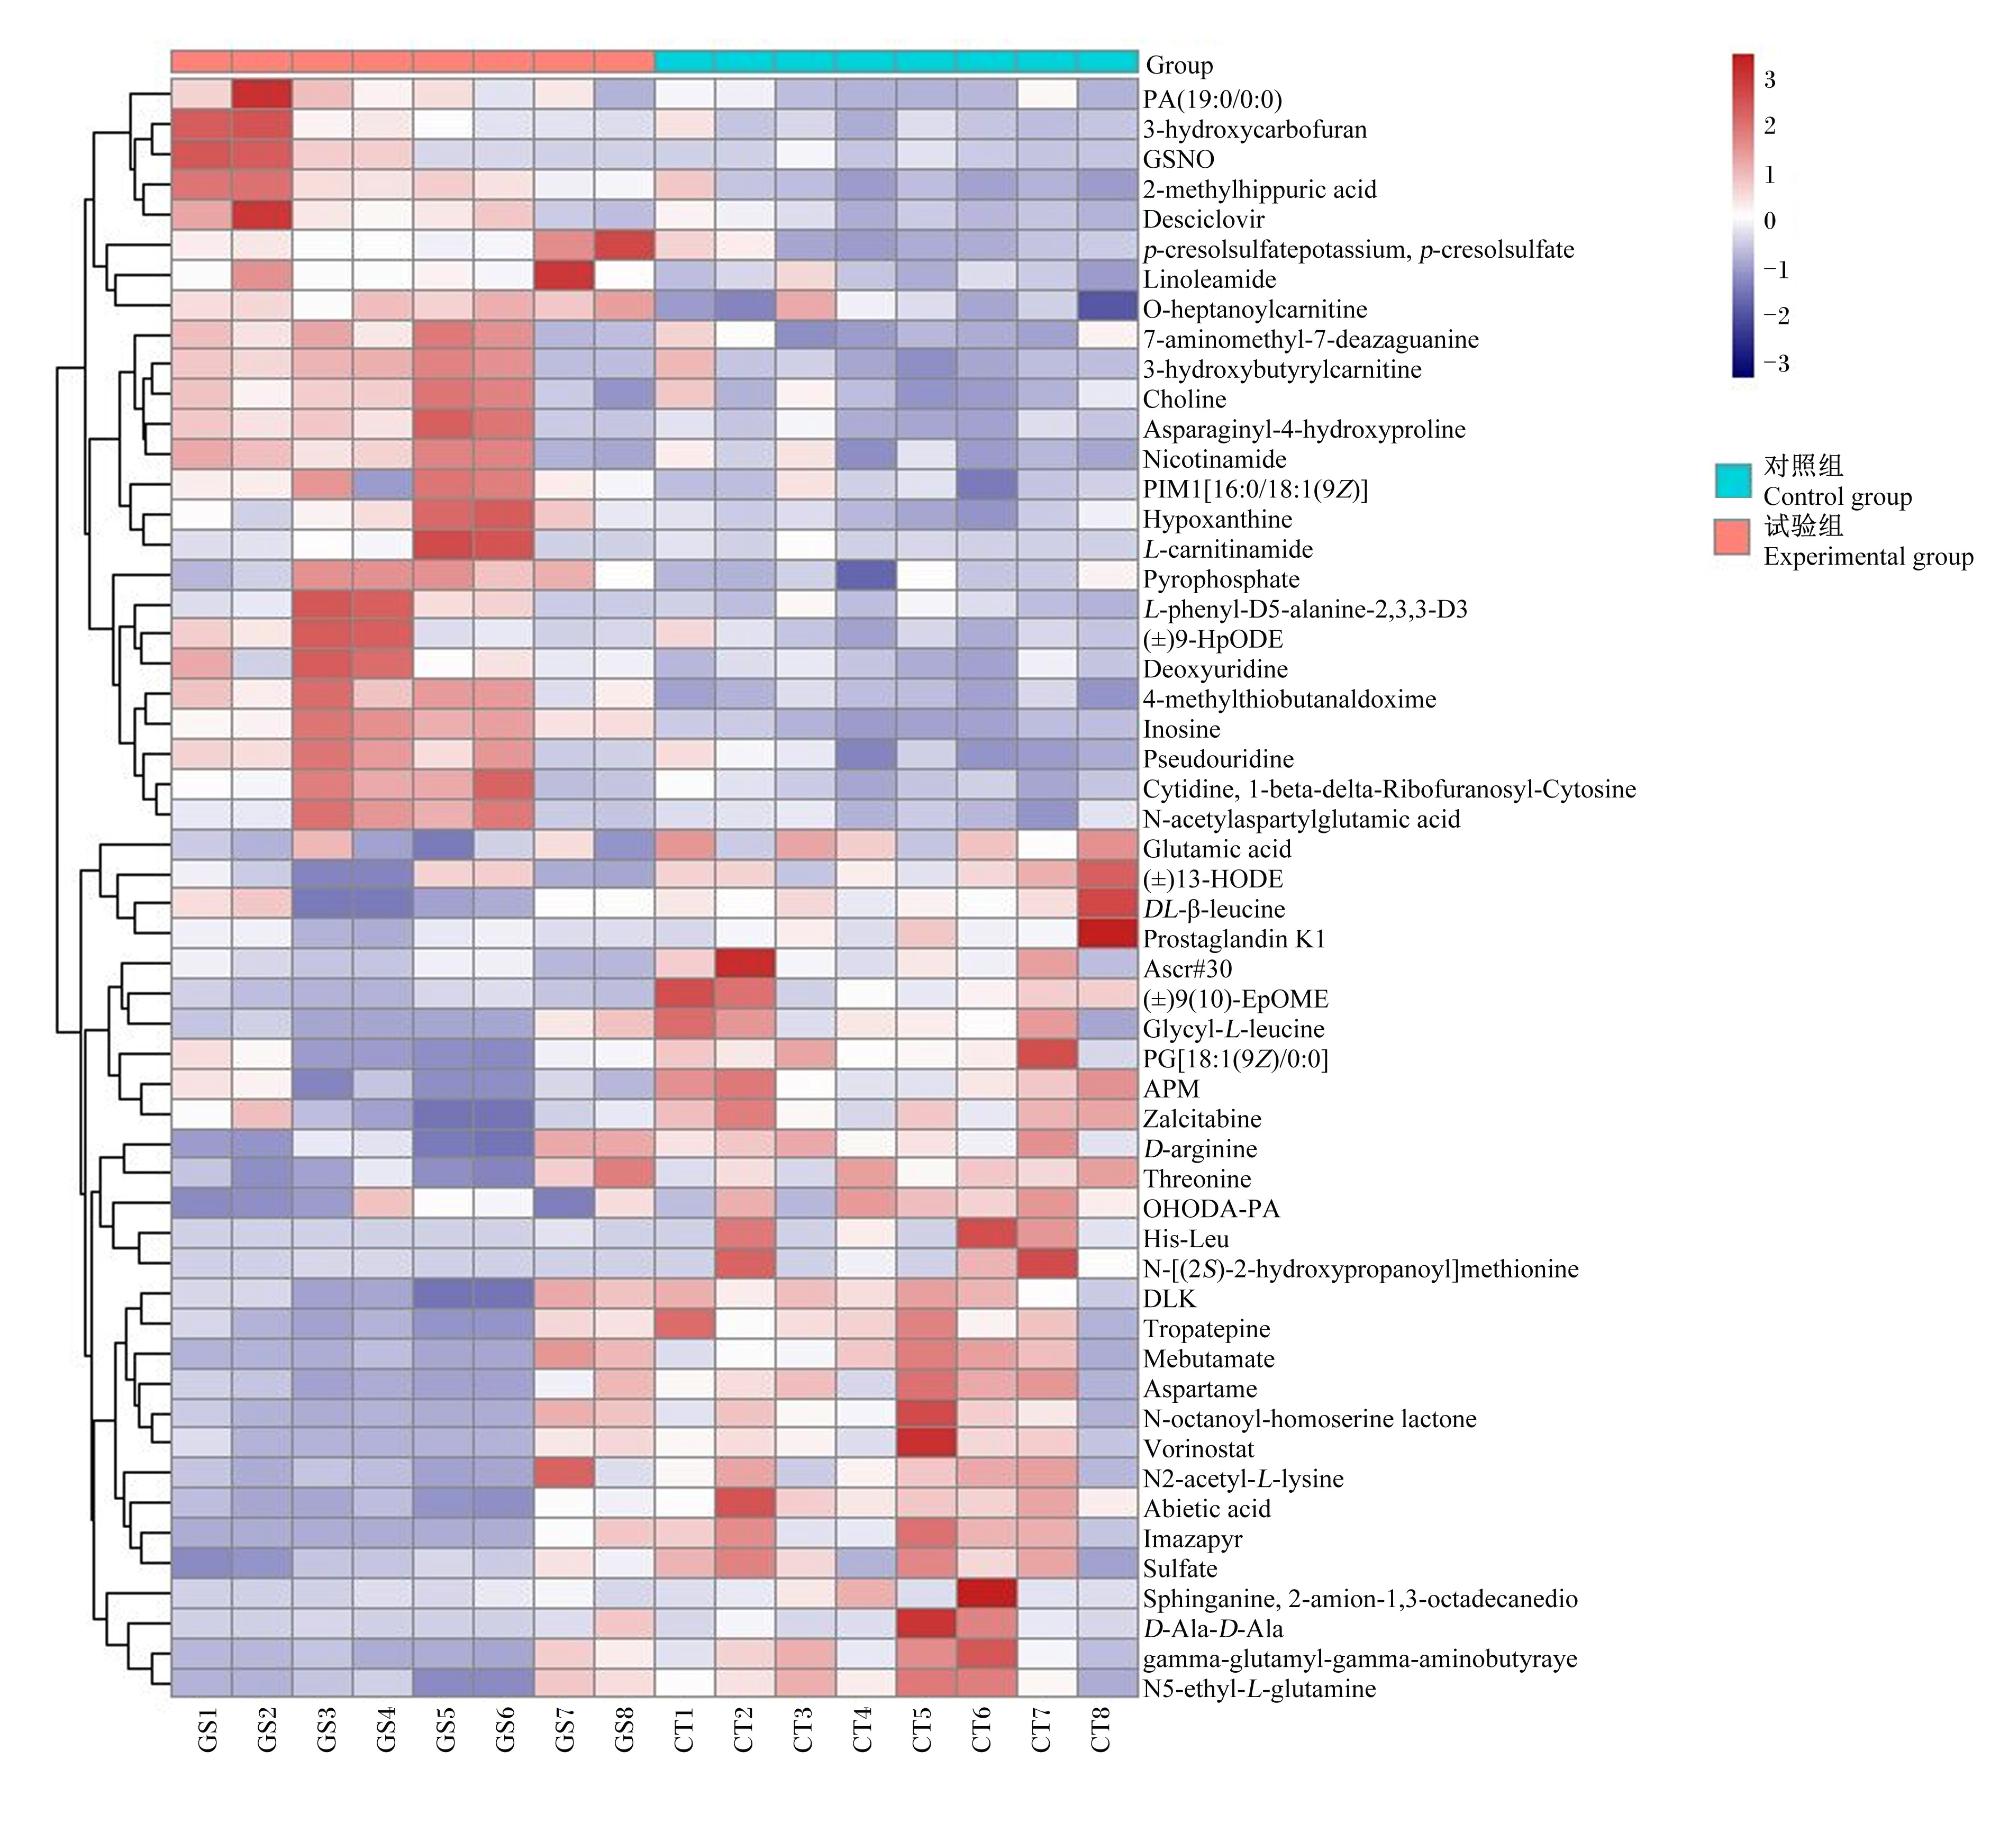
图3 差异代谢物聚类热图PA(19∶0/0∶0):磷脂酸(19∶0/0∶0) phosphatidic acid (19∶0/0∶0);3-hydroxycarbofuran:3-羟基呋喃丹;GSNO:S-亚硝基谷胱甘肽 S-nitroso glutathione;2-methylhippuric acid:2-甲基马尿酸;Desciclovir:脱氧阿昔洛韦;p-cresolsulfatepotassium, p-cresolsulfate:对甲苯基硫酸钾,对甲苯基硫酸;Linoleamide:亚油酰胺;O-heptanoylcarnitine:O-庚酰肉碱;7-aminomethyl-7-deazaguanine:7-氨甲基-7-去氮鸟嘌呤;3-hydroxybutyrylcarnitine:3-羟基丁酰肉碱;Choline:胆碱;Asparaginyl-4-hydroxyproline:天冬酰胺酰-4-羟脯氨酸;Nicotinamide:烟酰胺;PIM1[16∶0/18∶1(9Z)]:磷脂酰肌醇甘露糖苷1[16∶0/18∶1(9Z)] Phosphatidylinositol mannose glycoside 1[16∶0/18∶1(9Z)];Hypoxanthine:次黄嘌呤;L-carnitinamide:L-肉碱酰胺;Pyrophosphate:焦磷酸盐;L-phenyl-D5-alanine-2,3,3-D3:L-苯基-D5-丙氨酸-2,3,3-D3;(±)9-HpODE:(±)-9-氢过氧十八碳二烯酸 (±)-9-hydrogen peroxide octadecadienoic acid;Deoxyuridine:脱氧尿苷;4-methylthiobutanaldoxime:4-甲硫基丁醛肟;Inosine:肌苷;Pseudouridine:假尿苷;Cytidine, 1-beta-delta-Ribofuranosyl-Cytosine:胞苷,1-β-δ-呋喃核糖基胞嘧啶;N-acetylaspartylglutamic acid:N-乙酰天冬氨酰谷氨酸;Glutamic acid:谷氨酸;(±)13-HODE:(±)-13-羟基十八碳二烯酸 (±)-13-hydroxyoctadecadienoic acid;DL-β-leucine:DL-β-亮氨酸;Prostaglandin K1:前列腺素K1;Ascr#30:线虫信息素#30 nematode pheromone#30;(±)9(10)-EpOME:(±)-9(10)-环氧十八碳烯 (±)-9(10)-epoxy octadecene;Glycyl-L-leucine:甘氨酰-L-亮氨酸;PG[18∶1(9Z)/0∶0]:磷脂酰甘油[18∶1(9Z)/0∶0] phosphatidylglycerol [18∶1(9Z)/0∶0];APM:天冬氨酸苯丙氨酸甲酯 aspartate phenylalanine methyl ester;Zalcitabine:扎西他滨;D-arginine:D-精氨酸;Threonine:苏氨酸;OHODA-PA:羟基十八碳二烯酸-磷脂酸 hydroxyoctadecadienoic acid-phosphatidic acid;His-Leu:组氨酸-亮氨酸 histidine-leucine;N-[(2S)-2-hydroxypropanoyl]methionine:N-[(2S)-2-羟基丙酰]蛋氨酸;DLK:双亮氨酸激酶 duleucine kinase;Tropatepine:托帕替平;Mebutamate:美布氨酯;Aspartame:阿斯巴甜;N-octanoyl-homoserine lactone:N-辛酰基高丝氨酸内酯;Vorinostat:伏立诺他;N2-acetyl-L-lysine:N2-乙酰-L-赖氨酸;Abietic acid:松香酸;Imazapyr:灭草烟;Sulfate:硫酸盐;Sphinganine, 2-amion-1,3-octadecanedio:鞘氨醇,2-氨基-1,3-十八烷二醇;D-Ala-D-Ala:D-丙氨酸-D-丙氨酸 D-alanine-D-alanine;gamma-glutamyl-gamma-aminobutyraye:γ-谷氨酰-γ-氨基丁酸;N5-ethyl-L-glutamine:N5-乙基-L-谷氨酰胺。 Fig.3 Clustering heatmap of differential metabolites The horizontal axis shows sample names, and the vertical axis shows information about differential metabolites; different colors fill in the values obtained after different relative content normalization (red represents high content, green represents low content); the cluster line on the left of the figure is the metabolite cluster line, and the cluster line on the top of the figure is the sample cluster line. |
2.4.3 差异代谢产物的代谢途径
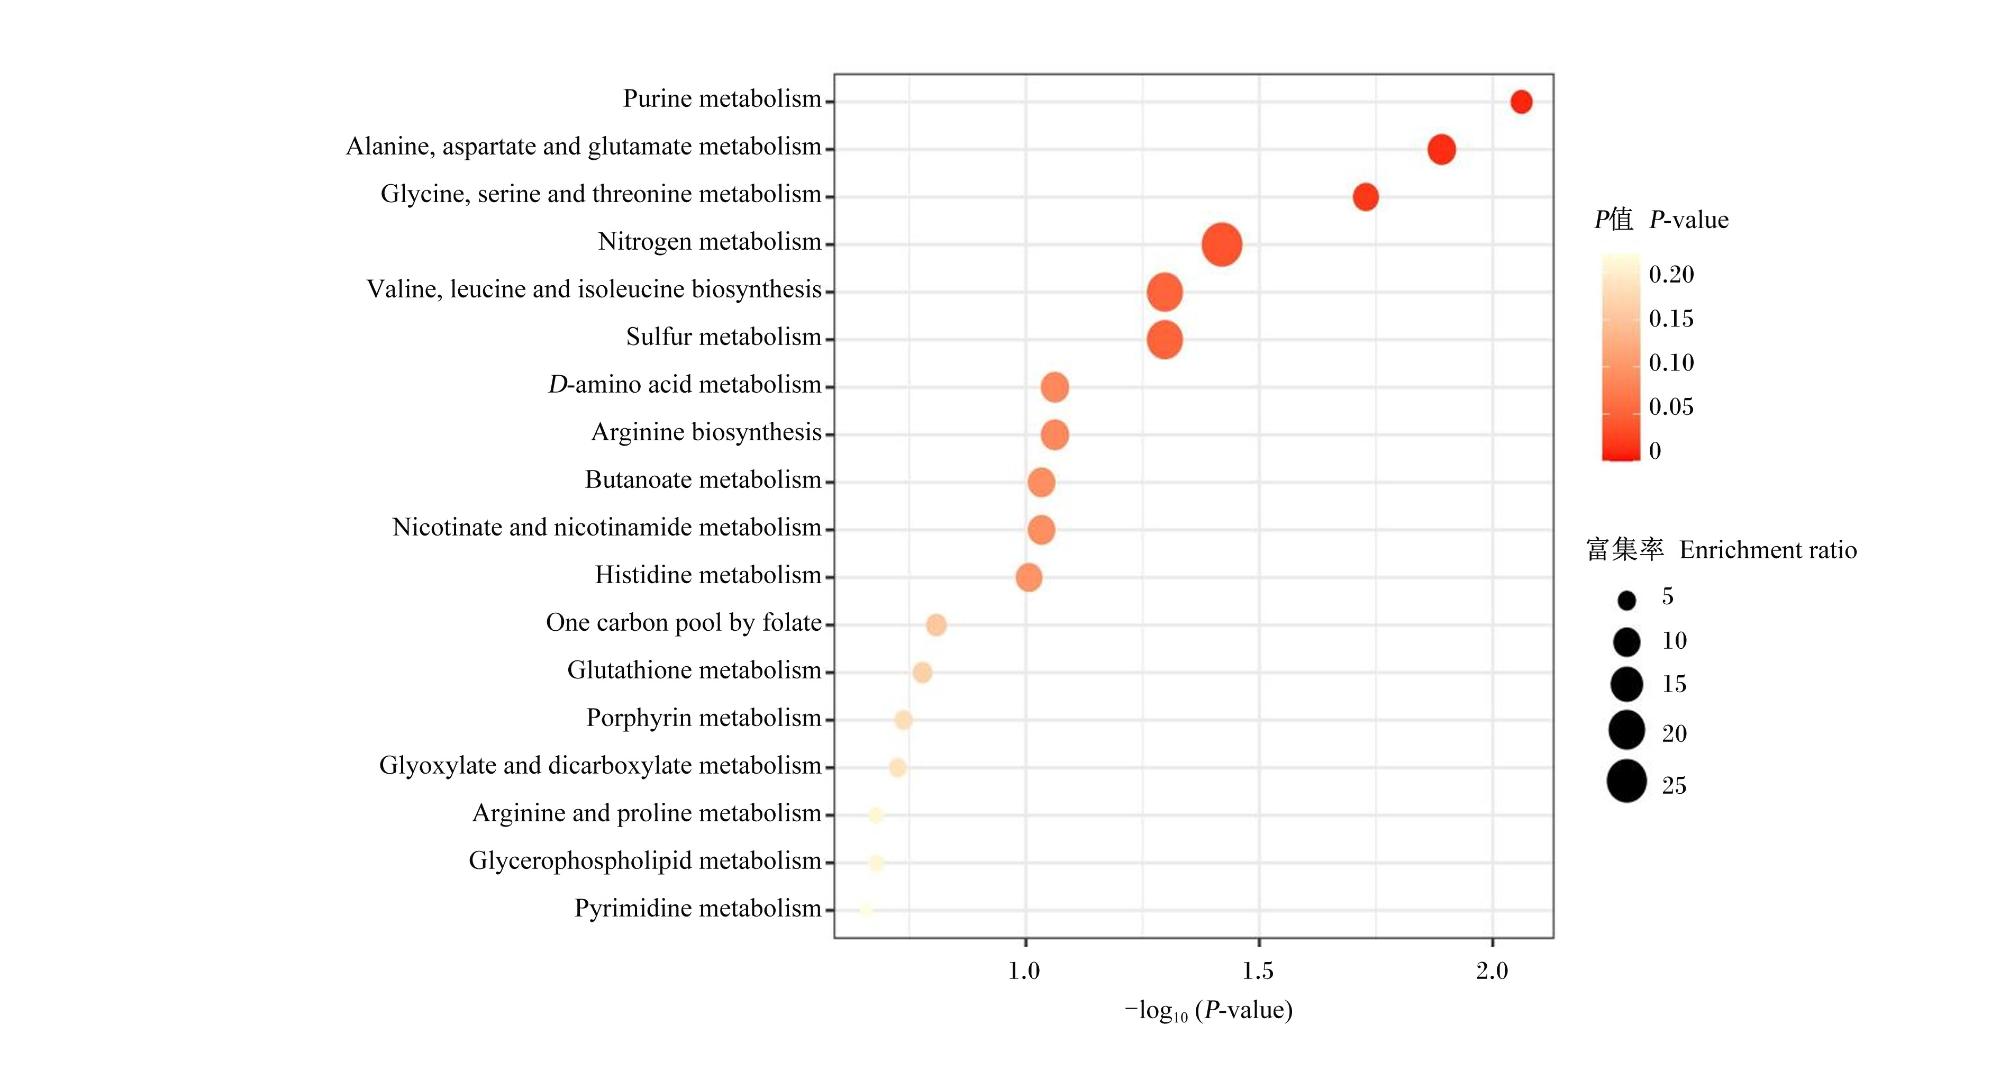
图4 差异代谢物KEGG富集影响因子气泡图Purine metabolism:嘌呤代谢;Alanine, aspartate and glutamate metabolism:丙氨酸、天冬氨酸和谷氨酸代谢;Glycine, serine and threonine metabolism:甘氨酸、丝氨酸和苏氨酸代谢;Nitrogen metabolism:氮代谢;Valine, leucine and isoleucine biosynthesis:缬氨酸、亮氨酸和异亮氨酸生物合成;Sulfur metabolism:硫代谢;D-amino acid metabolism:D-氨基酸代谢;Arginine biosynthesis:精氨酸生物合成;Butanoate metabolism:丁酸代谢;Nicotinate and nicotinamide metabolism:烟酸和烟酰胺代谢;Histidine metabolism:组氨酸代谢;One carbon pool by folate:叶酸介导的一碳单位池;Glutathione metabolism:谷胱甘肽代谢;Porphyrin metabolism:卟啉代谢;Glyoxylate and dicarboxylate metabolism:乙醛酸和二羧酸代谢;Arginine and proline metabolism:精氨酸和脯氨酸代谢;Glycerophospholipid metabolism:甘油磷脂代谢;Pyrimidine metabolism:嘧啶代谢。 横坐标表示每个通路对应的丰富因素,纵坐标为通路名称(按照P值排序)。点的颜色反映P值大小,越红表示富集越显著。点的大小代表富集到的差异代谢物的个数多少。P值越接近于0,表示富集越显著。The x-axis represents the rich factor corresponding to each pathway, and the y-axis represents the pathway name (sorted by P-value). The color of the points reflects the magnitude of the P-value, with redder points indicating more significant enrichment. The size of the points represents the number of differentially enriched metabolites. The closer the P-value is to 0, the more significant the enrichment. Fig.4 KEGG enrichment impact factor bubble chart for differential metabolites |
 京公网安备 11010802041926号


