

1 材料与方法
1.1 试验材料
1.2 试验设备
1.3 试验处理
1.4 响应面试验
1.5 体外仿生消化试验
1.6 测定指标及方法
1.7 数据统计与分析
2 结果与分析
2.1 单因素试验
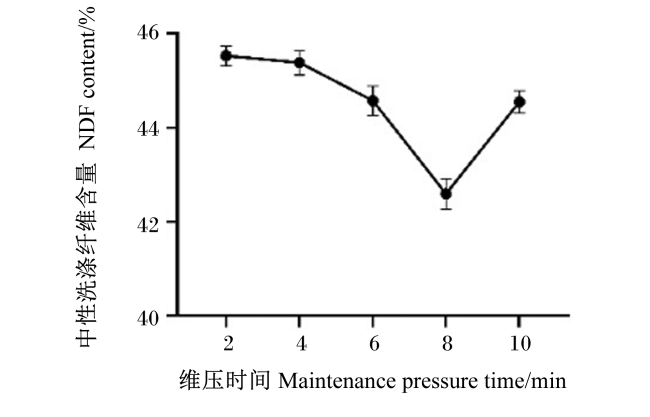
2.1.1 维压时间对白酒糟中NDF含量的影响
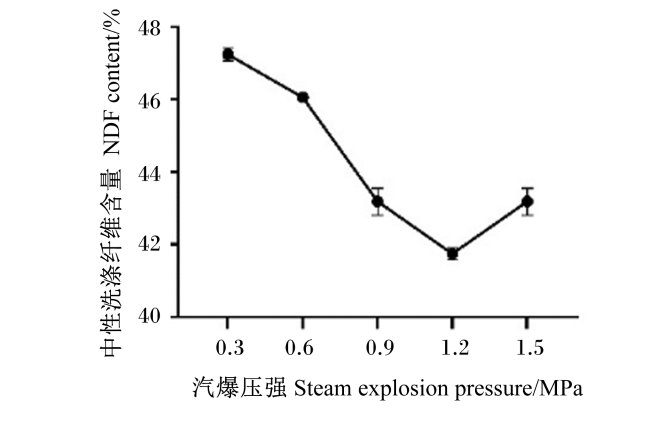
2.1.2 汽爆压强对白酒糟中NDF含量的影响
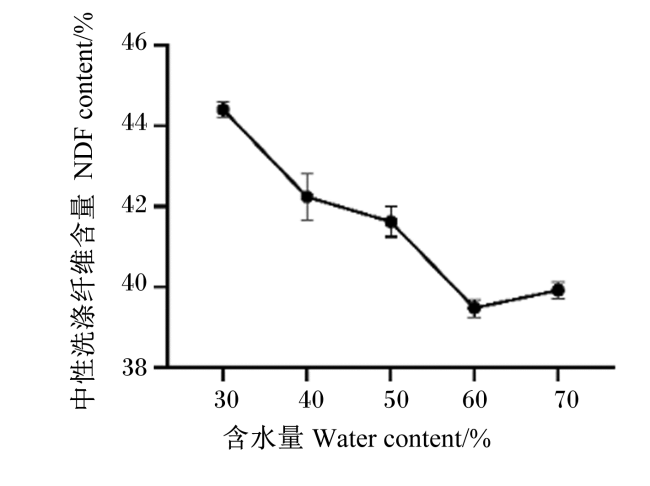
2.1.3 含水量对白酒糟中NDF含量的影响
2.2 响应面试验
2.2.1 响应面试验设计及结果分析
表1 试验因素水平编码表Table 1 Experimental factor and level coding table |
| 水平 Levels | 因素 Factors | ||
|---|---|---|---|
| 维压时间 Maintenance pressure time/min | 汽爆压强 Steam explosion pressure/MPa | 含水量 Water content/% | |
| -1 | 6 | 0.9 | 50 |
| 0 | 8 | 1.2 | 60 |
| 1 | 10 | 1.5 | 70 |
表2 响应面试验结果Table 2 Results of response surface test |
| 运行序 Run | 试验因素 Experimental factors | 响应值 Response value | |||
|---|---|---|---|---|---|
| 维压时间 Maintenance pressure time/min | 汽爆压强 Steam explosion pressure/MPa | 含水量 Water content/% | NDF含量 NDF content/% | ||
| 1 | 6 | 0.9 | 60 | 43.52 | |
| 2 | 10 | 0.9 | 60 | 44.17 | |
| 3 | 6 | 1.5 | 60 | 47.41 | |
| 4 | 10 | 1.5 | 60 | 48.36 | |
| 5 | 6 | 1.2 | 50 | 41.62 | |
| 6 | 10 | 1.2 | 50 | 42.59 | |
| 7 | 6 | 1.2 | 70 | 42.20 | |
| 8 | 10 | 1.2 | 70 | 44.17 | |
| 9 | 8 | 0.9 | 50 | 41.62 | |
| 10 | 8 | 1.5 | 50 | 44.86 | |
| 11 | 8 | 0.9 | 70 | 40.25 | |
| 12 | 8 | 1.5 | 70 | 47.24 | |
| 13 | 8 | 1.2 | 60 | 39.81 | |
| 14 | 8 | 1.2 | 60 | 39.85 | |
| 15 | 8 | 1.2 | 60 | 40.21 | |
| 16 | 8 | 1.2 | 60 | 39.78 | |
| 17 | 8 | 1.2 | 60 | 39.27 | |
表3 回归模型方差分析Table 3 Variance analysis of regression model |
| 变异源 Sources of variation | 平方和 Sum of squares | 自由度 df | 均方 Mean square | F值 F-value | P值 P-value | 显著性 Significance |
|---|---|---|---|---|---|---|
| 模型 Model | 134.57 | 9 | 14.95 | 73.80 | <0.000 1 | ** |
| A | 15.82 | 1 | 185.82 | 78.06 | <0.000 1 | ** |
| B | 20.28 | 1 | 20.28 | 100.11 | <0.000 1 | ** |
| C | 1.04 | 1 | 1.04 | 5.13 | 0.041 6 | * |
| AB | 0.02 | 1 | 0.02 | 0.11 | 0.748 7 | |
| AC | 0.25 | 1 | 0.25 | 1.23 | 0.303 3 | |
| BC | 3.52 | 1 | 3.52 | 17.35 | 0.004 2 | ** |
| A2 | 28.83 | 1 | 28.83 | 142.30 | <0.000 1 | ** |
| B2 | 50.53 | 1 | 50.53 | 249.39 | <0.000 1 | ** |
| C2 | 0.25 | 1 | 0.25 | 1.24 | 0.302 3 | |
| 残差 Residual | 1.42 | 7 | 0.20 | |||
| 失拟项 Omission item | 0.97 | 3 | 0.32 | 2.86 | 0.167 9 | |
| 误差 Error | 0.45 | 4 | 0.11 | |||
| 总和 Total | 135.99 | 16 | ||||
| R2=0.962 0 | =0.924 0 | CV=1.58% | ||||
A:维压时间;B:汽爆压强;C:含水量。“**”代表极显著(P<0.01);“*”代表显著(P<0.05)。R2表示决定系数, 表示校正决定系数,CV表示变异系数。 | |
A: maintenance pressure time; B: steam explosion pressure; C: water content. “**” indicates extremely significant (P<0.01), and “*” indicates significant (P<0.05). R2 is the coefficient of determination, is the adjusted coefficient of determination, and CV is the coefficient of variation. |
2.2.2 响应曲面图和等高线图分析
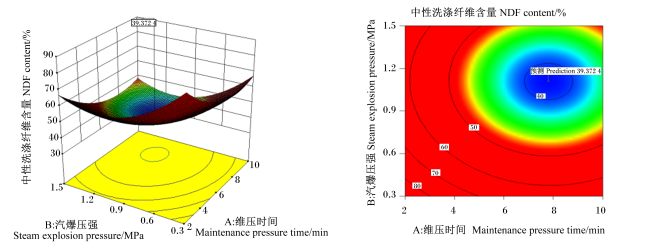
图4 维压时间与汽爆压强对白酒糟中NDF含量影响的三维响应曲面图及等高线图Fig.4 Three-dimensional response surface plot and contour plot of effects of maintenance pressure timeand steam explosion pressure on NDF content in distiller’s grains |
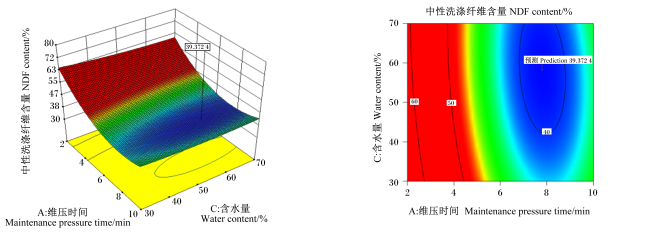
图5 维压时间与含水量对白酒糟中NDF含量影响的三维响应曲面图及等高线图Fig.5 Three-dimensional response surface plot and contour plot of effects of maintenance pressure time and water content on NDF content in distiller’s grains |
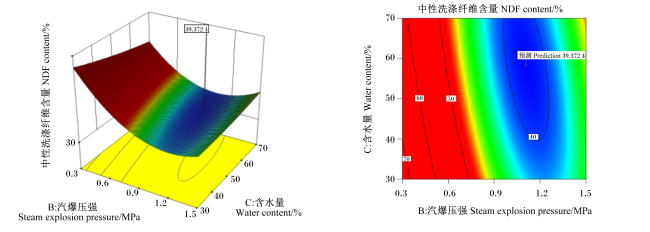
2.2.3 汽爆参数优化及模型验证
2.3 汽爆前后白酒糟化学成分及氨基酸含量变化
表4 汽爆前后白酒糟的化学成分含量(风干基础)Table 4 Chemical component contents of distiller’s grains before and after steam explosion (air-dry basis) |
| 项目 Items | 白酒糟 Distiller’s grains | P值 P-value | |
|---|---|---|---|
| 汽爆前 Before steam explosion | 汽爆后 After steam explosion | ||
| 干物质 DM/% | 90.38±0.07 | 90.40±0.15 | 0.054 |
| 粗蛋白质 CP/% | 14.56±0.27 | 14.50±0.41 | 0.830 |
| 粗脂肪 EE/% | 4.27±0.07 | 4.43±0.10 | 0.084 |
| 粗灰分 Ash/% | 9.93±0.02 | 9.94±0.01 | 0.680 |
| 中性洗涤纤维 NDF/% | 54.66±0.27A | 39.69±0.23B | <0.001 |
| 酸性洗涤纤维 ADF/% | 48.03±0.50A | 31.58±0.40B | <0.001 |
| 酸性洗涤木质素 ADL/% | 14.24±0.24A | 10.80±0.24B | <0.001 |
| 还原糖 Reducing sugar/% | 2.40±0.38B | 23.48±0.28A | <0.001 |
| 总能 GE/(MJ/kg) | 17.62±0.15 | 17.47±0.21 | 0.559 |
| 黄曲霉毒素B1 AFB1/(μg/kg) | 18.58±0.01A | 2.65±0.01B | <0.001 |
| 呕吐毒素 DON/(μg/kg) | 18.69±0.01A | 7.44±0.01B | <0.001 |
| 玉米赤霉烯酮 ZEN/(μg/kg) | 661.99±0.09A | 375.33±0.07B | <0.001 |
| 赭曲霉毒素 OTA/(μg/kg) | 19.89±0.03A | 8.89±0.01B | <0.001 |
同行数据肩标无字母表示差异不显著(P>0.05),不同小写字母表示差异显著(P<0.05),不同大写字母表示差异极显著(P<0.01)。下表同。 | |
In the same row, values with no letter superscripts mean no significant difference (P>0.05), while with different small letter superscripts mean significant difference (P<0.05), and with different capital letter superscripts mean significant difference (P<0.01). The same as below. |
表5 汽爆前后白酒糟中氨基酸组成及含量(风干基础)Table 5 Composition and contents of amino acids in distiller’s grains before and after steam explosion (air-dry basis)% |
| 项目 Items | 白酒糟 Distiller’s grains | P值 P-value | ||
|---|---|---|---|---|
| 汽爆前 Before steam explosion | 汽爆后 After steam explosion | |||
| 必需氨基酸 EAA | ||||
| 精氨酸 Arg | 0.32±0.00A | 0.17±0.01B | <0.001 | |
| 组氨酸 His | 0.21±0.00 | 0.19±0.01 | 0.240 | |
| 异亮氨酸 Ile | 0.41±0.01 | 0.43±0.03 | 0.345 | |
| 亮氨酸 Leu | 1.22±0.02 | 1.32±0.08 | 0.132 | |
| 赖氨酸 Lys | 0.25±0.00A | 0.16±0.01B | 0.002 | |
| 蛋氨酸 Met | 0.07±0.00a | 0.07±0.00b | 0.026 | |
| 苯丙氨酸 Phe | 0.53±0.01 | 0.53±0.03 | 0.980 | |
| 缬氨酸 Val | 0.53±0.01 | 0.52±0.02 | 0.255 | |
| 苏氨酸 Thr | 0.41±0.01 | 0.42±0.02 | 0.755 | |
| 非必需氨基酸 NEAA | ||||
| 胱氨酸 Cys | 0.04±0.00A | 0.02±0.00B | <0.001 | |
| 酪氨酸 Tyr | 0.28±0.00B | 0.32±0.02A | 0.009 | |
| 天冬氨酸 Asp | 0.58±0.00 | 0.28±0.02 | 0.057 | |
| 丝氨酸 Ser | 0.28±0.00 | 0.28±0.02 | 0.940 | |
| 谷氨酸 Glu | 1.73±0.03 | 1.88±0.01 | 0.110 | |
| 脯氨酸 Pro | 1.29±0.02 | 1.33±0.07 | 0.355 | |
| 甘氨酸 Gly | 1.03±0.01 | 1.11±0.07 | 0.122 | |
| 丙氨酸 Ala | 1.49±0.02 | 1.53±0.01 | 0.497 | |
| 总氨基酸 TAA | 10.62±0.14 | 10.58±0.38 | 0.883 | |
2.4 汽爆前后白酒糟中营养物质的体外消化率
表6 汽爆前后白酒糟中营养物质的体外消化率Table 6 In vitro digestibility of nutrients from distiller’ grains before and after steam explosion% |
| 项目 Items | 白酒糟 Distiller’s grains | P值 P-value | |
|---|---|---|---|
| 汽爆前 Before steam explosion | 汽爆后 After steam explosion | ||
| 体外干物质消化率 IVDMD | 30.50±0.17B | 35.51±0.17A | <0.001 |
| 体外总能消化率 IVGED | 46.72±0.26b | 47.48±0.18a | 0.035 |
| 体外粗蛋白质消化率 IVCPD | 24.08±0.14B | 25.89±0.09A | <0.001 |
2.5 汽爆前后白酒糟的扫描电镜分析
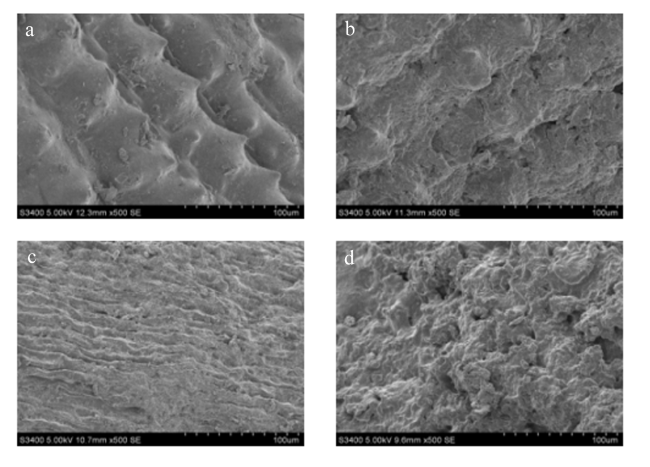
图7 白酒糟汽爆前后电镜图图a、b、c、d分别为稻壳、汽爆后稻壳、高粱和汽爆后高粱电镜图。 Fig.7 Electron microscope images of distiller’s grains before and after steam explosion (500×) Figures a, b, c, and d represent the scanning electron micro-graphs of rice husk, steam⁃exploded rice husk, sorghum, and steam⁃exploded sorghum, respectively. |
2.6 汽爆前后白酒糟的傅里叶红外光谱分析
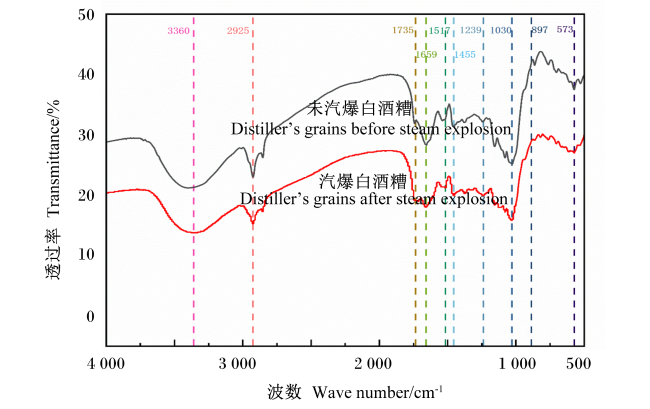
图8 汽爆前后白酒糟的傅里叶红外光谱图Fig.8 FTIR spectra of distiller’s grains before and after steam explosion |
表7 傅里叶红外光谱吸收峰分类Table 7 Classification of FTIR absorption peak |
| 吸收峰位置 Positions of absorption peak/cm-1 | 吸收峰分类 Classification of absorption peak |
|---|---|
| 3 360 | O-H伸缩振动 |
| 2 925 | C-H伸缩振动 |
| 1 735 | 酯基、羧基中的C=O伸缩振动 |
| 1 659 | -C=O伸缩振动(木质素) |
| 1 517 | 苯环伸缩振动(木质素) |
| 1 455 | CH剪切振动(纤维素),CH2弯曲振动(木质素) |
| 1 239 | 烷基芳基醚键中的C-O-C伸缩振动(木质素) |
| 1 030 | C-O-C伸缩振动(纤维素与半纤维素) |
| 897 | β-糖苷键特征峰 |
| 573 | β-糖苷键连接的吡喃式木糖单元 |
 京公网安备 11010802041926号


