

1 材料与方法
1.1 试验材料
1.2 试验动物
表1 基础饲粮组成及营养水平(干物质基础)Table 1 Composition and nutrient levels of the basal diet (DM basis)% |
| 项目Items | 含量Content | ||
|---|---|---|---|
| 原料Ingredients | |||
| 玉米青贮Corn silage | 24.53 | ||
| 苜蓿干草Alfalfa hay | 15.73 | ||
| 羊草Leymus chinensis | 10.20 | ||
| 豆粕Soybean meal | 12.32 | ||
| 玉米Corn | 14.21 | ||
| 压片玉米Flaked corn | 8.17 | ||
| 棉籽粕Cottonseed meal | 3.31 | ||
| 甜菜粕Beet meal | 4.81 | ||
| 干酒糟及其可溶物DDGS | 3.11 | ||
| 预混料Premix1) | 3.61 | ||
| 合计Total | 100.00 | ||
| 营养水平Nutrient levels2) | |||
| 干物质DM | 91.55 | ||
| 粗灰分Ash | 8.02 | ||
| 粗蛋白质CP | 17.36 | ||
| 粗脂肪EE | 4.56 | ||
| 产奶净能NEL/(MJ/kg) | 7.13 | ||
| 酸性洗涤纤维ADF | 18.50 | ||
| 项目Items | 含量Content | ||
| 中性洗涤纤维NDF | 31.34 | ||
| 钙Ca | 0.68 | ||
| 磷P | 0.41 |
1)每千克预混料含有One kg of premix contained the following:Cu 1 250 mg,Zn 4 900 mg,Mn 1 760 mg,I 50 mg,Se 61 mg,VA 240 000 IU,VD 338 000 IU,VE 1 000 IU。 2)产奶净能根据NRC(2001)计算得出,其他营养水平为实测值。NEL was calculated according to NRC (2001), while the other nutrient levels were measured values. |
1.3 样品的采集与测定
1.3.1 瘤胃干物质消化率的测定
1.3.2 瘤胃液的采集
1.3.3 瘤胃发酵参数测定
1.4 瘤胃代谢物的测定
1.4.1 样本处理
表2 色谱梯度洗脱程序Table 2 Gradient elution procedure of chromatography% |
| 时间 Time/min | 流动相A Mobile phase A | 流动相B Mobile phase B |
|---|---|---|
| 0 | 98 | 2 |
| 1.5 | 98 | 2 |
| 12.0 | 0 | 100 |
| 14.0 | 0 | 100 |
| 14.1 | 98 | 2 |
| 17.0 | 98 | 2 |
1.4.2 代谢物鉴定与定量
1.4.3 多元数据分析
1.4.4 差异代谢物筛选
1.5 层次聚类与KEGG富集分析
1.6 数据处理与分析
2 结果与分析
2.1 解淀粉芽孢杆菌对奶牛瘤胃干物质消化率的影响
表3 解淀粉芽孢杆菌对奶牛瘤胃干物质消化率的影响Table 3 Effects of Bacillus amylolyticus on rumen dry matter digestibility of dairy cows% |
| 时间 Time/h | 解淀粉芽孢杆菌添加水平 Addition level of Bacillus amyloliquefaciens/(CFU/d) | 均值标准误 SEM | P值 P-value | ||
|---|---|---|---|---|---|
| 0 | 5×10⁹ | 5×10¹⁰ | |||
| 2 | 62.12 | 62.28 | 62.60 | 0.21 | 0.139 |
| 6 | 64.38 | 64.87 | 65.35 | 0.26 | 0.068 |
| 12 | 68.87a | 69.18a | 70.67b | 0.18 | 0.020 |
| 24 | 72.78a | 74.07a | 77.15b | 0.58 | 0.034 |
| 36 | 80.80a | 87.15b | 91.52c | 0.25 | 0.001 |
| 48 | 78.18a | 83.70b | 88.53c | 0.44 | 0.004 |
| 72 | 76.82a | 77.32a | 80.58b | 0.31 | 0.011 |
同行数据肩标无字母或相同字母表示差异不显著(P>0.05),不同字母表示差异显著(P<0.05)。下表同。 | |
In the same row, values with no letter or the same letter superscripts mean no significant difference (P>0.05), while with different letter superscripts mean significant difference (P<0.05). The same as below. |
2.2 解淀粉芽孢杆菌对奶牛瘤胃发酵参数的影响
表4 解淀粉芽孢杆菌对奶牛瘤胃发酵参数的影响Table 4 Effects of Bacillus amylolyticus on rumen fermentation parameters of dairy cows |
| 时间 Time/h | 解淀粉芽孢杆菌添加水平 Addition level of Bacillus amyloliquefaciens/(CFU/d) | 均值标准误 SEM | P值 P-value | ||||||||
|---|---|---|---|---|---|---|---|---|---|---|---|
| 0 | 5×10⁹ | 5×10¹⁰ | |||||||||
| pH | 6.65 | 6.60 | 6.60 | 0.040 | 0.802 | ||||||
| 总挥发性脂肪酸TVFA/(mmol/L) | 91.50a | 107.44b | 92.81a | 2.175 | 0.001 | ||||||
| 氨态氮NH3-N/(mg/dL) | 15.84 | 16.19 | 16.63 | 0.285 | 0.542 | ||||||
| 乙酸Acetic acid/(mmol/L) | 60.81 | 64.42 | 59.64 | 1.771 | 0.561 | ||||||
| 丙酸Propionic acid/(mmol/L) | 21.42 | 25.77 | 25.56 | 1.081 | 0.171 | ||||||
| 异丁酸Isobutyric acid/(mmol/L) | 1.55a | 2.23c | 1.86b | 0.074 | 0.001 | ||||||
| 丁酸Butyric acid/(mmol/L) | 6.72a | 8.08b | 7.29ab | 0.223 | 0.031 | ||||||
| 异戊酸Isovaleric acid/(mmol/L) | 1.34a | 2.00b | 1.77b | 0.078 | 0.001 | ||||||
| 戊酸Valeric acid/(mmol/L) | 0.44a | 0.58b | 0.52ab | 0.019 | 0.007 | ||||||
| 时间 Time/h | 解淀粉芽孢杆菌添加水平 Addition level of Bacillus amyloliquefaciens/(CFU/d) | 均值标准误 SEM | P值 P-value | ||||||||
| 0 | 5×10⁹ | 5×10¹⁰ | |||||||||
| 乙酸/丙酸Acetic acid/propionic acid | 2.85b | 2.55ab | 2.36a | 0.021 | 0.001 | ||||||
| 微生物蛋白MCP/(mg/mL) | 44.45a | 70.33b | 63.58ab | 4.357 | 0.030 | ||||||
2.3 解淀粉芽孢杆菌对奶牛瘤胃代谢物的影响
2.3.1 奶牛瘤胃代谢物的PCA
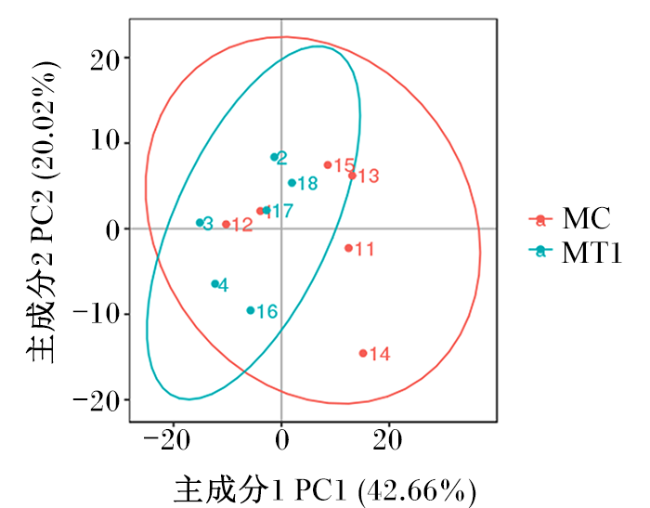
2.3.2 奶牛瘤胃代谢物的PLS-DA
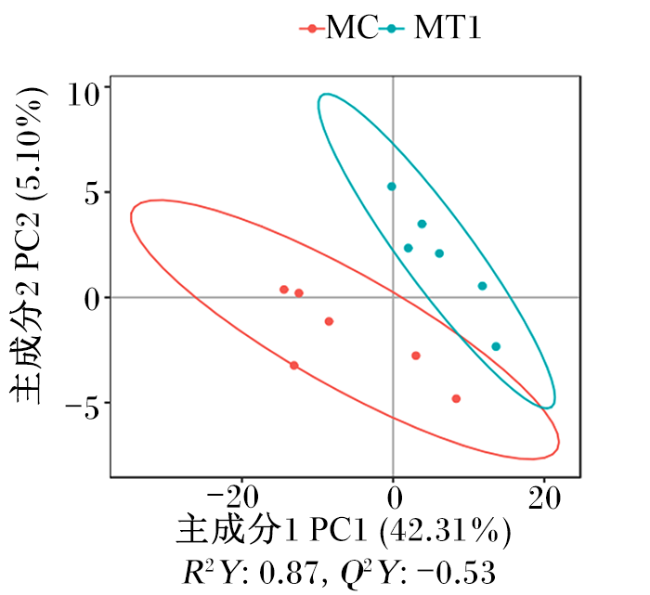
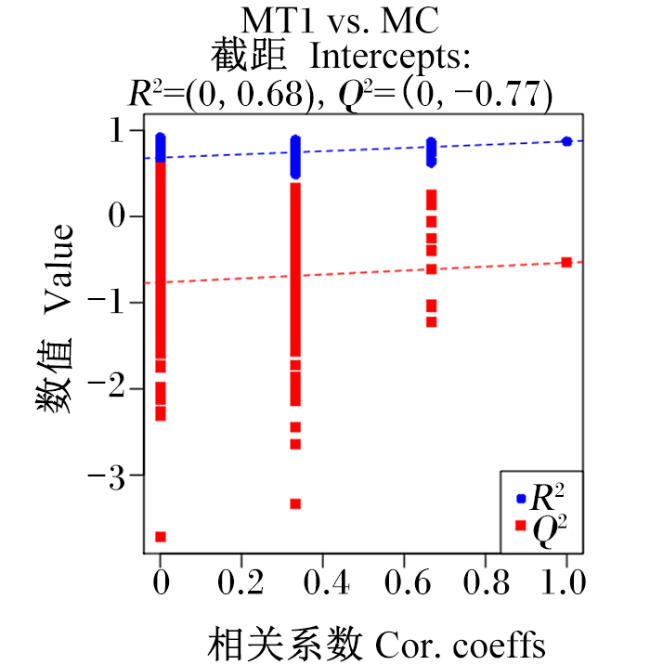
2.3.3 差异代谢物的筛选及鉴定
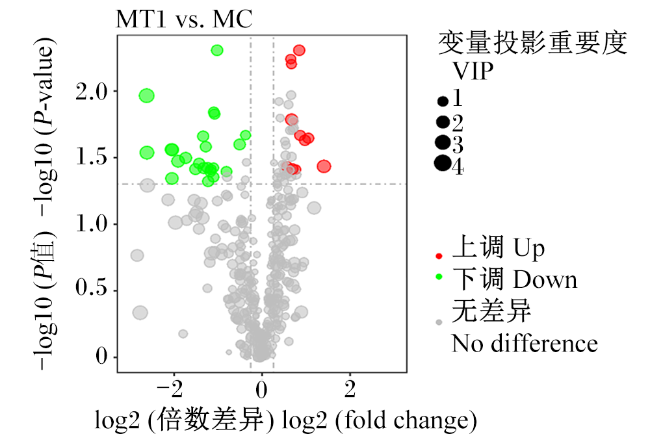
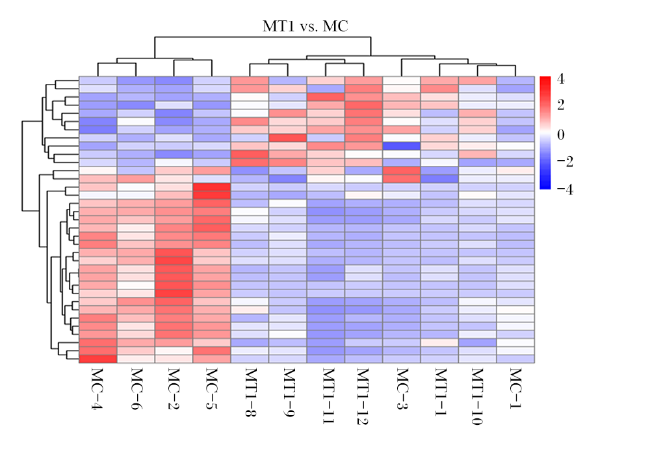
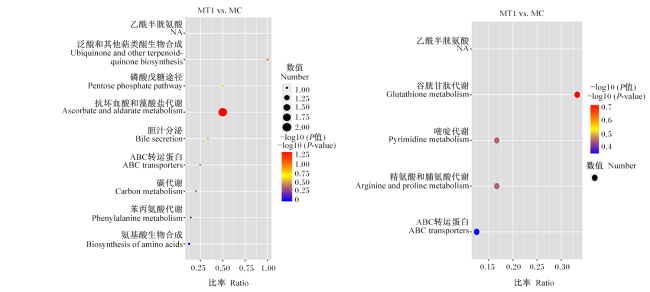


图6 KEGG通路富集分析结果左图为正离子模式KEGG富集通路,右图为负离子模式KEGG富集通路。图中圆点颜色深浅表示P值的大小,圆点面积大小表示参与该通路差异代谢物的多少。 Fig.6 KEGG pathway enrichment analysis results Left figure showed the positive ion mode KEGG enrichment pathways, and right figure showed the negative ion mode KEGG enrichment pathways. The color of the dots in the figure indicated the size of the P-value, and the aera of the dots indicated the number of differential metabolites involved in this pathway. |
表5 11条主要代谢通路对应的差异代谢物Table 5 Differential metabolites corresponding to 11 main metabolic pathways |
| 通路名称 Path names | 差异代谢物 Differential metabolites | P值 P-value |
|---|---|---|
| 谷胱甘肽代谢Glutathione metabolism | L-焦谷氨酸↓ | 0.193 |
| 嘧啶代谢Pyrimidine metabolism | 胸苷↑ | 0.357 |
| 精氨酸和脯氨酸代谢Arginine and proline metabolism | 章鱼碱↓ | 0.357 |
| ABC转运蛋白ABC transporters | D-蛋氨酸↓ | 0.451 |
| 抗坏血酸和藻酸盐代谢Ascorbate and aldarate metabolism | L-葡萄糖酸盐↑、抗坏血酸↑、丙酮酸↑ | 0.046 |
| 泛醌和其他萜类醌生物合成 Ubiquinone and other terpenoid-quinone biosynthesis | 反式肉桂酸↓ | 0.100 |
| 磷酸戊糖途径Pentose phosphate pathway | D-七庚糖7-磷酸↑ | 0.192 |
| 胆汁分泌Bile secretion | 脱氧胆酸↑ | 0.275 |
| 碳代谢Carbon metabolism | D-七庚糖7-磷酸↑ | 0.421 |
| 苯丙氨酸代谢Phenylalanine metabolism | 反式肉桂酸↓ | 0.541 |
| 氨基酸生物合成Biosynthesis of amino acids | D-七庚糖7-磷酸↑ | 1.000 |
↓表示MT1组中含量下降;↑表示MT1组中含量上升。 | |
↓ indicated that the content in the MT1 group decreased; ↑ indicated that the content in the MT1 group increased. |