

苜蓿(Medicago sativa L.)是多年生豆科牧草,具有适应性强和营养丰富等特点,其蛋白质含量高,素有“牧草之王”的美誉。生物胁迫和非生物胁迫与苜蓿的生长发育密切相关,而盐胁迫是影响苜蓿产量和营养品质的主要非生物胁迫因素[1-2]。联合国粮食及农业组织报告指出全球盐碱地面积约为9.55×10⁹ hm2,而我国盐碱地面积总计9.91×10⁸ hm2,主要分布在我国东北、华北及滨海等地[3]。种植苜蓿不仅能改良土壤盐渍化,还能提高土壤肥力,缓解我国优质牧草饲料短缺和人畜争粮的问题[4⇓-6]。因此,在盐碱地种植苜蓿是盐渍化土壤改良、畜牧业健康发展和保障粮食安全的必然趋势和重要研究方向。
苜蓿因较高的营养品质被广泛应用于畜牧业,其中青贮是雨季等限制性环境下苜蓿贮藏利用的主要方式之一[7-8]。青贮调制的机理是利用以乳酸菌为主的微生物发酵,通过其生命代谢活动产生有机酸,使青贮饲料得以保存[9-10],但青贮发酵是多种微生物共同作用的过程,微生物的种类和数量直接影响青贮品质[11]。目前,盐碱地苜蓿微生物群落研究还鲜有报道。盐胁迫最直观的体现是通过抑制光合作用和呼吸作用影响苜蓿产量[1,12]。以氯化钠(NaCl)进行盐胁迫发现低浓度盐胁迫对苜蓿生长无显著影响,而随着盐含量增加苜蓿生长才会受到抑制,盐含量达到400 mmol/L时苜蓿的生长发育基本停止[13]。此外,也有研究发现轻度盐胁迫与中、高度盐胁迫相比能够提高苜蓿产量,甚至优于无盐胁迫处理[14]。目前,有关苜蓿种子盐胁迫萌发条件的筛选、耐盐基因的筛选与表达、盐胁迫对苜蓿生长发育的影响已进行了诸多研究。也有研究发现,在盐碱环境下,植物内生真菌与植物生长和内分泌密切相关[15],例如,经假单胞菌处理后能增加植物体内脯氨酸含量,增强植物抗氧化应激能力[16]。但盐胁迫对苜蓿营养品质和微生物群落结构影响的研究还存在空白。因此,本试验拟开展盐胁迫对苜蓿营养品质及其附着微生物群落结构影响的研究,从营养物质组成和微生物群落角度探讨苜蓿适应盐胁迫的规律,为盐渍化地区苜蓿种植和青贮利用提供理论依据和技术支撑。
1 材料与方法
1.1 试验地概况
试验地位于包头市鑫泰农业试验基地,地处内蒙古包头市九原区哈林格尔镇,位于黄河“几字弯”,东经110°27″~110°37″,北纬40°05″~40°17″,属典型盐渍化区域,该区域土壤盐含量呈梯度分布(<1‰、1‰~2‰、2‰~3‰和3‰~4‰)。盐含量大于1‰的土壤pH为8.44~8.73,无明显差异。试验区气候为北温带大陆气候,雨热同期,年平均气温为6.8 ℃,年平均降雨量约为330 mm,多集中在6~9月。
1.2 试验材料与试验设计
本研究以“中苜3号”苜蓿为试验材料,苜蓿种子由中国农业科学院北京畜牧兽医研究所提供。紫花苜蓿于2020年5月播种,播种方式为条播,行距10 cm。试验地盐含量分别为<1‰(无盐胁迫,CK处理)、1‰~2‰(轻度盐胁迫,LS处理)、2‰~3‰(中度盐胁迫,MS处理)和3‰~4‰(重度盐胁迫,HS处理)。每个盐胁迫处理设置3个小区,每个小区面积为30 m2(5 m×6 m)。所用试验材料为2021年第1茬初花期刈割苜蓿,来源于不同盐含量试验地,留茬高度为5~8 cm。
1.3 测定指标及方法
1.3.1 营养指标测定
新鲜苜蓿刈割后取样品500 g于105 ℃杀青15 min,在65 ℃下烘至恒重,计算干物质(dry matter,DM)含量,粉碎后保存备测。粗蛋白质(crude protein,CP)含量使用杜马斯燃烧法测定[17]。中性洗涤纤维(neutral detergent fiber,NDF)和酸性洗涤纤维(acid detergent fiber,ADF)含量使用Van Soest等[18]的方法测定。可溶性碳水化合物(water-soluble carbohydrates,WSC)含量使用蒽酮-硫酸比色法[19]测定。可溶性蛋白质(soluble protein,SP)含量采用三氯乙酸法[20]进行测定。采用GB/T 18246—2000《饲料中氨基酸的测定》方法测定脯氨酸和谷氨酸含量。
1.3.2 微生物多样性分析
取5 g苜蓿样品与45 mL无菌蒸馏水于拍打袋,无菌匀质器12次/s拍打2 min,转移至无菌50 mL离心管,每个样品3个重复,-80 ℃保存备用。根据 E.Z.N.A.® soil DNA kit说明书进行微生物群落总DNA提取。使用1%的琼脂糖凝胶电泳检测提取的DNA的质量,使用NanoDrop 2000测定DNA浓度和纯度。对16S rRNA基因V3~V4可变区进行PCR扩增,扩增产物4 ℃保存。使用引物338F(5'-ACTCCTACGGGAGGCAGCAG-3')和806R (5'-GGACTACHVGG GTWTCTAAT-3')对16S rRNA基因V3~V4可变区进行PCR扩增,PCR扩增引物由上海美吉生物医药科技有限公司合成。PCR反应体系包括:5×TransStartFastPfu缓冲液4 μL,2.5 mmol/L dNTPs 2 μL,上游引物(5 μmol/L) 0.8 μL,下游引物(5 μmol/L) 0.8 μL,TransStartFastPfu DNA聚合酶0.4 μL,模板DNA 10 ng,超纯水补足至20 μL。每个样本3个重复。PCR扩增程序为:95 ℃预变性3 min,95 ℃变性30 s,55 ℃退火30 s,72 ℃延伸30 s,72 ℃稳定延伸10 min,27个循环。使用2%琼脂糖凝胶回收PCR产物,并用AxyPrep DNA Gel Extraction Kit进行纯化。使用2%琼脂糖凝胶电泳进行检测,并用QuantusTM Fluorometer对回收产物进行检测定量。使用NEXTFLEX® Rapid DNA-Seq Kit进行建库,利用Illumina公司的MiSeq PE300平台进行测序。
1.4 数据处理与分析
使用Fastq对原始测序序列进行质控,并使用Flash进行拼接;使用Uparse以97%的相似度阈值对序列进行操作分类单元(OTU)聚类,同时剔除嵌合体;基于Silva 16S rRNA数据库(v138),利用RDP对OTU代表序列进行物种分类学注释并得到结果;通过距离量化分析样本间群落结构差异,计算样本间距离获得距离矩阵,使用主坐标分析(PCoA)结合ANOSIM进行组间差异检验,评估群落结构的差异性;基于物种注释结果,使用韦恩图对各处理中微生物物种组成进行解析,单因素方差分析获得优势微生物组成信息;使用R version 3.6.3对盐胁迫、微生物及营养指标进行斯皮尔曼相关性计算,并绘制相关性热图。使用Excel 2007对试验数据进行初步整理和前期处理。使用SigmaPlot 12.5进行相关图表的绘制。使用Adobe Illustrator CS6进行相关图片的整理。使用SAS 9.0进行方差分析。
2 结果与分析
2.1 盐胁迫对苜蓿营养物质组成的影响
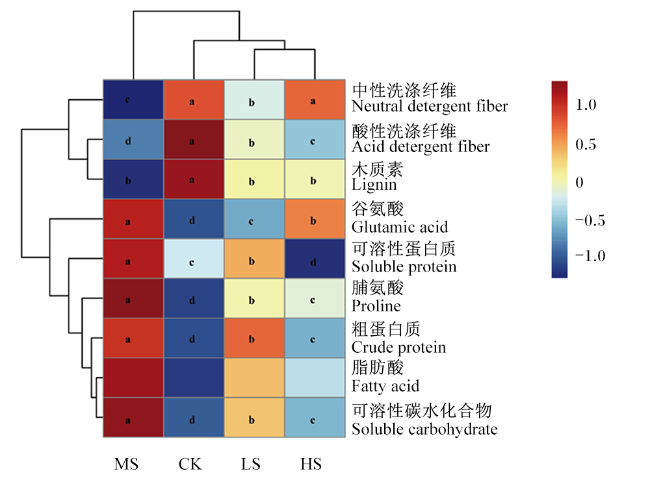
苜蓿营养物质组成在盐胁迫下表现出复杂的变化规律。从图1 可以看出,根据盐含量聚类分析出现了3种聚类方式,即CK、LS处理和HS、MS处理;按营养物质划分为2类,即纤维类和其他类营养物质。MS处理酸性洗涤纤维和中性洗涤纤维含量显著低于其他处理(P<0.05);MS处理木质素含量显著低于CK处理(P<0.05),与LS和HS处理无显著差异(P>0.05)。MS处理谷氨酸、脯氨酸、可溶性蛋白质、粗蛋白质和可溶性碳水化合物含量与其他处理相比显著增加(P<0.05),且均以CK处理最低。各处理脂肪酸含量无显著差异(P>0.05)。
2.2 盐胁迫苜蓿微生物群落多样性分析
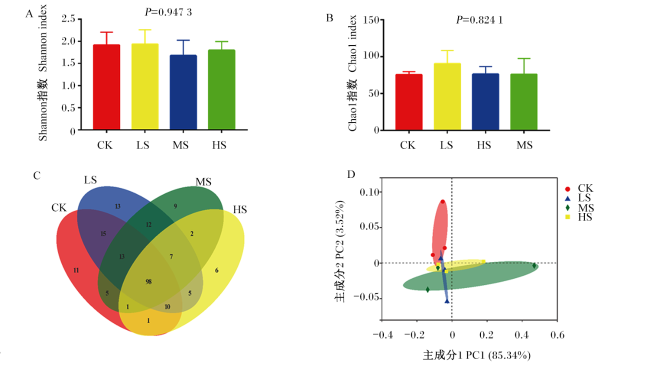
盐胁迫下苜蓿表面附着的微生物群落多样性如图2 所示。所有处理的微生物群落多样性指数(Shannon指数,图2 -A)和丰富度指数(Chao1指数,图2 -B)均无显著差异(P>0.05)。韦恩图(图2 -C)显示CK、LS、MS和HS处理共有的OTU有98个,特有的OTU数分别为11、13、9和6个,表明不同程度盐胁迫改变了苜蓿表面附着的微生物群落结构。为深入研究各处理微生物群落的差异进行PCoA,PCoA图显示盐胁迫未完全改变其微生物群落结构。
2.3 盐胁迫微生物群落组成分析
物种分类信息的差异说明了微生物群落结构的变化对盐胁迫的响应。由表1 可知,在门水平上,主要为变形菌门(Proteobacteria)、放线菌门(Actinobacteria)、厚壁菌门(Firmicutes)和拟杆菌门(Bacteroidetes)。变形菌门为所有处理中的优势菌门,相对丰度均超过了80%,其次是放线菌门、厚壁菌门和拟杆菌门,有趣的是厚壁菌门的相对丰度在MS和HS处理增加。在属水平上,泛菌属(Pantoea)、假单胞菌属(Pseudomonas)、鞘脂单胞菌属(Sphingomonas)、甲基杆菌属(Methylobacterium)、根瘤菌属(Rhizobium)和肠杆菌属(Enterobacter)为优势菌属。甲基杆菌属和根瘤菌属随着盐含量的增加呈下降趋势,MS和HS处理中甲基杆菌属和根瘤菌属的相对丰度显著低于CK处理(P<0.05)。厚壁菌门和拟杆菌门中的优势菌属虽然发生了变化,但各处理间无显著差异(P>0.05)。
表1 盐胁迫下苜蓿微生物群落组成Table 1 Microbial community composition of alfalfa at salt stress% |
| 门水平 Phylum level | 属水平 Genus level | 处理Treatments | SEM | P值 P-value | |||||||||||
|---|---|---|---|---|---|---|---|---|---|---|---|---|---|---|---|
| CK | LS | MS | HS | ||||||||||||
| 变形菌门Proteobacteria | 92.91 | 91.00 | 84.48 | 85.44 | |||||||||||
| 泛菌属Pantoea | 47.47 | 56.11 | 48.99 | 47.17 | 4.02 | 0.884 1 | |||||||||
| 假单胞菌属Pseudomonas | 10.58 | 14.93 | 18.11 | 19.88 | 2.53 | 0.648 7 | |||||||||
| 鞘脂单胞菌属Sphingomonas | 9.32 | 7.99 | 6.27 | 5.69 | 0.75 | 0.335 1 | |||||||||
| 甲基杆菌属Methylobacterium | 7.87a | 5.38ab | 3.41bc | 1.75c | 0.78 | 0.005 6 | |||||||||
| 根瘤菌属Rhizobium | 4.92a | 1.33b | 0.48b | 1.41b | 0.54 | 0.000 1 | |||||||||
| 肠杆菌属Enterobacter | 4.05 | 0.43 | 1.08 | 1.19 | 0.61 | 0.147 0 | |||||||||
| 马赛菌属Massilia | 0.52 | 1.46 | 2.04 | 1.94 | 0.40 | 0.587 7 | |||||||||
| 阿尔塔米拉金色单胞菌属Aureimonas | 1.54a | 0.42b | 0.29b | 0.30b | 0.17 | 0.000 7 | |||||||||
| 寡养单胞菌属Stenotrophomonas | 0.37 | 0.59 | 0.19 | 1.07 | 0.17 | 0.334 0 | |||||||||
| 未识别变形菌门 Unclassified_p_Proteobacteria | 1.53a | 0.17b | 0.20b | 0.10b | 0.20 | 0.004 0 | |||||||||
| 丛毛单胞菌属Comamonas | 0.54 | 0.21 | 0.76 | 0.08 | 0.17 | 0.514 7 | |||||||||
| 普罗威登斯菌属Providencia | 0.03 | 0.10 | 0.73 | 0.06 | 0.16 | 0.409 9 | |||||||||
| 未识别草酸杆菌科 Unclassified_f_Oxalobacteraceae | 0.11 | 0.02 | 0.40 | 0.09 | 0.09 | 0.489 1 | |||||||||
| 代尔夫特菌属Delftia | 0.03 | 0.03 | 0.38 | 0.03 | 0.09 | 0.426 7 | |||||||||
| 门水平 Phylum level | 属水平 Genus level | 处理Treatments | SEM | P值 P-value | |||||||||||
| CK | LS | MS | HS | ||||||||||||
| 拟杆菌门Bacteroidetes | 0.39 | 0.67 | 10.59 | 6.12 | |||||||||||
| 金黄色杆菌属Chryseobacterium | 0.23 | 0.12 | 9.27 | 0.03 | 2.29 | 0.442 8 | |||||||||
| 网络鞘氨醇杆菌属Sphingobacterium | 0.06 | 0.27 | 1.28 | 2.65 | 0.47 | 0.187 2 | |||||||||
| 黄杆菌属Flavobacterium | 0.05 | 0.17 | 0.03 | 3.29 | 0.79 | 0.419 5 | |||||||||
| 厚壁菌门Firmicutes | 0.74 | 1.84 | 0.61 | 3.02 | |||||||||||
| 微小杆菌属Exiguobacterium | 0.57 | 1.07 | 0.09 | 1.26 | 0.28 | 0.495 3 | |||||||||
| 芽孢杆菌属Bacillus | 0.01 | 0.18 | 0.03 | 1.34 | 0.31 | 0.411 3 | |||||||||
| 放线菌门Actinobacteria | 5.94 | 6.47 | 4.30 | 5.34 | |||||||||||
| 短小杆菌属Curtobacterium | 1.35b | 3.22a | 1.97ab | 1.36b | 0.32 | 0.007 9 | |||||||||
| 微杆菌属Microbacterium | 1.87 | 0.96 | 0.95 | 1.97 | 0.24 | 0.255 1 | |||||||||
| 其他Others | 其他Others | 6.96a | 4.80ab | 2.74b | 4.97ab | 0.53 | 0.013 3 | ||||||||
同行数据肩标不同小写字母表示0.05水平差异显著(P<0.05)。 | |
Values in the same row with different lowercase letters indicate significant difference at 0.05 level (P<0.05). |
2.4 盐胁迫苜蓿附着微生物群落功能分析
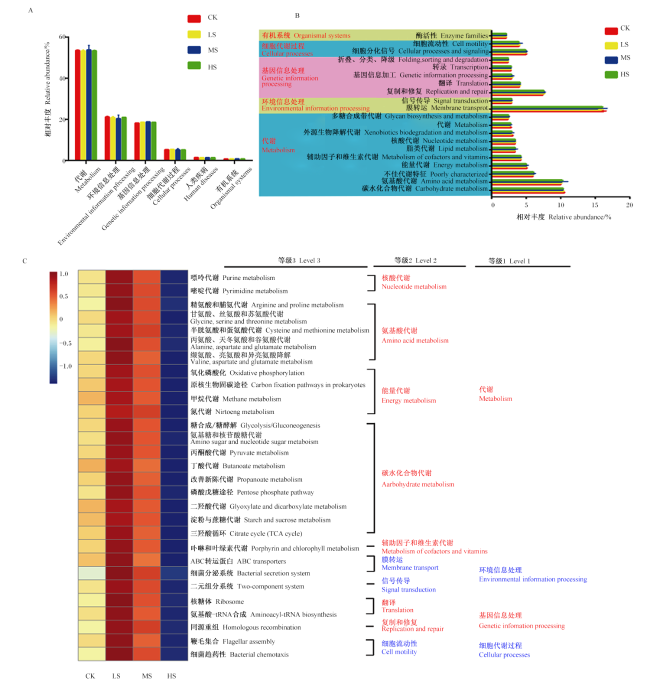
基于KEGG的微生物群落结构变化进行PICRUSt功能预测分析,结果如图3 所示。在等级1水平代谢功能分为6类,包括代谢、环境信息处理、基因信息处理、细胞代谢过程、人类疾病和有机系统(图3 -A)。在此基础上对功能进行细化,如图3 -B所示,代谢主要富集在碳水化合物代谢和氨基酸代谢,环境信息处理集中在膜转运,基因信息处理集中在复制和修复。为深入了解微生物参与的代谢功能,在等级2水平上继续细化,在等级3水平上排名前30的代谢功能如图3 -C所示,代谢主要富集在核酸代谢、氨基酸代谢、能量代谢和碳水化合物代谢。排名前30的代谢功能所占代谢途径达22条,碳水化合物代谢仍是代谢的主要方式。从图3 -C中可以发现,代谢能力从CK处理到LS处理呈升高的趋势,随着盐含量继续增加,代谢能力呈现持续下降的变化趋势,在轻度盐胁迫(LS处理)时代谢能力达到峰值。
2.5 盐胁迫苜蓿附着微生物与多重营养指标关联分析
盐胁迫与微生物组成密切相关,关联分析显示盐含量与鞘脂单胞菌属的相对丰度呈显著正相关关系(P<0.05),与甲基杆菌属、阿尔塔米拉金色单胞菌属、丛毛单胞菌属和金黄色杆菌属的相对丰度呈显著负相关关系(P<0.001,P<0.01)(图4 -A)。
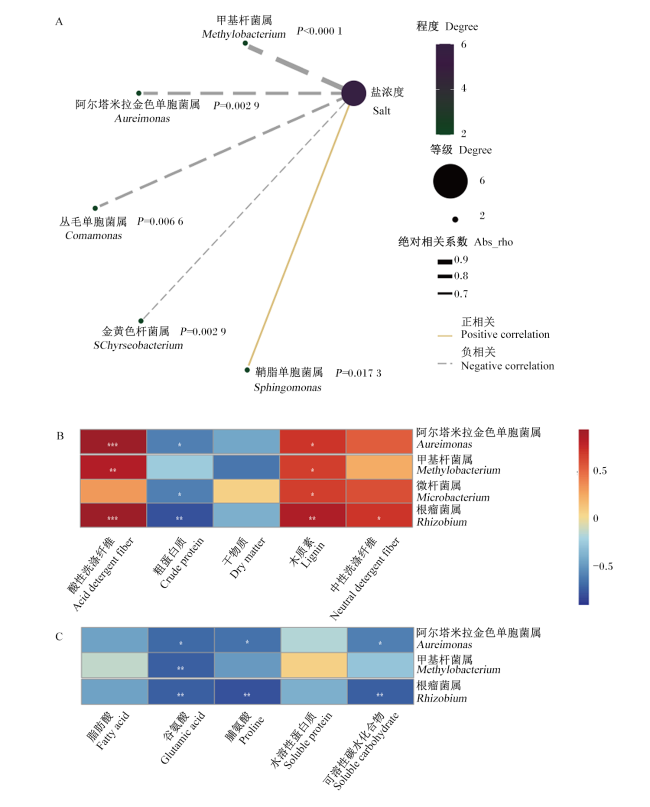


图4 盐胁迫下关联分析A:盐胁迫和前25个微生物属的相关性;B:前25个微生物属与常规营养物质的相关性;C:前25个微生物属与非常规营养物质的相关性。图中只显示存在显著相关性的微生物属。*:P<0.05;**:P<0.01;***:P<0.001。 Fig.4 Correlation analysis at salt stress A: correlation between salt stress and microbial genus (top 25); B: correlation between microbial genus (top 25) and conventional nutritive substances; C: correlation between microbial genus (top 25) and unconventional nutritive substances. Only with significant difference of the genera were noted. *: P<0.05; **: P<0.01; ***: P<0.001. |
微生物群落结构与营养品质的形成密切相关[21],本试验基于斯皮尔曼相关性分析揭示了盐胁迫下主要微生物属的相对丰度(前25)与营养物质含量的相关关系。常规营养物质含量与微生物属相对丰度的相关关系如图4 -B所示(图中只显示存在显著相关性的微生物属),阿尔塔米拉金色单胞菌属、甲基杆菌属、微杆菌属和根瘤菌属的相对丰度均与干物质含量无显著相关关系(P>0.05);阿尔塔米拉金色单胞菌属的相对丰度与酸性洗涤纤维和木质素含量呈显著正相关关系(P<0.001,P<0.05),与粗蛋白质含量呈显著负相关关系(P<0.05);甲基杆菌属的相对丰度只与酸性洗涤纤维和木质素含量呈显著正相关关系(P<0.01,P<0.05);而微杆菌属的相对丰度与木质素含量呈显著正相关关系(P<0.05),与粗蛋白质含量呈显著负相关关系(P<0.05);根瘤菌属的相对丰度与酸性洗涤纤维、木质素和中性洗涤纤维含量呈显著正相关关系(P<0.001,P<0.01,P<0.05),与粗蛋白质含量呈显著负相关关系(P<0.01)。
对非常规营养物质含量进行的关联分析发现,与非常规营养物质含量存在显著相关性的微生物属也是阿尔塔米拉金色单胞菌属、甲基杆菌属和根瘤菌属(图4 -C)。阿尔塔米拉金色单胞菌属的相对丰度与谷氨酸、脯氨酸和可溶性碳水化合物含量存在显著负相关关系(P<0.05);根瘤菌属的相对丰度与谷氨酸、脯氨酸和可溶性碳水化合物含量存在显著负相关关系(P<0.01);甲基杆菌属的相对丰度和谷氨酸含量存在显著负相关关系(P<0.01)。
3 讨论
植物光合作用与其生长发育紧密相关,而盐胁迫会限制光合作用直接影响其生长发育[12]。盐胁迫的增强使土壤水势下降,导致植物生理干旱,引起渗透胁迫[22]。植物为应对盐胁迫引起的渗透胁迫做出防御,体内脯氨酸和可溶性碳水化合物的含量增加[23],降低植物体内束缚水和自由水的比例,保证体内水分的转运[24]。此外,脯氨酸和谷氨酸含量的增加有利于缓解植物的氧化应激,增强对盐胁迫环境的适应能力[25-26]。氨基酸的增加促进了蛋白质和可溶性蛋白质的积累,但盐胁迫超过植物可以承受的阈值时则会出现负效应。因此,在本研究中,随着盐含量的增加,脯氨酸、谷氨酸、可溶性碳水化合物、蛋白质和可溶性蛋白质的含量呈梯度变化,且在中度盐胁迫下达到最大值。有研究发现,苜蓿中纤维类物质含量与盐胁迫没有显著相关性[27]。本研究与上述研究结果存在差异,盐胁迫与纤维类物质(酸性洗涤纤维、中性洗涤纤维和木质素)含量密切相关。盐胁迫限制光合作用影响糖类物质合成进而影响细胞的分化和细胞壁组成可能是导致该结果的原因之一。
微生物群落结构的组成与宿主生长发育、健康状况和免疫防御密切相关。在本研究中,在不同盐胁迫条件下微生物群落的多样性和丰富度均无显著差异,且韦恩图显示共有的和特有的OTU变化较小,PCoA表明盐胁迫未完全改变其微生物群落结构。为深入了解微生物群落结构和组成的变化,本研究在门水平和属水平对主要微生物群落组成进行了分析。变形菌门是苜蓿中最主要的菌门,所有处理该菌门的相对丰度均超过了80%,其次是厚壁菌门、拟杆菌门和放线菌门。在属水平上各种微生物属所占比例虽然发生了变化,但起主导作用的微生物属,如泛菌属和假单胞菌属,在不同盐胁迫条件下微生物群落的多样性和丰富度无显著差异。本研究结果显示,随着盐含量的增加,甲基杆菌属和根瘤菌属的相对丰度呈降低趋势,这可能是由于甲基杆菌属对盐胁迫敏感[28-29],且盐胁迫能够抑制根瘤菌属的生命代谢活动[30]。
微生物群落结构的变化常导致其代谢功能发生改变。在等级1水平的主要代谢功能是代谢、环境信息处理和基因信息处理。代谢功能在等级2水平主要表现在碳水化合物代谢和氨基酸代谢,碳水化合物代谢和氨基酸代谢所对应的代谢通路在等级3水平上表现出明显的差异,进一步表明蛋白质、氨基酸、可溶性碳水化合物和纤维类物质的差异。另外,环境信息处理主要集中在膜转运所对应的代谢通路,可能影响细胞壁的合成,导致纤维类物质出现差异。脂肪酸能够有效抵御非生物胁迫对植物带来的不良影响[31],而本研究中脂肪酸含量在不同程度盐胁迫下均无显著差异,微生物群落功能的变化未导致脂肪酸相关代谢出现变化可能是导致该结果的主要原因。在上述基础上对主要营养物质和差异微生物进行了关联分析,发现差异微生物与营养品质密切相关。甲基杆菌属和根瘤菌属的相对丰度与纤维类物质含量表现出强正相关关系,但还未见甲基杆菌属和根瘤菌属与纤维类物质互作的报道。根瘤菌属的相对丰度与谷氨酸、脯氨酸和粗蛋白质含量呈显著负相关关系,根瘤菌可利用周围氮素进行固氮,促进自身生长繁殖[32],这可能是导致该结果的主要原因。
4 结论
本研究将苜蓿常规营养指标与高通量测序技术相结合探讨盐胁迫对苜蓿营养品质及其附着微生物群落结构的影响,发现盐胁迫未完全改变苜蓿的营养品质和附着的微生物群落结构;盐胁迫与鞘脂单胞菌属的相对丰度呈显著正相关关系,与甲基杆菌属的相对丰度呈显著负相关关系;中度盐胁迫(盐含量2‰~3‰)能够提高苜蓿营养品质,改善附着的微生物群落中拟杆菌门和厚壁菌门的相对丰度。