RESEARCH PAPER

Effects of Low Protein Diets on Growth Performance and Intestinal and Liver Health of Juvenile Triploid Crucian Carp

  • XI Qingkai , 1 ,
  • XU Hangzhong 2 ,
  • FENG Qifeng 2 ,
  • LIU Jiayu 3 ,
  • ZHAO Min 3 ,
  • CHEN Jianbin 2 ,
  • LI Hong 4 ,
  • ZHAI Xuliang 4 ,
  • XUE Yang 4 ,
  • LIU Tianji 5 ,
  • LIU Cong 5 ,
  • GU Xizhang 3 ,
  • LI Hongqin , 3, ** ,
  • LUO Li , 2, **
Expand
  • 1 New Hope Liuhe Group Co., Ltd., Beijing 100102, China
  • 2 Key Laboratory of Freshwater Reproduction and Development, Ministry of Education, Key Laboratory of Aquatic Science of Chongqing, College of Fisheries, Southwest University, Chongqing 400715, China
  • 3 Sheyang Liuhe Feed Co., Ltd., Jiangsu Aquatic Biological Environmental Protection Feed Engineering Research Center, Yancheng 224000, China
  • 4 Chongqing Fishery Technology Promotion Station, Chongqing 400400, China
  • 5 Shandong New Hope Liuhe Group Co. Ltd., Qingdao 266061, China
**LI Hongqin, E-mail: ;
LUO Li, associate professor, E-mail:

*Contributed equally

Received date: 2022-12-26

  Online published: 2023-06-08

Abstract

This experiment was conducted to study the effects of low protein diets on growth performance and intestinal and liver health of juvenile triploid crucian carp. A total of 360 healthy juvenile triploid crucian carp with the initial weight of (37.15±0.46) g were randomly divided into 6 groups with 3 replicates per group and 20 fish per replicate. Fish in 6 groups were fed six isoenergetic diets with protein levels of 37%, 36%, 35%, 34%, 33% and 32%, respectively. The experiment lasted for 8 weeks. The results showed as follows: 1) the final average weight and specific growth rate of 32%, 33% and 34% protein level groups were significantly lower than those of 37% protein level group (P<0.05), the weight gain rate of 32%, 33%, 34% and 35% protein level groups was significantly lower than that of 37% protein level group (P<0.05), and the feed coefficient of 32%, 33%, 34% and 35% protein level groups was significantly higher than that of 37% protein level group (P<0.05). The viscerosomatic index of 33% protein level group was significantly lower than that of 37% protein level group (P<0.05). The whole fish crude protein content of 32%, 33%, 34%, 35% and 36% protein level groups was significantly lower than that of 37% protein level group (P<0.05), and the visceral mass and muscle ether extract content of 32%, 33%, 34%, 35% and 36% protein level groups was significantly higher than that of 37% protein level group (P<0.05). 2) The intestinal trypsin activity of 32%, 33% and 35% protein level groups was significantly lower than that of 37% protein level group (P<0.05). The intestinal villi height of 32% protein level group was significantly lower than that of 37% protein level group (P<0.05). The plasm diamine oxidase activity of 32% and 33% protein level groups was significantly higher than that of 37% protein level group (P<0.05). 3) The plasm triglyceride content of 32%, 33% and 34% protein level groups was significantly higher than that of 37% protein level group (P<0.05). The liver total antioxidant capacity of 32%, 33%, 34% and 35% protein level groups was significantly lower than that of 37% protein level group (P<0.05), and the liver malondialdehyde content of 32% protein level group was significantly higher than that of 37% protein level group (P<0.05). In conclusion, appropriate reduction of dietary protein level (36%) can improve the intestinal metabolism and barrier function without affecting growth performance and liver health, but excessive dietary protein level diet (≤35%) causes growth performance decreased and intestinal and liver health damaged. Under the conditions of this experiment, comprehensive considering the growth performance and health status, when the dietary protein level is 36%, it has no effects on the growth performance and liver health of juvenile triploid crucian carp, and helps activate intestinal functions, and achieving protein savings and ensuring the healthy growth of juvenile triploid crucian carp.

Cite this article

XI Qingkai , XU Hangzhong , FENG Qifeng , LIU Jiayu , ZHAO Min , CHEN Jianbin , LI Hong , ZHAI Xuliang , XUE Yang , LIU Tianji , LIU Cong , GU Xizhang , LI Hongqin , LUO Li . Effects of Low Protein Diets on Growth Performance and Intestinal and Liver Health of Juvenile Triploid Crucian Carp[J]. Chinese Journal of Animal Nutrition, 2023 , 35(6) : 3867 -3877 . DOI: 10.12418/CJAN2023.359

蛋白质作为生命活动的物质基础,是保证鱼体生长的第一营养物质。但近年来蛋白质原料价格高涨,货源紧缺[1]。脂肪既是养殖鱼类重要的能量来源,也是参与鱼类机体生理代谢活动的重要营养物质[2-3]。研究表明,适当降低饲料的蛋白质水平,可减少饲料中蛋白质作为能量物质的消耗,提高蛋白质利用率,从而降低养殖饲料成本[4]。然而,饲料蛋白质水平的过度下降导致蛋白质含量不足,不能满足生长发育所需,会导致鱼类生长迟缓甚至生长停滞[5]。因此,鱼类获得最佳生长效果范围内饲料最低蛋白质需要量的确定是研究鱼类营养与饲料的首要任务,可从根本上助力资源友好型水产养殖业态的形成。
鲫鱼(Carassius auratus)是我国重要的淡水养殖鱼类,因其营养丰富、肉嫩味美备受人们喜爱。2020年,我国鲫鱼的年总产量高达275万t[6],在淡水养殖中占据重要地位,其配合饲料的用量也十分巨大。因此,开发鲫鱼的低蛋白质饲料对降低饲料养殖成本、减少氮排放、促进水产养殖业绿色可持续发展具有重要意义。经过数十年摸索,鲫鱼饲料蛋白需要量的研究已取得一定进展,相关研究结果表明,鲫鱼的生长阶段和品种皆影响鲫鱼的蛋白质需要量,其中鲫鱼幼鱼最适生长饲料蛋白质水平为37%~42%[7]。我国目前养殖的鲫鱼品种主要包括异育银鲫、彭泽鲫和湘云鲫等,不同鲫鱼品种的蛋白质最适需要量差异较大。然而目前关于鲫鱼配合饲料蛋白质需要量的报导主要集中于异育银鲫[8-9]、彭泽鲫[10-11]和芙蓉鲤鲫[12]等,对湘云鲫蛋白质需要量的研究相对空白,仅叶东容等[13]对此进行了初步探究,设计并制作了蛋白质水平分别为26%、30%、34%、38%和42%的5种梯度饲料,发现饲料蛋白质水平为38%时湘云鲫幼鱼获得最佳生长效果。
基于此,本试验在保持总能及赖氨酸、蛋氨酸含量一致的条件下,降低饲料蛋白质水平,探究低蛋白质饲料对湘云鲫幼鱼生长性能及肠道、肝脏健康的影响,为湘云鲫低蛋白质饲料的开发以及非粮蛋白质饲料的提质增效提供理论依据。

1 材料与方法

1.1 试验饲料

以鱼粉、豆粕等为蛋白质源,大豆油为脂肪源配制6组等能[(17.96±0.01) MJ/kg]试验饲料,6组试验饲料蛋白质水平递减(37%、36%、35%、34%、33%、32%),以大豆油补齐饲料能值差。为消除限制性氨基酸影响,6组试验饲料分别添加0.10%、0.20%、0.30%、0.40%、0.50%、0.60%的赖氨酸和0.02%、0.04%、0.06%、0.08%、0.10%、0.12%的蛋氨酸,确保赖氨酸和蛋氨酸含量一致。饲料原料粉碎后过60目筛,用饲料制粒机(9FZ-35C型,四川棉丰农业机械制造厂)制成直径2.5 mm左右的颗粒饲料,晾干后冷冻保存。试验饲料组成及营养水平见表1
表1 试验饲料组成及营养水平(风干基础)

Table 1 Composition and nutrient levels of experimental diets (air-dry basis)%

项目
Items
饲料蛋白质水平 Dietary protein levels/%
37 36 35 34 33 32
原料 Ingredients
鱼粉 Fish meal 8.00 7.50 7.00 6.50 6.00 5.50
肉粉 Meat meal 8.00 8.00 8.00 8.00 8.00 8.00
豆粕 Soybean meal 16.00 14.50 13.00 11.50 10.00 8.50
发酵豆粕 Fermented soybean meal 12.00 12.00 12.00 12.00 12.00 12.00
棉籽粕 Cottonseed meal 8.00 8.00 8.00 8.00 8.00 8.00
菜籽粕 Rapeseed meal 19.00 19.00 19.00 19.00 19.00 19.00
面粉 Wheat flour 16.50 16.50 16.50 16.50 16.50 16.50
米糠 Bran 4.00 4.00 4.00 4.00 4.00 4.00
大豆油 Soybean oil 3.80 4.80 5.80 6.80 7.80 8.80
预混料 Premix1) 1.50 1.50 1.50 1.50 1.50 1.50
磷酸二氢钙 Ca(H2PO4)2 2.50 2.50 2.50 2.50 2.50 2.50
赖氨酸 Lysine 0.10 0.20 0.30 0.40 0.50 0.60
蛋氨酸 Methionine 0.02 0.04 0.06 0.08 0.10 0.12
膨润土 Bentonite 0.58 1.46 2.34 3.22 4.10 4.98
合计 Total 100.00 100.00 100.00 100.00 100.00 100.00
营养水平 Nutrient levels2)
粗蛋白质 CP 37.14 36.23 35.32 34.41 33.50 32.59
粗脂肪 EE 7.79 8.70 9.61 10.53 11.44 12.35
粗灰分 Ash 7.83 8.55 9.28 10.01 10.74 11.47
总能 GE/(MJ/kg) 17.97 17.97 17.96 17.95 17.95 17.94

1)预混料为每千克饲料提供 The premix provided the following per kg of diets:Fe 150.0 mg,Cu 3.2 mg,Zn 34.1 mg,Mn 13.0 mg,I 5.7 mg,Se 0.3 mg,Co 12.4 mg,VA 2 000.0 IU,VD 2 000.0 IU,VE 100.0 mg,VK3 10.0 mg,VB1 5.0 mg,VB2 10.0 mg,烟酸 niacin acid 100.0 mg,VB6 10.0 mg,泛酸钙 calcium pantothenate 40.0 mg,叶酸 folic acid 5.0 mg,VB120.02 mg,生物素 biotin 1.0 mg,VC 300.0 mg。

2)实测值 Measured values。

1.2 试验设计与饲养管理

于重庆北碚歇马鱼种场购买湘云鲫苗种1 000尾,在西南大学水产学院水产养殖系统的室内水族缸(400 L)中以商品饲料驯化饲养2周后,筛选出个体均匀[初始体重为(37.15±0.46) g]、体质健壮的湘云鲫幼鱼360尾,随机分为6组,每组3个重复,每个重复20尾。6组试验鱼随机分到18个水族缸中,每天人工饱食投喂3次(08:00、12:00、17:00),每天21:00左右换水80%,正式试验养殖周期8周。养殖试验期间水温22~28 ℃,水质指标均符合养殖标准。

1.3 样品采集

养殖试验结束后,停食24 h,MS-222(0.01%)麻醉,对每个重复分别计数、称重,然后计算每个重复试验鱼的数量,并称取总重量,用于计算试验鱼终末体重(FBW)、摄食量(FI)、增重率(WGR)、特定生长率(SGR)、饲料系数(FCR)、肥满度(CF)、脏体比(VSI)、肝体比(HSI)、干物质沉积率(DRR)、蛋白质沉积率(PRR)和脂肪沉积率(LRR)。
每重复随机取5尾鱼,测定体重、体长,从尾静脉抽取静脉血于抗凝管中,静置后4 000×g离心10 min,取上层血浆存于-80 ℃冰箱中保存待用。每重复随机取5尾鱼,置于冰盘中解剖,分离肠道、肝胰脏和肌肉,液氮速冻后于-80 ℃保存备用。此外,每重复随机取3尾鱼,取前肠于4%多聚甲醛中固定备用,用于石蜡切片的制备。

1.4 指标测定

生长性能和形体指标计算公式如下:
增重率(%)=100×(W2-W1)/W1;
特定生长率(%)=100×(lnW2-lnW1)/T;
饲料系数=(W2-W1)/F;
肥满度(%)=100×W2/鱼终末体长3;
脏体比(%)=100×内脏重/W2;
肝体比(%)=100×肝脏重/W2;
干物质沉积率(%)=100×(W2-W1)/摄食干物质含量;
蛋白质沉积率(%)=100×(W2-W1)/摄食粗蛋白质含量;
脂肪沉积率(%)=100×(W2-W1)/摄食粗脂肪含量。
式中:T为试验天数(d);W2为试验结束时各组鱼的平均体重(g);W1为试验开始时各组鱼的平均体重(g);F为试验期间所用饲料总重(g)。
常规营养成分的测定:105 ℃烘箱干燥法(GB/T 6435—2006)测定水分含量,凯氏定氮法(GB/T 6432—1994)测定粗蛋白质含量,索氏抽提法(GB/T 6433—1994)测定粗脂肪含量,高温灼烧法(GB/T 6438—1992)测定粗灰分含量。
石蜡切片制样:由武汉塞维尔生物科技有限公司代制。
肠道消化酶活性的测定:淀粉酶、胰蛋白酶、脂肪酶、Na+-K+-ATP酶活性采用南京建成生物工程研究所生产的试剂盒测定。
肝脏抗氧化指标的测定:总抗氧化能力(T-AOC)、总超氧化物歧化酶(T-SOD)活性、丙二醛(MDA)含量采用南京建成生物工程研究所生产的试剂盒测定。
血浆生化指标的测定:谷丙转氨酶(ALT)、谷草转氨酶(AST)活性和甘油三酯(TG)、总胆固醇(T-CHO)含量均采用南京建成生物工程研究所生产的试剂盒测定。免疫球蛋白M(IgM)、内毒素(LPS)含量和二胺氧化酶(DAO)活性采用上海优选生物科技有限公司生产的酶联免疫吸附测定(ELISA)试剂盒测定。

1.5 数据处理

试验结果采用SPSS 22.0软件进行方差齐性检验和单因素方差分析(one-way ANOVA),采用Tukey多重比较分析组间差异显著性,以饲料蛋白质水平为自变量,对相应数据进行线性回归分析。显著水平为P<0.05,线性回归分析中P<0.05为有相应变化趋势,数据以平均值±标准差(mean±SD)形式表示。

2 结果

2.1 低蛋白质饲料对湘云鲫幼鱼生长性能的影响

表2可知,随饲料蛋白质水平的降低,湘云鲫幼鱼终末均重、摄食量、增重率和特定生长率呈线性降低趋势(P<0.05),其中32%、33%和34%蛋白质水平组的终末均重和特定生长率显著低于37%蛋白质水平组(P<0.05),32%、33%、34%和35%蛋白质水平组的增重率显著低于37%蛋白质水平组(P<0.05);饲料系数呈线性升高趋势(P<0.05),其中32%、33%、34%和35%蛋白质水平组的饲料系数显著高于37%蛋白质水平组(P<0.05)。各组之间摄食量无显著差异(P>0.05)。
表2 低蛋白质饲料对湘云鲫幼鱼生长指标的影响

Table 2 Effects of low protein diets on growth indexes of juvenile triploid crucian carp

项目
Items
初始均重
IBW/g
终末均重
FBW/g
摄食量
FI/g
增重率
WGR/%
特定生长率
SGR/%
饲料系数
FCR
饲料蛋白质
水平
Dietary protein
levels/%
37 36.85±0.73 112.44±1.05c 116.01±2.57 205.22±6.95c 1.86±0.04c 1.53±0.03a
36 37.20±0.28 109.83±1.57bc 115.36±7.23 194.40±6.20bc 1.80±0.04bc 1.60±0.06ab
35 37.07±0.93 107.90±5.18abc 114.90±3.26 188.75±15.20ab 1.77±0.09abc 1.64±0.02bc
34 37.15±0.46 106.13±6.42ab 114.59±3.12 185.25±13.64ab 1.75±0.08ab 1.63±0.08b
33 37.30±0.53 104.05±3.57ab 113.38±3.73 174.88±9.81a 1.69±0.06a 1.72±0.04cd
32 37.13±0.49 101.83±2.41a 111.68±3.36 173.45±8.04a 1.68±0.05a 1.75±0.08d
线性回归
Linear
regression
P
P-value
0.183 <0.001 0.003 0.001 <0.001 0.002
相关系数
R2
0.393 0.997 0.912 0.964 0.967 0.934

同列数据肩标不同小写字母表示差异显著(P<0.05),相同或无字母表示差异不显著(P>0.05)。下表同。

In the same column, values with different small letter superscripts mean significant difference (P<0.05), while with the same or no letter superscripts mean no significant difference (P>0.05). The same as below.

表3可知,随饲料蛋白质水平的降低,湘云鲫幼鱼脏体比呈线性升高趋势(P<0.05),其中33%蛋白质水平组的脏体比显著低于37%蛋白质水平组(P<0.05)。各组之间肥满度和肝体比无显著差异(P>0.05)。
表3 低蛋白质饲料对湘云鲫幼鱼形体指标的影响

Table 3 Effects of low protein diets on body indexes of juvenile triploid crucian carp

项目
Items
肥满度
CF/(g/cm3)
脏体比
VSI/%
肝体比
HSI/%
饲料蛋白质水平
Dietary protein levels/%
37 2.75±0.25 5.50±0.70a 1.67±0.32
36 2.74±0.24 5.67±0.63ab 1.69±0.29
35 2.70±0.23 5.75±0.83ab 1.63±0.35
34 2.65±0.22 5.81±0.76ab 1.76±0.21
33 2.65±0.22 6.28±1.06b 1.72±0.34
32 2.75±0.23 6.06±0.96ab 1.70±0.36
线性回归
Linear regression
PP-value 0.484 0.017 0.373
相关系数 R2 0.129 0.795 0.201
表4可知,随饲料蛋白质水平的降低,湘云鲫幼鱼全鱼粗蛋白质含量呈线性下降趋势(P<0.05),其中32%、33%、34%、35%和36%蛋白质水平组的全鱼粗蛋白质含量显著低于37%蛋白质水平组(P<0.05)。此外,32%、33%、34%、35%和36%蛋白质水平组的全鱼粗脂肪含量显著高于37%蛋白质水平组(P<0.05),32%和33%蛋白质水平组的全鱼粗灰分含量显著低于34%、35%、36%和37%蛋白质水平组(P<0.05)。各组之间全鱼水分含量无显著差异(P>0.05)。
表4 低蛋白质饲料对湘云鲫幼鱼全鱼、内脏团及肌肉营养组成的影响

Table 4 Effects of low protein diets on nutritional composition of whole fish, visceral mass and muscle of juvenile triploid crucian carp%

项目
Items
全鱼
Whole fish
内脏团
Visceral mass
肌肉
Muscle
水分 Moisture 粗蛋白质 CP 粗脂肪 EE 粗灰分 Ash 粗脂肪 EE 粗脂肪 EE
饲料蛋白质
水平
Dietary protein
levels/%
37 71.33±0.59 17.31±0.08c 9.40±0.28a 3.01±0.06b 11.12±0.95a 1.43±0.03a
36 69.61±0.41 16.32±0.07b 11.41±0.21b 3.07 ±0.05c 11.71±1.33a 1.69±0.10b
35 69.66±1.21 16.20±0.17b 11.52±0.21b 3.03±0.03bc 12.60±1.09b 1.65±0.08b
34 69.17±1.00 15.81±0.47ab 12.12±0.42c 3.06±0.03c 17.72±2.37c 1.72±0.04b
33 70.03±1.18 16.12±0.10b 11.34±0.60b 2.89±0.03a 17.31±1.33c 1.91±0.05c
32 69.85±0.42 15.41±0.00a 12.31±0.33c 2.86±0.03a 17.62±0.98c 2.30±0.03d
线性回归
Linear regression
P
P-value
0.336 0.021 0.072 0.085 0.011 0.010
相关系数
R2
0.230 0.775 0.596 0.565 0.836 0.841
随饲料蛋白质水平的降低,湘云鲫幼鱼内脏团和肌肉粗脂肪含量呈线性上升趋势(P<0.05),其中32%、33%、34%和35%蛋白质水平组的内脏团和肌肉粗脂肪含量显著高于37%蛋白质水平组(P<0.05)。
表5可知,随饲料蛋白质水平的降低,湘云鲫幼鱼蛋白质沉积率和脂肪沉积率呈线性下降趋势(P<0.05),其中32%、33%、34%、35%和36%蛋白质水平组的脂肪沉积率显著低于37%蛋白质水平组(P<0.05)。各组之间蛋白质沉积率和干物质沉积率无显著差异(P>0.05)。
表5 低蛋白质饲料对湘云鲫幼鱼营养物质沉积率的影响

Table 5 Effects of low protein diets on nutrient deposition rates of juvenile triploid crucian carp%

项目
Items
干物质沉积率
DRR
蛋白质沉积率
PRR
脂肪沉积率
LRR
饲料蛋白质水平
Dietary protein levels/%
37 26.31±0.54 39.46±0.82 111.57±2.30d
36 25.90±1.66 39.66±1.84 89.84±5.90c
35 26.38±1.83 39.18±0.82 86.60±5.19c
34 26.06±1.97 39.45±1.49 79.07±4.78b
33 25.26±0.55 38.31±0.82 72.62±1.61ab
32 25.39±0.99 37.86±1.50 73.79±2.96a
线性回归
Linear regression
PP-value 0.066 0.027 0.010
相关系数 R2 0.612 0.746 0.842

2.2 低蛋白质饲料对湘云鲫幼鱼肠道健康的影响

表6可知,随饲料蛋白质水平的降低,湘云鲫幼鱼肠道胰蛋白酶活性呈线性下降趋势(P<0.05),其中32%、33%和35%蛋白质水平组的肠道胰蛋白酶活性显著低于37%蛋白质水平组(P<0.05)。此外,34%蛋白质水平组的淀粉酶活性显著低于37%蛋白质水平组(P<0.05),34%蛋白质水平组的脂肪酶活性显著高于37%蛋白质水平组(P<0.05),32%、33%、34%、35%和36%蛋白质水平组的Na+-K+-ATP酶活性均与37%蛋白质水平组无显著差异(P>0.05)。
表6 低蛋白质饲料对湘云鲫幼鱼肠道消化酶活性的影响

Table 6 Effects of low protein diets on activity of digestive enzymes in intestine of juvenile triploid crucian carpU/mg prot

项目
Items
淀粉酶
Amylase
胰蛋白酶
Trypsin
脂肪酶
Lipase
Na+-K+-ATP酶
Na+-K+-ATPase
饲料蛋白质水平
Dietary protein
levels/%
37 1.30±0.19bc 5 385.30±685.80c 47.20±4.88a 3.66±1.11ab
36 1.45±0.11c 5 286.80±459.50bc 51.20±6.09a 3.65±0.90ab
35 1.28±0.10bc 4 679.30±380.40ab 52.60±13.45ab 3.71±0.90ab
34 1.01±0.09a 4 864.80±771.40abc 61.80±0.01b 4.60±0.36b
33 1.22±0.12b 4 622.70±211.00ab 55.30±3.99ab 3.44±0.33ab
32 1.25±0.18b 4 545.80±342.20a 53.40±3.58ab 2.53±0.24a
线性回归
Linear regression
PP-value 0.367 0.015 0.230 0.388
相关系数 R2 0.205 0.808 0.334 0.190
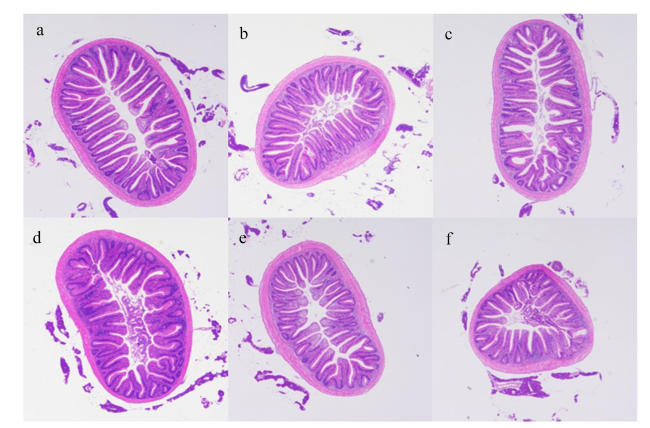
低蛋白质饲料对湘云鲫幼鱼前肠组织结构的影响如图1所示。由表7可知,随饲料蛋白质水平的降低,湘云鲫幼鱼肠道绒毛高度和绒毛数量均呈线性下降趋势(P<0.05),其中32%蛋白水平组的肠道绒毛高度显著低于37%蛋白质水平组(P<0.05)。各组之间肠道绒毛数量无显著差异(P>0.05)。
图1 低蛋白质饲料对湘云鲫幼鱼前肠组织结构的影响

a: 37%蛋白质水平组 37% protein level group; b: 36%蛋白质水平组 36% protein level group; c: 35%蛋白质水平组 35% protein level group; d: 34%蛋白质水平组 34% protein level group; e: 33%蛋白质水平组 33% protein level group; f: 32%蛋白质水平组 32% protein level group。

Fig.1 Effects of low protein diets on foregut structure of juvenile triploid crucian carp (20×)

表7 低蛋白质饲料对湘云鲫幼鱼前肠组织结构的影响

Table 7 Effects of low protein diets on structure of anterior intestine of juvenile triploid crucian carp

项目 Items 绒毛高度 Villous height/μm 绒毛数量 Villous number/个
饲料蛋白质水平
Dietary protein levels/%
37 765.70±84.18b 37.30±1.53
36 777.20±27.83b 35.00±1.00
35 717.30±27.62b 35.30±3.77
34 724.20±31.70b 34.30±4.04
33 626.00±29.89ab 33.30±1.15
32 568.20±38.82a 33.70±0.71
线性回归
Linear regression
PP-value 0.007 0.015
相关系数 R2 0.866 0.810
表8可知,随饲料蛋白质水平的降低,湘云鲫幼鱼血浆二胺氧化酶活性呈线性上升趋势(P<0.05),其中32%和33%蛋白质水平组的血浆二胺氧化酶活性显著高于37%蛋白质水平组(P<0.05)。各组之间血浆免疫球蛋白M和内毒素含量无显著差异(P>0.05)。
表8 低蛋白质饲料对湘云鲫幼鱼血浆生化指标的影响

Table 8 Effects of low protein diets on plasma biochemical indexes of juvenile triploid crucian carp

项目
Items
免疫球蛋白M
IgM/(μg/mL)
二胺氧化酶
DAO/(U/mL)
内毒素
LPS/(EU/L)
饲料蛋白质水平
Dietary protein levels/%
37 3 513.30±441.90 13.70±1.58a 592.40±21.30
36 3 172.00±246.00 15.10±1.84ab 605.60±19.83
35 3 457.40±392.70 14.00±1.41a 599.70±25.74
34 3 150.80±222.50 14.30±1.92a 601.80±20.71
33 3 336.60±136.60 16.80±0.64bc 595.40±23.52
32 3 542.20±273.50 17.50±2.31c 585.30±8.79
线性回归
Linear regression
PP-value 0.845 0.041 0.346
相关系数 R2 0.011 0.689 0.221

2.3 低蛋白质饲料对湘云鲫幼鱼肝脏健康的影响

表9可知,随饲料蛋白质水平的降低,湘云鲫幼鱼血浆甘油三酯含量呈线性升高趋势(P<0.05),其中32%、33%和34%蛋白质水平组的血浆甘油三酯含量显著高于37%蛋白质水平组(P<0.05)。此外,32%和34%蛋白质水平组的血浆总胆固醇含量显著高于37%蛋白质水平组(P<0.05),34%蛋白质水平组的血浆谷草转氨酶活性显著低于37%蛋白质水平组(P<0.05)。各组之间血浆谷丙转氨酶活性无显著差异(P>0.05)。
表9 低蛋白质饲料对湘云鲫幼鱼肝脏代谢指标的影响

Table 9 Effects of low protein diets on liver metabolism indexes of juvenile triploid crucian carp

项目
Items
血浆甘油三酯
Plasma TG/
(mmol/L)
血浆总胆固醇
Plasma TC/
(mmol/L)
血浆谷草转氨酶
Plasma AST/
(U/L)
血浆谷丙转氨酶
Plasma ALT/
(U/L)
饲料蛋白质水平
Dietary protein
levels/%
37 2.23±0.13a 3.82±0.12a 121.00±27.62b 8.50±1.06
36 2.27±0.08a 3.86±0.24ab 102.70±4.89ab 7.90±1.69
35 2.32±0.10a 3.75±0.13a 98.20±7.85ab 8.30±1.14
34 2.52±0.11b 4.10±0.27bc 84.10±1.19a 8.20±1.42
33 2.60±0.04b 3.89±0.07ab 109.60±10.32b 8.50±0.74
32 2.56±0.02b 4.17±0.22c 114.80±24.70b 8.30±0.38
线性回归
Linear regression
PP-value 0.005 0.117 0.852 0.751
相关系数 R2 0.883 0.498 0.010 0.028
表10可知,随饲料蛋白质水平的降低,湘云鲫幼鱼肝脏总抗氧化能力呈线性下降趋势(P<0.05),其中32%、33%、34%和35%蛋白质水平组的肝脏总抗氧化能力显著低于37%蛋白质水平组(P<0.05);肝脏丙二醛含量呈线性升高趋势(P<0.05),其中32%蛋白质水平组的肝脏丙二醛含量显著高于37%蛋白质水平组(P<0.05)。各组之间肝脏总超氧化物歧化酶活性差异不显著(P>0.05)。
表10 低蛋白质饲料对湘云鲫幼鱼肝脏抗氧化指标的影响

Table 10 Effects of low protein diets on liver antioxidation indexes of juvenile triploid crucian carp

项目
Items
肝脏总抗氧化能力
Liver T-AOC/
(U/mg prot)
肝脏总超氧化物歧化酶
Liver T-SOD/
(nmol/mg prot)
肝脏丙二醛
Liver MDA/
(nmol/mg prot)
饲料蛋白质水平
Dietary protein
levels/%
37 1.25±0.13c 5.14±0.66 0.69±0.08ab
36 1.22±0.11c 4.98±0.51 0.62±0.06a
35 1.03±0.08b 4.58±0.45 0.68±0.12ab
34 1.07±0.10b 5.27±0.18 0.78±0.09b
33 1.09±0.11b 5.37±0.47 0.80±0.10b
32 0.84±0.10a 5.47±0.51 0.97±0.01c
线性回归
Linear regression
PP-value 0.024 0.225 0.021
相关系数 R2 0.757 0.340 0.773

3 讨论

3.1 低蛋白质饲料对湘云鲫幼鱼生长性能的影响

在草金鱼(Carassius auratus red var.)[14]、云龙石斑鱼(Epinephelus moara)[15]等的研究中均证实,在保持饲料总能不变的基础上,适当降低饲料蛋白质水平,养殖鱼类生长性能保持不变。同时,鲫鱼作为我国重要的淡水养殖品类,规模化养殖良种较多,不同品种鲫鱼的最适蛋白质需要量差异较大,目前普遍认为异育银鲫幼鱼饲料最适蛋白质水平为40%[8],饲料蛋白质水平为36%时芙蓉鲤鲫幼鱼可获得最佳生长效果[16],而彭泽鲫达到最佳生长效果仅需饲料蛋白质水平为30%[10],然而至今对湘云鲫饲料蛋白质需要量的研究较少,仅叶东容等[13]对此进行了初步探究,设计并制作了蛋白质水平分别为26%、30%、34%、38%和42% 5种梯度的饲料,发现饲料蛋白质水平为38%时湘云鲫幼鱼获得最佳生长效果,上述研究为湘云鲫幼鱼最适蛋白质需要量的研究奠定了基础,但由于不同组间饲料蛋白质水平差异较大,对实际生产中湘云鲫幼鱼饲料配方蛋白质水平的确立意义有限,且只对生长指标进行了检测,缺乏对湘云鲫健康状态的系统评估,因此,我们在此基础上设计并制作了蛋白质水平为37%、36%、35%、34%、33%和32%的6种饲料,发现当饲料蛋白质水平由37%降低至36%时,湘云鲫幼鱼的增重率、特定生长率与饲料系数均未发生明显改变,说明在此范围内饲料蛋白质水平的降低对湘云鲫生长性能无显著影响。从蛋白质与脂肪的沉积率上也可得知,随着饲料蛋白质水平的降低,蛋白质沉积率并未明显改变,脂肪沉积率大幅下降,我们推测更多的脂肪被用于为鱼体供能,更多的蛋白质被用于合成体蛋白,保证生长。
鱼类的营养状态可由肝体比和脏体比等形态学指标反映出来,饲料的营养配比不合理容易导致脂质在鱼体中的过度积累,进而诱发一系列的健康问题。本试验中,随着饲料蛋白质水平的降低,虽然脂肪沉积率大幅下降,但全鱼、内脏团、肌肉的粗脂肪含量均呈上升趋势,脂肪在内脏团中的沉积进而导致脏体比的升高,说明饲料蛋白质水平过低时,为补足能值差距,饲料脂肪水平升高,导致脂肪不仅不能被鱼体充分吸收利用,而且还对鱼体代谢系统造成了负担,在内脏团大量沉积。

3.2 低蛋白质饲料对湘云鲫幼鱼肠道健康的影响

湘云鲫为无胃鱼类,肠道是营养物质消化、吸收的主要场所。在肠道内,饲料在各种消化酶的作用下分解为小分子物质,通过肠绒毛吸收进入血液循环。本试验中,肠道胰蛋白酶活性随饲料蛋白质水平的降低呈线性降低,饲料蛋白质水平与胰蛋白酶活性之间的相似关系在其他水生动物中也有相关报导[17]。脂肪酶、淀粉酶与Na+-K+-ATP酶活性随饲料蛋白质水平的降低出现先增高后下降的趋势,说明在一定范围内,这几种消化吸收酶可随饲料蛋白质水平的降低出现适应性的增强,但蛋白质水平过低可能对肠道的组织结构存在损伤,导致肠绒毛数量减少,绒毛高度降低,消化吸收面积减少,消化酶活性反而降低。
肠道结构和功能的完整性是机体抵御病原体入侵的第1道屏障。血浆中的二胺氧化酶主要来源于肠黏膜上皮细胞,其含量可间接反映肠道黏膜机械屏障的完整性[18]。内毒素主要是胃肠道内多种细菌的相关产物,是了解肠道黏膜通透性的重要指标[19]。本试验中,虽然血浆中内毒素含量变化不明显,但二胺氧化酶活性在饲料蛋白质水平为32%和33%时显著升高,这可能是蛋白质水平过低对肠黏膜屏障产生了不利影响。

3.3 低蛋白质饲料对湘云鲫幼鱼肝脏健康的影响

肝脏是鱼类中间代谢的主要器官,谷草转氨酶和谷丙转氨酶是存在于肝细胞内的2种转氨酶,当肝细胞坏死时,大量谷草转氨酶和谷丙转氨酶释放到血液循环中,导致血浆中的转氨酶活性升高。本试验中,血浆谷丙转氨酶活性变化不明显,血浆谷草转氨酶活性随饲料蛋白质水平的降低先降后升,说明饲料蛋白质水平的适当降低可减轻肝脏代谢负担,减少肝细胞的损伤。但饲料蛋白质水平过低时,过高的脂肪水平可能会打破机体的脂质代谢稳态,导致血浆中甘油三酯与总胆固醇含量的升高,造成肝脏脂质代谢负担的加重。
肝脏是鱼类重要的代谢器官,鱼类在代谢过程会不断产生自由基,同时也在不断清除这些自由基,抗氧化是鱼类肝脏的重要功能之一。总抗氧化能力是组织内酶促与非酶促抗氧化能力的总和,反映组织清除自由基的总能力。丙二醛是脂质过氧化的最终产物,大量累积会损害细胞组织。本试验中,随饲料蛋白质水平的降低,肝脏总抗氧化能力呈线性下降趋势,肝脏丙二醛含量呈线性升高趋势,说明饲料蛋白质水平过低会引起肝脏抗氧化能力的下降,这在石斑鱼(Epinehelus moara)[20]的研究中也有所发现。

3.4 低蛋白质饲料对湘云鲫幼鱼饲喂成本的影响

饲料是水产养殖中的主要支出,饲料成本占水产养殖成本的70%~80%,而蛋白质原料的成本又占饲料成本的60%以上,因此,在保障鱼类健康快速生长的前提下,低蛋白质饲料配方的研发对于饲料成本乃至养殖成本的降低具有重要的意义。本研究发现,饲料蛋白质水平从37%降至36%,并适量添加晶体氨基酸和油脂以保持饲料总能不变,对湘云鲫幼鱼生长性能及肠道、肝脏健康没有显著影响,每吨饲料可以节约鱼粉5 kg、豆粕15 kg,降低饲料配方成本8元/t。确定满足湘云鲫幼鱼生长的最适饲料蛋白质水平后,可以进一步优化饲料蛋白质源组成和比例,进一步优化饲料配方成本,同时助力资源友好型水产养殖新业态的形成。

4 结论

综上所述,低蛋白质饲料可在不影响生长性能的前提下,提高湘云鲫幼鱼肠道和肝脏健康水平,但饲料蛋白质水平过低会引起生长性能下降,肠道和肝脏功能受损。在本试验条件下,综合考虑生长性能与健康状况,湘云鲫幼鱼最适饲料蛋白质水平为36%。
[1]
HAN D, SHAN X J, ZHANG W B, et al. A revisit to fishmeal usage and associated consequences in Chinese aquaculture[J]. Reviews in Aquaculture, 2018, 10(2):493-507.

DOI

[2]
LIN Y H, SHIAU S Y. Dietary lipid requirement of grouper,Epinephelus malabaricus,and effects on immune responses[J]. Aquaculture, 2003, 225(1/2/3/4):243-250.

DOI

[3]
LI X F, JIANG Y Y, LIU W B, et al. Protein-sparing effect of dietary lipid in practical diets for blunt snout bream (Megalobrama amblycephala) fingerlings:effects on digestive and metabolic responses[J]. Fish Physiology and Biochemistry, 2012, 38(2):529-541.

DOI

[4]
CHO C Y, KAUSHIK S J. Nutritional energetics in fish:energy and protein utilization in rainbow trout (Salmo gairdneri)[J]. World Review of Nutrition and Dietetics, 1990, 61:132-172.

[5]
WILSON R P. 3-Amino acids and proteins[M]//HALVER J E,HARDY R W. Fish nutrition. 3rd ed. San Diego: Academic Press, 2003:143-179.

[6]
农业农村部渔业渔政管理局,全国水产技术推广总站,中国水产学会. 中国渔业统计年鉴-2021[M]. 北京: 中国农业出版社, 2021.

Fisheries and Fisheries Administration of the Ministry of Agriculture and Rural Affairs,National Fisheries Technology Extension Center,China Society of Fisheries. China fishery statistical yearbook 2021[M]. Beijing: China Agriculture Press, 2021. (in Chinese)

[7]
杨国华, 郭履骥, 李军, 等. 鱼类营养和我国几种主要养殖对象的营养指标[J]. 动物学杂志, 1983(4):51- 55,60-26.

YANG G H, GUO L J, LI J, et al. Fish nutrition and nutrient index of several kinds of main aquaculture objects in our country[J]. Chinese Journal of Zoology, 1983(4):51- 55,60-26. (in Chinese)

[8]
YE W, HAN D, ZHU X, et al. Comparative studies on dietary protein requirements of juvenile and on-growing gibel carp (Carassius auratus gibelio) based on fishmeal-free diets[J]. Aquaculture Nutrition, 2015, 21(3):286-299.

DOI

[9]
TU Y Q, XIE S Q, HAN D, et al. Growth performance,digestive enzyme,transaminase and GH-IGF-I axis gene responsiveness to different dietary protein levels in broodstock allogenogynetic gibel carp (Carassius auratus gibelio) CAS Ⅲ[J]. Aquaculture, 2015, 446:290-297.

DOI

[10]
何瑞国, 王玉莲, 王胜林, 等. 不同营养水平对彭泽鲫春片鱼种生长影响的研究[J]. 淡水渔业, 1999, 29(6):3-6.

HE R G, WANG Y L, WANG S L, et al. Effects of different nutritive level on growth of Pengze crucian carp Carassius auratus fingerlings[J]. Freshwater Fisheries, 1999, 29(6):3-6. (in Chinese)

[11]
方之平, 潘黔生, 何瑞国, 等. 彭泽鲫鱼种配合饲料的初步研究[J]. 水利渔业, 1998(4):3-5.

FANG Z P, PAN Q S, HE R G. Preliminary study on the mixed feed of Pengze crucian carp[J]. Reservoir Fisheries, 1998(4):3-5. (in Chinese)

[12]
何志刚, 伍远安, 王金龙, 等. 饲料蛋白水平对芙蓉鲤鲫幼鱼增重和消化酶活性的影响[J]. 湖北农业科学, 2014, 53(1):153-156.

HE Z G, WU Y A, WANG J L, et al. Effect of dietary protein levels on growth performance and digestive enzyme activities of Furong crucian carp (Furong carp×red crucian carp) juvenile[J]. Hubei Agricultural Sciences, 2014, 53(1):153-156. (in Chinese)

[13]
叶东容, 徐小林. 配合饲料中不同粗蛋白水平对湘云鲫幼鱼生长性能的影响[J]. 当代水产, 2011, 36(10):52-54.

YE D R, XU X L. Effects of different crude protein levels in compound diet on growth performance of juvenile triploid crucian carp[J]. Current Fisheries, 2011, 36(10):52-54. (in Chinese)

[14]
李铁梁, 邢薇, 徐冠玲, 等. 饲料蛋白质和脂肪水平对草金鱼生长性能、观赏品质及氮磷排泄的影响[J]. 动物营养学报, 2019, 31(2):721-731.

LI T L, XING W, XU G L, et al. Effects of protein and lipid levels in diets on growth performance,ornamental quality and nitrogen and phosphorus excretion of Carassius auratus red var.[J]. Chinese Journal of Animal Nutrition, 2019, 31(2):721-731. (in Chinese)

[15]
KHOSRAVI S, LEE S M. Optimum dietary protein and lipid levels in juvenile filefish,Stephanolepis cirrhifer,feed[J]. Journal of the World Aquaculture Society, 2017, 48(6):867-876.

DOI

[16]
王金龙, 何志刚, 伍远安, 等. 饲料蛋白水平对芙蓉鲤鲫幼鱼生长和体组成的影响[J]. 饲料研究, 2013(8):1-4.

WANG J L, HE Z G, WU Y A, et al. Effects of dietary protein levels on the growth and body composition of juvenile Furong crucian carp[J]. Feed Research, 2013(8):1-4. (in Chinese)

[17]
MA B H, WANG L G, LOU B, et al. Dietary protein and lipid levels affect the growth performance,intestinal digestive enzyme activities and related genes expression of juvenile small yellow croaker (Larimichthys polyactis)[J]. Aquaculture Reports, 2020, 17:100403.

DOI

[18]
NIETO N, TORRES M I,FERN? NDEZ M I, et al. Experimental ulcerative colitis impairs antioxidant defense system in rat intestine[J]. Digestive Diseases and Sciences, 2000, 45(9):1820-1827.

PMID

[19]
JOHNSTON S D, SMYE M, WATSON R P. Intestinal permeability tests in coeliac disease[J]. Clinical Laboratory, 2001, 47(3/4):143-150.

[20]
张晨捷, 彭士明, 陈超, 等. 饲料蛋白和脂肪水平对云纹石斑鱼幼鱼免疫和抗氧化性能的影响[J]. 海洋渔业, 2016, 38(6):634-644.

ZHANG C J, PENG S M, CHEN C, et al. Effects of dietary protein and lipid levels on immune and antioxidant function of juvenile Epinehelus moara[J]. Marine Fisheries, 2016, 38(6):634-644. (in Chinese)

Outlines

/