RESEARCH PAPER

Construction of Models for Predicting Nitrogen Excretion from Pigs Based on Meta-Analysis

  • TANG Chao ,
  • KONG Weisong ,
  • WANG Xiaojuan ,
  • ZHAO Jingpeng ,
  • LIN Hai ,
  • JIAO Hongchao , *
Expand
  • Key Laboratory of Efficient Utilization of Non-Grain Feed Resources (Co-Construction by Ministry and Province), College of Animal Science and Technology, Shandong Agricultural University, Tai’an 271018, China
*professor, E-mail:

Received date: 2022-12-20

  Online published: 2023-06-08

Abstract

This experiment was aimed to investigate the composition and variation range of pig nitrogen excretion with conventional diets by Meta-analysis, and to develop a prediction model for nitrogen excretion of pigs at different growth stages. The related literatures were searched from 2000 to 2021 in Chinese and foreign language databases (Web of Science, PubMed, ScienceDirect, CNKI, CQVIP and Wanfang Data). The prediction model of pig nitrogen excretion at different stages was established based on the nitrogen intake (NI), fecal nitrogen (FN), urinary nitrogen (UN) and total nitrogen excretion (NE) of pigs, and using the inverse of variance method to perform Meta-analysis of nitrogen excretion of pigs at different growth stages. The results showed that the NI of nursery, pre-fattening and late-fattening pigs strongly correlated with FN, UN and NE (P<0.01). The models for predicting nitrogen excretion based on NI of pigs at different stages were: nursery pigs NE=0.460NI-2.255, FN=0.197NI-1.314, UN=0.264NI-0.965; pre-fattening pigs NE=0.583NI-5.370, FN=0.139NI+1.340, UN=0.446NI-6.788; late-fattening pigs NE=0.698NI-10.251, FN=0.143NI+0.422, UN=0.551NI-10.451. It is concluded that models for predicting FN, UN and NE of pigs at each growth stage are established by Meta-analysis in this experiment, which based on the NI of pigs. Those models can be used to predict the nitrogen excretion of pigs at different growth stages and thus provide basic parameters and methodological support for resource utilization of farming manure.

Cite this article

TANG Chao , KONG Weisong , WANG Xiaojuan , ZHAO Jingpeng , LIN Hai , JIAO Hongchao . Construction of Models for Predicting Nitrogen Excretion from Pigs Based on Meta-Analysis[J]. Chinese Journal of Animal Nutrition, 2023 , 35(6) : 4001 -4010 . DOI: 10.12418/CJAN2023.371

在实际生产中为了保持较高的生长或生产性能,饲粮蛋白质水平一般较高[1-2]。较高的饲粮蛋白质水平和氨基酸组成的不平衡导致蛋白质资源的低效利用[3],使养殖中氮排泄增加,环境面临很大挑战[4]。生猪对饲粮中氮的利用率较低,1头仔猪从出生到100 kg屠宰时,共消耗9 kg的氮,其中被吸收沉淀后成为瘦肉的氮不超过3 kg[5],其他氮会通过粪、尿排出。粪氮(fecal nitrogen,FN)约占总氮排泄量(total nitrogen excretion,NE)的25%,尿氮(urinary nitrogen,UN)约占NE的75%[6],排出的氮进入周围水体、土壤和空气中,会对环境造成较大危害[7]。2009年环保部公布了第一次全国污染源普查后的产污系数[8],在各大区尺度上有较高代表性,但是NE随饲粮营养成分组成发生改变[9],使用固定的产污系数计算NE是不准确的。因此,通过影响NE的指标开发预测模型是准确评估氮排放的有效方法,有助于提高NE预测的准确性。而且,鉴于生猪各生长阶段对氮的利用率不同[10-12],分阶段计算NE更有意义。关于生长育肥猪NE的预测模型已有报道,Clanton等[13]研究发现,生长育肥猪FN=摄入氮(nitrogen intake,NI)-20×{[屠宰体重(slaughtering body weight,BW)+平均日增重]1.012-BW1.012};美国ASAE[14]给出了生长育肥猪FN的推荐算法,即FN=NI-BW×平均屠宰率×平均胴体瘦肉率)/159.4+初始体重×[平均屠宰率-0.05×(BW-初始体重)]×[平均胴体瘦肉率+0.07×(BW-初始体重)]/159.4;杨增玲[15]基于饲粮基础数据建立了生长育肥猪的快速预测模型,但样本量小且未分阶段进行预测。Meta分析是一种综合同一领域所有类型研究成果的统计方法。Meta分析消除了研究之间的差异,使校正后的数据具有可比性,产生更客观和令人信服的结论[16]。因此,本研究拟利用Meta分析的方法建立不同生长阶段猪的氮排泄量预测模型,旨在为养殖粪污资源化利用提供基础参数和方法支撑。

1 材料与方法

1.1 文献检索策略

文献检索范围包括Web of Science、PubMed、ScienceDirect、中国知网、维普和万方6个数据库,文献发表时间为2000年1月至2021年6月,按表1列出的关键词进行全文检索,获取不同阶段生猪在不同蛋白质水平饲粮下氮代谢及氮排放的有关文献。
表1 文献检索策略

Table 1 Literature search strategies

序号 No. 检索关键词 Search key word
1 “猪”AND“氮代谢”
2 “猪”AND“氮排放”
3 “pig” AND “nitrogen emission”
4 “swine” AND “nitrogen emission”
5 “pig” AND “nitrogen metabolism”
6 “swine” AND “nitrogen metabolism”

1.2 文献纳入标准

文献的纳入标准包括:1)有明确描述饲粮成分和排泄数据的文献,满足是玉米-豆粕型常规饲粮,同时包括粗蛋白质含量和采食量,排泄数据包括FN、UN和NE;2)有常规饲粮对照组的猪代谢试验的文献;3)有试验猪重复头数(n)、标准差(SD)或标准误(SE),数据齐全的文献;4)有明确体重阶段的文献;5)试验猪为没有疾病、生长正常的猪的文献。
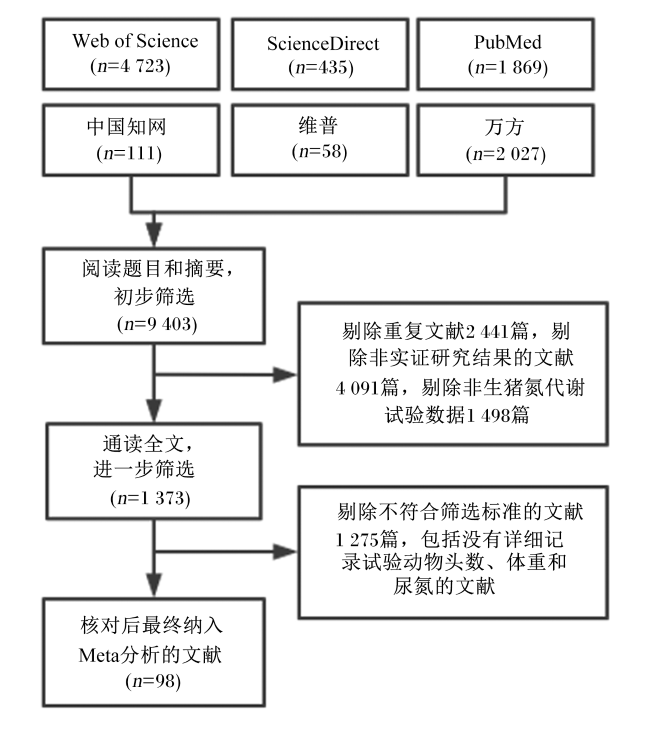
按检索标准进行筛选后,本研究最终纳入分析的文献共98篇,包括中文文献42篇,英文文献56篇,共计251个处理2 031头生猪的数据。文献筛选流程图如图1所示。文献数据的基本特征如表2所示。
图1 文献筛选流程图

Fig.1 Literature screening process

表2 基本特征

Table 2 Basic characteristics

生长阶段
Growth
stages
参数
Parameters
文献数量
Number of
literature
数据量
Amount of data
平均值
Average
value
标准误
SE
最大值
Maximum
最小值
Minimum
保育猪
Conserved pigs
NI 23 58 28.323 8 1.277 4 48.48 11.27
FN 23 58 4.274 1 0.301 1 10.72 1.43
UN 23 58 6.509 8 0.529 4 16.83 1.85
NE 23 58 10.772 0 0.753 4 24.35 3.47
育肥前期猪
Pre-fattening pigs
NI 42 107 43.411 5 1.079 0 14.97 73.35
FN 42 107 7.370 4 0.235 2 12.46 2.38
UN 42 107 12.584 3 0.619 4 31.06 2.06
NE 42 107 19.948 1 0.782 8 42.71 2.88
育肥后期猪
Late-fattening pigs
NI 33 86 58.262 1 0.782 8 83.60 33.68
FN 33 86 8.726 9 1.271 1 17.25 4.52
UN 33 86 21.651 9 0.334 2 38.72 2.88
NE 33 86 30.394 0 0.978 0 49.04 9.94

NI:摄入氮 nitrogen intake;FN:粪氮 fecal nitrogen;UN:尿氮 urinary nitrogen;NE:总氮排泄量 total nitrogen excretion。下表同 the same as below。

1.3 数据筛选和提取

将符合筛选标准的文献确认无误后下载,提取以下信息和指标:作者、发表时间、生长阶段、试验生猪头数(n)、NI、FN、UN、NE及其SD或SE等。

1.4 统计分析

使用Excel 2019进行文献数据信息的录入和整理。使用R软件(4.1.2)Meta软件包(5.0-1)进行Meta分析。利用I2P值对统计学异质性进行判断[17]:当I2<25%且P>0.10时,认为异质性较小,采用固定效应模型进行分析;当I2>25%且P<0.10时,则认为存在实质的统计学异质性,采用随机效应模型(random effect model,REM)进行分析[18]。通过倒方差法计算氮排泄量合并预测值和95%置信区间(CI)。采用Egger检验进行文献发表偏倚评估[19],P<0.10认为存在显著发表偏倚,即采用单项文献逐项剔除方法进行敏感性分析,若剔除单项文献后导致合并效应量的变化小于5%,则认为敏感性低,合并效应量结果具有稳定性。使用SPSS软件(Version 26)对整理后的数据进行相关性分析、回归分析、创建模型和图表制作。预测模型的精度按韩鲁佳[20]的方法,以预测模型的标准误差与预测变量均值的比值计算和分析。

2 结果与分析

2.1 保育猪氮排泄量

纳入保育猪氮排泄量预测的文献共23篇,包含58条数据,581头生猪,Meta分析结果如表3所示。异质性检验结果显示I2≥96%,P<0.01,说明研究结果之间存在实质的统计学异质性,使用REM进行分析。各研究结果合并后,NI预测值为28.06 g/(d·头)[95% CI:25.56~30.56 g/(d·头)],FN预测值为4.23 g/(d·头)[95% CI:3.65~4.82 g/(d·头)],UN预测值为6.44 g/(d·头)[95% CI:5.42~7.47 g/(d·头)],NE预测值为10.71 g/(d·头)[95% CI:9.23~12.19 g/(d·头)]。Egger检验表明,保育猪的UN、NE存在显著发表偏倚(P<0.10),NI、FN无发表偏倚(P>0.10)。敏感性分析表明,当去除任一单项研究后,预测值的改变量均低于5%,表明本结果具有稳健性。
表3 保育猪氮排泄量倒方差法Meta分析结果

Table 3 Meta-analysis results of inverse variance method for nitrogen excretion in conserved pigs

分析指标
Analysis
indicators
异质性检验
Heterogeneity test
Meta分析结果
Meta analysis results/[g/(d·头)]
Egger检验
Egger test
I2/% P
P-value
预测值
Predicted value
95%置信区间
95% CI
P
P-value
敏感性
Sensitivity
NI 100 <0.01 28.06 25.56~30.56 0.284 9 <0.05
FN 100 <0.01 4.23 3.65~4.82 0.323 6 <0.05
UN 100 <0.01 6.44 5.42~7.47 0.021 9 <0.05
NE 96 <0.01 10.71 9.23~12.19 0.035 1 <0.05
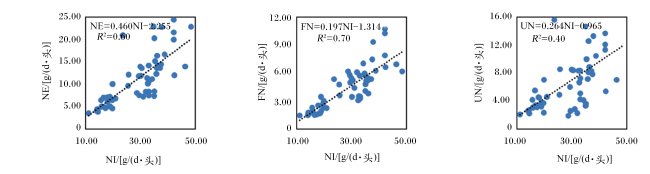
基于NI和BW建立保育猪的FN、UN和NE的预测模型。对各指标进行皮尔森相关系数分析,均呈极显著正相关(P<0.01),其中NI与FN的相关系数(r)=0.837,NI与UN的r=0.637,NI与NE的r=0.780,BW与FN的r=0.610,BW与UN的r=0.440,BW与NE的r=0.551。通过显著性检验(F检验)的回归模型如表4所示。F检验结果表明,各回归模型均在0.001水平处高度显著;t检验结果表明,以NI和BW为自变量来预测NE、FN和UN的二元线性回归模型中,BW的t检验均不显著。综合分析FN、UN和NE的各预测模型,最佳因子均为NI,因此保育猪的FN、UN和NE均基于NI进行预测,相关关系如图2所示。
表4 保育猪氮排泄量的预测模型与检验

Table 4 Model and test for predicting nitrogen excretion of nursery pigs

因变量
Dependent
variable/
[g/(d·头)]
自变量
Independent
variable
预测模型
Prediction
model
判定系数
R2
F检验
F test
t检验
t test
预测值的标
准误差
SE of
predicted
value
模型精度
Model
precision/
%
NE NI/[g/(d·头)] NE=0.460NI-2.255 0.601 <0.001 <0.001 0.657 6.10
BW/(kg/头) NE=0.494BW+1.96 0.291 <0.001 <0.001 0.871 8.07
NI/[g/(d·头)]、
BW/(kg/头)
NE=0.411NI+
0.127BW-3.129
0.607 <0.001 NI:<0.001
BW:0.174
0.797 7.37
FN NI/[g/(d·头)] FN=0.197NI-1.314 0.695 <0.001 <0.001 0.230 5.38
NI/[g/(d·头)]、
BW/(kg/头)
FN=0.172NI+
0.065BW-1.76
0.712 <0.001 NI:<0.001
BW:0.045
0.273 6.38
UN NI/[g/(d·头)] UN=0.264NI-0.965 0.395 <0.001 <0.001 0.569 8.75
FN/[g/(d·头)] UN=1.094FN+1.832 0.376 <0.001 <0.001 0.568 8.72
NI/[g/(d·头)]、
BW/(kg/头)
UN=0.24NI+
0.063BW-1.402
0.391 <0.001 NI:<0.001
BW:0.436
0.698 10.70

BW:屠宰体重 slaughtering body weight。表6表8同 the same as Table 6 and Table 8

图2 基于NI的保育猪氮排泄量预测模型

NI:摄入氮 nitrogen intake;NE:总氮排泄量 total nitrogen excretion;FN:粪氮 fecal nitrogen;UN:尿氮 urinary nitrogen。图3图4同 the same as Fig.3 and Fig.4

Fig.2 Prediction model of nitrogen excretion based on NI for nursery pigs

2.2 育肥前期猪氮排泄量

纳入育肥前期猪氮排泄量预测的文献共42篇,包含107条数据,895头生猪,Meta分析结果如表5所示。异质性检验结果显示I2=100%,P<0.01,说明研究结果之间存在实质的统计学异质性,使用REM进行分析。各研究结果合并后,NI预测值为43.46 g/(d·头)[95% CI:41.34~45.59 g/(d·头)],FN预测值为7.65 g/(d·头)[95% CI:6.89~7.82 g/(d·头)],UN为12.53 g/(d·头)[95% CI:11.32~13.73 g/(d·头)],NE预测值为19.95 g/(d·头)[95% CI:18.41~21.49 g/(d·头)]。Egger检验表明,育肥前期猪的NI、FN、UN存在显著发表偏倚(P<0.10),NE无发表偏倚(P>0.10)。敏感性分析表明,当去除任一单项研究后,预测值的改变量均低于5%,表明本结果具有稳健性。
表5 育肥前期猪氮排泄量倒方差法Meta分析结果

Table 5 Meta-analysis results of inverse variance method for nitrogen excretion of pre-fattening pigs

分析指标
Analysis
indicators
异质性检验
Heterogeneity test
Meta分析结果
Meta analysis results/[g/(d·头)]
Egger检验
Egger test
I2/% P
P-value
预测值
Predictive value
95%置信区间
95% CI
P
P-value
敏感性
Sensitivity
NI 100 <0.01 43.46 41.34~45.59 0.088 1 <0.05
FN 100 <0.01 7.65 6.89~7.82 0.680 8 <0.05
UN 100 <0.01 12.53 11.32~13.73 0.003 4 <0.05
NE 100 <0.01 19.95 18.41~21.49 0.153 7 <0.05
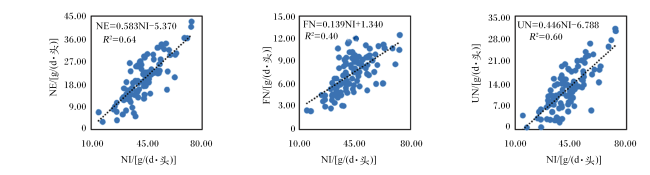
基于NI和BW建立育肥前期猪的FN、UN和NE的预测模型。皮尔森相关系数分析显示各指标均呈极显著正相关(P<0.01),其中NI与FN的r=0.637,NI与UN的r=0.777,NI与NE的r=0.804,BW与FN的r=0.267,BW与UN的r=0.333,BW与NE的r=0.341。通过F检验的回归模型如表6所示。F检验结果表明,各回归模型均在0.001水平处高度显著;t检验结果表明,以NI和BW为自变量来预测FN、UN和NE的二元线性回归模型中,BW的t检验均不显著。综合分析FN、UN和NE的各预测模型,最佳因子均为NI,因此育肥前期猪FN、UN和NE均基于NI来进行预测,相关关系见图3所示。
表6 育肥前期猪氮排泄量的预测模型与检验

Table 6 Model and test for predicting nitrogen excretion of pre-fattening pigs

因变量
Dependent
variable/
[g/(d·头)]
自变量
Independent
variable
预测模型
Prediction
model
判定系数
R2
F检验
F test
t检验
t test
预测值的
标准误差
SE of
predicted
value
模型精度
Model
precision/
%
NE NI/[g/(d·头)] NE=0.583NI-5.370 0.643 <0.001 <0.001 0.630 3.16
BW/(kg/头) NE=0.369BW+3.749 0.108 <0.001 <0.001 1.013 5.11
NI/[g/(d·头)]、
BW/(kg/头)
NE=0.561NI+
0.137BW-10.521
0.667 <0.001 NI:<0.001
BW:0.034
0.757 3.82
FN NI/[g/(d·头)] FN=0.139NI+1.340 0.400 <0.001 <0.001 0.245 3.32
NI/[g/(d·头)]、
BW/(kg/头)
FN=0.132NI+
0.032BW+0.255
0.403 <0.001 NI:<0.001
BW:0.217
0.304 4.10
UN NI/[g/(d·头)] UN=0.446NI-6.788 0.601 <0.001 <0.001 0.527 4.19
FN/[g/(d·头)] UN=1.602FN+0.778 0.364 <0.001 <0.001 0.678 5.39
NI/[g/(d·头)]、
BW/(kg/头)
UN=0.431NI+
0.104BW-10.832
0.636 <0.001 NI:<0.001
BW:0.048
0.621 4.99
图3 基于NI的育肥前期猪氮排泄量的预测模型

Fig.3 Prediction model of nitrogen excretion based on NI for pre-fattening pigs

2.3 育肥后期猪氮排泄量

纳入育肥后期猪氮排泄量预测的文献共33篇,包含86条数据,555头生猪,Meta分析结果如表7所示。异质性检验结果显示I2=100%,P<0.01,说明研究结果之间存在实质的统计学异质性,使用REM进行分析。各研究结果合并后,NI预测值为58.23 g/(d·头)[95% CI:55.72~60.75 g/(d·头)],FN预测值为8.70 g/(d·头)[95% CI:8.04~9.37 g/(d·头)],UN预测值为21.63 g/(d·头)[95% CI:19.93~23.33 g/(d·头)],NE预测值为30.34 g/(d·头)[95% CI:28.42~32.26 g/(d·头)]。Egger检验表明,育肥后期猪的UN、NE存在显著发表偏倚(P<0.10),NI、FN无发表偏倚(P>0.10)。敏感性分析表明,当去除任一单项研究后,预测值的改变量均低于5%,表明本结果具有稳健性。
表7 育肥后期猪氮排泄量倒方差法Meta分析结果

Table 7 Meta-analysis results of inverse variance method for nitrogen excretion in late-fattening pigs

分析指标
Analysis
indicators
异质性检验
Heterogeneity test
Meta分析结果
Meta analysis results/[g/(d·头)]
Egger检验
Egger test
I2/% P
P-value
预测值
Predicted value
95%置信区间
95% CI
P
P-value
敏感性
Sensitivity
NI 100 <0.01 58.23 55.72~60.75 0.144 5 <0.05
FN 100 <0.01 8.70 8.04~9.37 0.215 5 <0.05
UN 100 <0.01 21.63 19.93~23.33 0.038 2 <0.05
NE 100 <0.01 30.34 28.42~32.26 0.000 2 <0.05
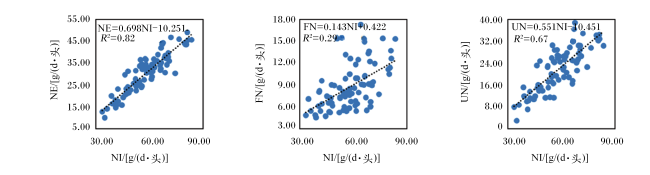
基于NI和BW建立育肥后期猪的FN、UN和NE的预测模型。皮尔森相关系数分析显示各指标均呈极显著正相关(P<0.01),其中NI与FN的r=0.542,NI与UN的r=0.818,NI与NE的r=0.907,BW与UN的r=0.331,BW与NE的r=0.277。通过F检验的回归模型如表8所示。F检验结果表明,各回归模型均在0.001水平处高度显著;t检验结果表明,以NI和BW为自变量来预测FN和NE的二元线性回归模型中,BW的t检验均不显著。综合分析FN、UN和NE的各预测模型,最佳因子均为NI,因此育肥后期猪FN、UN和NE均基于NI进行预测,相关关系如图4所示。
表8 育肥后期猪氮排泄量预测模型与检验

Table 8 Model and test for predicting nitrogen excretion of late-fattening pigs

因变量
Dependent
variable/
[g/(d·头)]
自变量
Independent
variable
预测模型
Prediction
model
判定系数
R2
F检验
F test
t检验
t test
预测值的
标准误差
SE of
predicted
value
模型精度
Model
precision/
%
NE NI/[g/(d·头)] NE=0.698NI-10.251 0.820 <0.001 <0.001 0.565 1.86
NI/[g/(d·头)]、
BW/(kg/头)
NE=0.681NI+
0.1BW-17.038
0.840 <0.001 NI:<0.001
BW:0.001
0.642 2.11
FN NI/[g/(d·头)] FN=0.143NI+0.422 0.285 <0.001 <0.001 0.245 3.32
NI/[g/(d·头)]、
BW/(kg/头)
FN=0.146NI-
0.024BW+2.029
0.287 <0.001 NI:<0.001
BW:0.273
0.463 5.31
UN NI/[g/(d·头)] UN=0.551NI-10.451 0.665 <0.001 <0.001 0.675 3.12
NI/[g/(d·头)]、
BW/(kg/头)
UN=0.53NI-
0.128BW-19.162
0.708 <0.001 NI:<0.001
BW:<0.001
0.759 3.50
图4 基于NI的育肥后期猪氮排泄量预测模型

Fig.4 Prediction model of nitrogen excretion based on NI for late-fattening pigs

3 讨论

3.1 猪场粪肥氮养分产生量

国内外关于粪肥氮养分产生量的研究已有报道[8,14,21-26]。汪开英等[21]测定的产污系数中,保育猪NE为11.2 g/(d·头);苏文幸[22]测定的产污系数中,保育猪NE为9.8~12.7 g/(d·头);何志平等[23]测定的产污系数中,保育猪NE为5.31~7.03 g/(d·头);谢飞等[24]测定的产污系数中,保育猪NE为(15.09±3.08) g/(d·头);董红敏等[25]测定的产污系数中,保育猪NE为(20.4±5.7) g/(d·头);《第一次全国污染源普查畜禽养殖业源产排污系数手册》[8]推荐的保育猪NE为8.0~23.4 g/(d·头)。本研究中,保育猪NE预测值为10.71 g/(d·头),与前人[8,21-22,24]分析和测定的NE数值基本一致。谢飞等[24]测定的产污系数中,育肥猪NE为(20.04±4.99) g/(d·头);董红敏等[25]测定的产污系数中,育肥猪NE为(33.2±10.4) g/(d·头);汪开英等[21]测定的产污系数中,育肥猪NE为30.44 g/(d·头);苏文幸[22]测定的产污系数中,育肥猪NE为23.8~36.7 g/(d·头);何志平[23]测定的产污系数中,育肥猪NE为8.80~11.65 g/(d·头);杨金升等[26]测定的产污系数中,育肥猪NE为33.23 g/(d·头);美国ASAE[14]推荐的育肥猪NE为39.17 g/(d·头);《第一次全国污染源普查畜禽养殖业源产排污系数手册》[8]推荐的育肥猪NE为14.0~64.0 g/(d·头)。本研究中,育肥前期猪NE预测值为19.95 g/(d·头),育肥后期猪NE预测值为30.34 g/(d·头),育肥前期猪NE与前人分析和测定的NE数值[8,24-25]基本一致,育肥后期猪NE也与前人[8,21,25-26]分析和测定的NE数值基本一致。各研究之间的差异可能与生猪体重阶段[23]和环境条件[24]等因素有关。

3.2 粪肥氮养分产生量预测模型

关于生长育肥猪NE的预测模型已有报道[15,27],但基于生猪各生长阶段摄入指标的预测模型还未见报道。保育猪阶段,本研究用NI与BW作为输入变量,基于NI预测NE精度最高(R2=0.60,模型精度为6.10%),基于NI预测FN精度最高(R2=0.70,模型精度为5.38%),基于NI预测UN精度最高(R2=0.40,模型精度为8.75%),预测值均在《第一次全国污染源普查畜禽养殖业源产排污系数手册》[8]公布的NE范围内。本研究所得保育猪阶段预测值较杨增玲[15]所得预测值高5%,原因是其模型中生猪体重均在28 kg以上,更适用于生长育肥猪,生猪保育阶段比育肥阶段的消化率低,本研究更符合保育猪的代谢预测。育肥猪NI和NE之间存在显著相关关系,这与杨增玲[15]的发现一致。育肥前期阶段,本研究用NI与BW作为输入变量,基于NI预测NE精度最高(R2=0.64,模型精度为3.16%),基于NI预测FN精度最高(R2=0.40,模型精度为3.32%),基于NI预测UN精度最高(R2=0.60,模型精度为4.19%);育肥后期阶段,本研究用NI与BW作为输入变量,基于NI预测NE精度最高(R2=0.82,模型精度为1.86%),基于NI预测UN精度最高(R2=0.67,模型精度为3.12%),且预测值均在《第一次全国污染源普查畜禽养殖业源产排污系数手册》[8]产污系数推荐范围内。本研究育肥前期和育肥后期所得预测值与杨增玲[15]所得预测值接近,且本研究建立的育肥前期和育肥后期预测模型较其预测模型精度更佳(3.16% vs. 9.3%,1.86% vs. 9.3%)。本研究所得NE预测值与NRC(2012)[27]提供的软件对25~125 kg生长育肥猪NE的计算值相近,且预测值不依赖于初始体重和出栏体重,便于更准确地掌握短时间内的NE。

3.3 本研究的局限性

现有文献报道中针对相同或相近生猪基因品种、气候季节温度、摄入营养组成和饲养管理方式等因素下的研究较少,这些因素均会对氮排泄量预测模型存在一定程度的影响[28-30],又因数据较少未开展亚组分析,无法明确异质性的来源,但敏感性分析表明结果稳定可靠,异质性原因考虑是试验生猪品种不同或开展试验的季节不同;本研究纳入的生猪无地方品种,试验地区为国内外各大区,饲粮营养水平参差不齐,采样时间各有所异,这些均不同程度地造成纳入文献数据的异质性。由于只检索了公开发表的最近21年的中、英文文献,可能存在文献收录不全而导致的发表偏倚;本研究只纳入了以玉米、豆粕为主的典型饲粮条件下常规饲养的数据,有效降低了因饲养管理带来的异质性。随着以后相关研究的文献数量增多,可以通过不断增加样本数据量来提高Meta分析结果的准确性。

4 结论

通过Meta分析得出了生猪各生长阶段的NE:保育猪NE预测值为10.71 g/(d·头)[95% CI:9.23~12.19 g/(d·头)],育肥前期猪NE预测值为19.95 g/(d·头)[95% CI:18.41~21.49 g/(d·头)],育肥后期猪NE预测值为30.34 g/(d·头)[95% CI:28.42~32.26 g/(d·头)]。基于NI建立生猪各生长阶段NE的预测模型:保育猪NE=0.460NI-2.255(R2=0.60),育肥前期猪NE=0.583NI-5.370(R2=0.64),育肥后期猪NE=0.698NI-10.251(R2=0.82)。
[1]
WU L T, ZHANG X X, TANG Z R, et al. Low-protein diets decrease porcine nitrogen excretion but with restrictive effects on amino acid utilization[J]. Journal of Agricultural and Food Chemistry, 2018, 66(31):8262-8271.

DOI PMID

[2]
BAI Z H, MA L, QIN W, et al. Changes in pig production in China and their effects on nitrogen and phosphorus use and losses[J]. Environmental Science & Technology, 2014, 48(21):12742-12749.

DOI

[3]
KIM S W, CHEN H Y, PARNSEN W. Regulatory role of amino acids in pigs fed on protein-restricted diets[J]. Current Protein & Peptide Science, 2019, 20(2):132-138.

[4]
LIU X J, XU W, DU E Z, et al. Environmental impacts of nitrogen emissions in China and the role of policies in emission reduction[J]. Philosophical Transactions.Series A,Mathematical,Physical,and Engineering Sciences, 2020, 378(2183):20190324.

[5]
HUHTANEN P, HRISTOV A N. A meta-analysis of the effects of dietary protein concentration and degradability on milk protein yield and milk N efficiency in dairy cows[J]. Journal of Dairy Science, 2009, 92(7):3222-3232.

DOI PMID

[6]
BINDELLE J, BULDGEN A, DELACOLLETTE M, et al. Influence of source and concentrations of dietary fiber on in vivo nitrogen excretion pathways in pigs as reflected by in vitro fermentation and nitrogen incorporation by fecal bacteria[J]. Journal of Animal Science, 2009, 87(2):583-593.

DOI

[7]
ZHENG C H, LIU Y, BLUEMLING B, et al. Modeling the environmental behavior and performance of livestock farmers in China:an ABM approach[J]. Agricultural Systems, 2013, 122:60-72.

DOI

[8]
第一次全国污染源普查资料编纂委员会. 污染源普查数据集[M]. 北京: 中国环境科学出版社, 2011:10-12.

Data Compilation Committee of the First National Pollution Sources Census. Pollution source census data set[M]. Beijing: China Environmental Press, 2011:10-12. (in Chinese)

[9]
RIST V T S, WEISS E, EKLUND M, et al. Impact of dietary protein on microbiota composition and activity in the gastrointestinal tract of piglets in relation to gut health:a review[J]. Animal, 2013, 7(7):1067-1078.

DOI

[10]
NIETO R, LARA L, BAREA R, et al. Response analysis of the Iberian pig growing from birth to 150kg body weight to changes in protein and energy supply[J]. Journal of Animal Science, 2012, 90(11):3809-3820.

DOI

[11]
AGUINAGA M A, NIETO R, LARA L, et al. Effects of dietary protein-to-energy ratio on rate of growth,protein deposition and tissue composition of pure Iberian boars prior to extensive production[J]. Journal of Animal Science, 2017, 95(2):855-865.

[12]
邓盾, 王刚, 陈卫东, 等. 低蛋白日粮在不同生长阶段猪上的应用研究进展[J]. 广东农业科学, 2019, 46(4):101-108.

DENG D, WANG G, CHEN W D, et al. Research progress on the application of low protein diets in pigs at different growth stages[J]. Guangdong Agricultural Sciences, 2019, 46(4):101-108. (in Chinese)

[13]
CLANTON C J, GILBERTSON C B, SCHULTE D D, et al. Model for predicting the effect of nitrogen intake,body mass,and dietary calcium and phosphorus on manure nitrogen content[J]. Transactions of the ASAE, 1988, 31(1):208-214.

DOI

[14]
ASABE. Manure production and characteristics:ASAE D384.2[S]. St. Joseph: American Society of Agricultural and Biological Engineers, 2005.

[15]
杨增玲. 生长肥育猪粪便主要成分含量快速预测方法和模型的研究[D]. 博士学位论文. 北京: 中国农业大学, 2005:45-55.

YANG Z L. Rapid prediction methods and models for the nutrient contents of fattening pig manure[D]. Ph.D.Thesis. Beijing: China Agricultural University, 2005:45-55. (in Chinese)

[16]
SAUVANT D, SCHMIDELY P, DAUDIN J J, et al. Meta-analyses of experimental data in animal nutrition[J]. Animal, 2008, 2(8):1203-1214.

DOI PMID

[17]
GRANT J, HUNTER A. Measuring inconsistency in knowledgebases[J]. Journal of Intelligent Information Systems, 2006, 27(2):159-184.

DOI

[18]
FABIO B, ALESSANDRO P, PIETER A K, et al. Statistical Primer:heterogeneity, random-or fixed-effects model analyses?[J]Interactive CardioVascular and Thoracic Surgery, 2018, 27(3):317-321.

DOI

[19]
EGGER M, DAVEY SMITH G, SCHNEIDER M, et al. Bias in meta-analysis detected by a simple,graphical test[J]. BMJ, 1997, 315(7109):629-634.

DOI

[20]
韩鲁佳. 动物粪便营养成分含量的估算[J]. 农业工程学报, 1996, 12(3):143-147.

HAN L J. Estimating nutrient content of animal sluries[J]. Transactions of the Chinese Society of Agricultural Engineering, 1996, 12(3):143-147. (in Chinese)

[21]
汪开英, 刘健, 陈小霞, 等. 浙江省畜禽业产排污测算与土地承载力分析[J]. 应用生态学报, 2009, 20(12):3043-3048.

WANG K Y, LIU J, CHEN X X, et al. Pollutant production and discharge from livestock and poultry industries and land carrying capacity in Zhejiang Province[J]. Chinese Journal of Applied Ecology, 2009, 20(12):3043-3048. (in Chinese)

[22]
苏文幸. 生猪养殖业主要污染源产排污量核算体系研究[D]. 硕士学位论文. 长沙: 湖南师范大学, 2012:30-35.

SU W X. Study on accounting system of the amount of pollutants producing and pollutants discharge in the main pollution sources of live pig farming industry[D]. Master’s Thesis. Changsha: Hunan Normal University, 2012:30-35. (in Chinese)

[23]
何志平, 曾凯, 李正确, 等. 四川规模猪场产排污系数测定[J]. 中国沼气, 2010, 28(4):10-14.

HE Z P, ZENG K, LI Z Q, et al. Measurement of pollutants producing and discharging coefficient on large scale pig farms in Sichuan[J]. China Biogas, 2010, 28(4):10-14. (in Chinese)

[24]
谢飞, 曹磊, 王震, 等. 江苏省太湖地区畜禽业产排污测算[J]. 水土保持通报, 2014, 34(2):128-133.

XIE F, CAO L, WANG Z, et al. Estimation of pollutant production and discharge from livestock and poultry industries in Taihu lake region[J]. Bulletin of Soil and Water Conservation, 2014, 34(2):128-133. (in Chinese)

[25]
董红敏, 朱志平, 黄宏坤, 等. 畜禽养殖业产污系数和排污系数计算方法[J]. 农业工程学报, 2011, 27(1):303-308.

DONG H M, ZHU Z P, HUANG H K, et al. Pollutant generation coefficient and discharge coefficient in animal production[J]. Transactions of the Chinese Society of Agricultural Engineering, 2011, 27(1):303-308. (in Chinese)

[26]
杨金升, 袁雪竹, 张宏伟, 等. 基于日平均养殖量的畜禽养殖排污系数法的改进[J]. 城市环境与城市生态, 2012, 25(2):27-30.

YANG J S, YUAN X Z, ZHANG H W, et al. Improved discharge coefficient method for calculating livestock and poultry pollution based on a daily average breeding amount[J]. Urban Environment & Urban Ecology, 2012, 25(2):27-30. (in Chinese)

[27]
National Research Council. Nutrient requirements of swine[M]. 11th ed. Washington, D.C.: The National Academies Press, 2012.

[28]
CAMPOS P H R F, LABUSSIÈRE E, HERNÁNDEZ-GARCÍA J, et al. Effects of ambient temperature on energy and nitrogen utilization in lipopolysaccharide-challenged growing pigs[J]. Journal of Animal Science, 2014, 92(11):4909-4920.

DOI PMID

[29]
POMAR C, ANDRETTA I, REMUS A. Feeding strategies to reduce nutrient losses and improve the sustainability of growing pigs[J]. Frontiers in Veterinary Science, 2021, 8:742220.

DOI

[30]
刘景, 缪伏荣, 方桂友, 等. 两种阶段育肥法对生长肥育猪粪氮磷排放量的影响[J]. 福建农业学报, 2019, 34(6):678-683.

LIU J, MIAO F R, FANG G Y, et al. Fecal N and P of pigs at final growth stage under different feeding programs[J]. Fujian Journal of Agricultural Sciences, 2019, 34(6):678-683. (in Chinese)

Outlines

/