Original article

A Study of Prediction Model for Net Energy Requirement of Wenchang Hens during 61 to 120 Days of Age

  • XU Xiaojing , 1, 2, 3 ,
  • ZHANG Xuli 4 ,
  • ZHAO Shaomeng 3 ,
  • WEI Limin 1, 2 ,
  • DONG Ruiling 5 ,
  • ZHAO Guiping 1, 2, 3 ,
  • ZHANG Minhong 3 ,
  • FENG Jinghai , 3, **
Expand
  • 1 Sanya Institute, Hainan Academy of Agricultural Sciences (Hainan Experimental Animal Research Center),Sanya 572025, China
  • 2 Institute of Animal Science and Veterinary Medicine, Hainan Academy of Agricultural Science, Haikou 571100, China
  • 3 State Key Laboratory of Animal Nutrition, Institute of Animal Sciences, Chinese Academy of Agricultural Sciences, Beijing 100193, China
  • 4 Hainan (Tanniu) Wenchang Chicken Co., Ltd., Haikou 570204, China
  • 5 College of Animal Science, Shanxi Agricultural University, Jinzhong 030801, China
** associate professor, E-mail:

*Contributed equally

Received date: 2023-05-08

  Online published: 2023-11-12

Abstract

The prediction models of net energy requirement for growth (NEg), net energy requirement for laying eggs (NEe) and net energy requirement for maintenance (NEm) of Wenchang hens during 61 to 120 days of age were estimated by factorial method, and establishing the prediction models for net energy requirement (NEr), which provided scientific basis for efficient breeding of Wenchang hens. In experiment 1, one hundred and eighty 63-day-old healthy Wenchang hens with similar body weight [(928.06±3.06) g] were divided into 1 group with 6 replicates and 30 hens in each replicate. Hens were feeding in cages until 119 days of age. The body weight and net body energy of Wenchang hens were measured every week, and establish a linear regression model to calculate the NEg of Wenchang hens. The average net energy content of eggs produced by Wenchang hens was determined, which was the NEe. In experiment 2, the NEm of Wenchang hens was investigated in two stages (61 to 90 days of age and 91 to 120 days of age), a total of 240 sixty-one-day-old and ninety-one-day-old healthy Wenchang hens with similar body weight [(824.17±2.82) g and (1 336.67±10.90) g] were randomly divided into 4 groups (free feeding group and 20%, 40% and 60% restricted feeding groups) with 6 replicates in each group and 10 hens in each replicate. Hens in the four groups were fed the same metabolic diet. The experiment lasted for 30 days in each stage, and the apparent metabolizable energy (AME) of the diets under different feeding levels was determined at the middle stage of the experiment. At the beginning and end of each stage, the deposited energy (RE), metabolizable energy intake (MEi) and heat production (HP) of Wenchang chickens were measured, and a regression model between the logarithm of HP and MEi was established to calculate the NEm of Wenchang chickens. The results of experiment 1 showed that the NEg were 19.87 and 25.05 kJ/g of Wenchang hens during 64 to 91 days of age and 92 to 119 days of age, respectively. The Wenchang chickens began laying at 105 days of age, and the NEe was 6.78 kJ/g. The results of experiment 2 showed that during 61 to 90 days of age and 91 to 120 days of age, the AME of 40% and 60% restricted feeding groups was significantly higher than that of the free feeding group (P<0.05); the Mei, RE and HP were significantly decreased with the feeding levels decreased (P<0.05). There was a significant logarithmic regression relationship between MEi and HP (R2=0.93 and 0.88, P<0.05), and the NEm of Wenchang hens during 61 to 90 days of age and 91 to 120 days of age were 366.44 and 351.56 kJ/(BW0.75·d), respectively. According to the calculated NEg, NEe and NEm, the prediction models of NEr of Wenchang hens were established: NEr(kJ/d)=366.44×BW0.75+19.87×ADG (61 to 90 days of age) and Ner (kJ/d)=351.56×BW0.75+25.05×ADG+6.78×AEP (91 to 120 days of age); which BW0.75 was metabolic body weight, ADG was average daily gain, and AEP was average egg production. The model can be used to dynamically predict the NEr of Wenchang hens according to body weight, ADG and AEP.

Cite this article

XU Xiaojing , ZHANG Xuli , ZHAO Shaomeng , WEI Limin , DONG Ruiling , ZHAO Guiping , ZHANG Minhong , FENG Jinghai . A Study of Prediction Model for Net Energy Requirement of Wenchang Hens during 61 to 120 Days of Age[J]. Chinese Journal of Animal Nutrition, 2023 , 35(11) : 7076 -7085 . DOI: 10.12418/CJAN2023.644

能量是家禽维持基本生命活动以及生长发育的基础,准确测定家禽的能量需要是实现精准饲养的必要条件。与代谢能体系相比,净能体系可以更准确地描述饲料的有效能值以及家禽的需要量[1],在养殖生产中使用净能体系可以降低饲料成本以及废弃物的排放[2-3]。近年来养猪生产逐渐用净能体系替代消化能体系[4],家禽的净能需要量(NEr)也受到越来越多的关注。家禽能量需要的研究一般采用剂量反应法或者析因法[5]。析因法通过测定家禽能量的维持、生长和产蛋需要量,最终构建出可以预测家禽每日能量需要量的动态模型,这是开展家禽精准饲养的基础[6]。目前研究人员已经建立了肉种鸡[7]、肉鸭[8]、肉鸡[9]和鹌鹑[10-12]等家禽NEr的预测模型。
有关黄羽肉鸡能量需要量预测模型的研究相对匮乏。朱中胜[13]和李龙[14]分别建立了皖南黄鸡和清远麻鸡代谢能需要量的预测模型。文昌鸡是我国优良的地方品种,由于消费习惯的原因,文昌鸡的养殖以母鸡为主。文昌鸡的养殖周期长(15~17周),本课题组前期测定了1~60日龄文昌鸡母鸡的NEr,发现31~60日龄文昌鸡的维持净能需要量(NEm)比1~30日龄提高了37%,生长净能需要量(NEg)提高了50%。由此可见,不同生长阶段家禽的NEr差异很大。在生长后期文昌鸡逐渐达到性成熟,105日龄后文昌鸡逐渐开始产蛋,文昌鸡生长后期的NEr可能与生长前期存在较大差别,目前61~120日龄文昌鸡母鸡的NEr尚不清楚。因此,本研究采用析因法,通过梯度饲喂结合比较屠宰法,分别研究61~90日龄和91~120日龄文昌鸡母鸡的NEr,比较不同阶段文昌鸡母鸡NEm和NEg的变化,建立文昌鸡61~90日龄和91~120日龄NEr的预测模型,为文昌鸡的高效养殖提供可靠的数据支撑。

1 材料与方法

1.1 试验设计

本研究通过2项试验分别研究文昌鸡母鸡的NEg、产蛋净能需要量(NEe)和NEm。试验1:采用完全随机试验设计,选择体重[(928.06±3.06) g]接近的63日龄健康文昌鸡母鸡180只[由海南(潭牛)文昌鸡股份有限公司提供],分为1个组,6个重复,每个重复30只鸡。常规饲养至119日龄,每周测定文昌鸡母鸡的生产性能、体能(BE)和体组成,研究文昌鸡的NEg和NEe。试验2:采用完全随机试验设计,分2个阶段(61~90日龄和91~120日龄)研究文昌鸡母鸡的NEm。分别选择61[体重(824.17±2.82) g]和91日龄[体重(1 336.67±10.90) g]的健康文昌鸡母鸡240只,随机分为4个组,每组6个重复,每个重复10只鸡。4个组分别为自由采食组及20%、40%和60%限饲组,各限饲组分别按照自由采食组的80%、60%和40%饲喂。2项试验于2021年11月在海南省农业科学院畜牧兽医研究所澄迈县试验基地进行。

1.2 试验饲粮与饲养管理

参照《黄羽肉鸡营养需要量》(NY/T 3645—2020)配制玉米-豆粕型基础饲粮,基础饲粮组成及营养水平见表1。试验1的文昌鸡饲喂基础饲粮,自由采食和饮水,饲养至119日龄屠宰。试验2在基础饲粮中加入0.5%的二氧化钛(TiO2),配制成代谢饲粮;2个阶段试验全程饲喂代谢饲粮,每天称量自由采食组的采食量,3个限饲组根据前1天自由采食组的采食量,分别按照自由采食组的80%、60%和40%饲喂。2个试验所用文昌鸡均按照海南(潭牛)文昌鸡股份有限公司的养殖规范进行免疫及日常管理。
表1 基础饲粮组成及营养水平(风干基础)

Table 1 Composition and nutrient levels of basal diets (air-dry basis) %

项目
Items
61~90日龄
61 to 90
days of age
91~120日龄
91 to 120
days of age
原料Ingredients
玉米Corn 66.66 69.23
豆粕Soybean meal 25.70 23.65
大豆油Soybean oil 3.91 3.50
食盐NaCl 0.28 0.28
磷酸氢钙CaHPO4 1.16 1.10
石粉Limestone 0.96 0.91
预混料Premix1) 1.00 1.00
DL-蛋氨酸DL-Met 0.10 0.09
L-赖氨酸盐酸盐L-Lys·HCl 0.08 0.09
氯化胆碱Choline chloride 0.15 0.15
合计Total 100.00 100.00
营养水平Nutrients levels2)
表观代谢能AME/(MJ/kg) 13.24 13.17
粗蛋白质CP 16.50 15.80
钙Ca 0.70 0.66
有效磷AP 0.27 0.25
赖氨酸Lys 0.81 0.78
蛋氨酸Met 0.34 0.33
苏氨酸Thr 0.57 0.55
色氨酸Try 0.14 0.13

1)预混料为每千饲粮提供 The premix provided the following per kg of diets:VA 10 000 IU,VD3 3 400 IU,VE 16 IU,VK3 2.0 mg,VB1 2.0 mg,VB2 6.4 mg,VB6 2.0 mg,VB12 0.012 mg,泛酸钙 calcium pantothenate 10 mg,烟酸 nicotinic acid 26 mg,叶酸 folic acid 1 mg,生物素 biotin 0.1 mg,胆碱 choline 500 mg,Zn (ZnSO4·7H2O) 40 mg,Fe (FeSO4·7H2O) 80 mg,Cu (CuSO4·5H2O) 8 mg,Mn (MnSO4·H2O) 80 mg,I (KI) 0.35 mg,Se (Na2SeO3) 0.15 mg。

2)表观代谢能和粗蛋白质为实测值,其余均为计算值。AME and CP were measured values, while the others were calculated values.

1.3 样品采集及测定指标

1.3.1 生产性能及BE、体组成的测定

试验1:每周以重复为单位测定文昌鸡的体重和采食量,称重后每个重复选择2只接近平均体重(ABW)的试验鸡,二氧化碳(CO2)致死。参考李龙[14]的方法处理样品,热水浸烫、拔毛,测定羽毛和全胴体的重量,胴体2次搅碎,65 ℃烘干72 h,测定羽毛和胴体的含水量。烘干样品粉碎,参照ISO 9831—1998的方法测定羽毛和胴体样品中的能量,参照GB/T 6432—2018和GB/T 6433—2006的方法测定样品中粗蛋白质和粗脂肪含量。计算羽毛和胴体中的净能、蛋白质和脂肪含量,两者之和为文昌鸡的BE、体蛋白质和体脂肪含量。15周龄后文昌鸡母鸡开始产蛋,记录每个重复的产蛋率和产蛋量,将每个重复所产鸡蛋合并,称重后将全蛋打碎匀浆,65 ℃烘干72 h,测定鸡蛋的含水量和净能,计算鲜蛋的平均净能,即为NEe。
试验2:以重复为单位测定文昌鸡的体重和采食量,计算试验期文昌鸡的ABW、平均日增重(ADG)、平均日采食量(ADFI)和料重比(F/G)。在试验开始时取12只接近ABW的文昌鸡,在试验结束时每个重复选择2只接近ABW的试验鸡,CO2致死,测定羽毛和胴体的重量和能量,计算试验开始和结束时文昌鸡的BE,测定方法同上。试验末的BE减去试验初始的BE即为文昌鸡试验期间的沉积能(RE)。15周龄后文昌鸡母鸡开始产蛋,记录每个重复的产蛋率和产蛋量,按照上述方法测定鸡蛋的含水量和净能,计算每个重复总的产蛋净能(EE)。

1.3.2 饲粮表观代谢能(AME)的测定

试验2分别在每个阶段的中期(即74、108日龄),以重复为单位,连续收集3 d排泄物,测定饲粮和排泄物中的总能和TiO2含量,计算出不同限饲水平下的饲粮AME,计算公式如下:
饲粮AME(kJ/kg)=饲料总能×[1-(饲粮中指示剂含量/粪中指示剂含量)×(粪中能量含量/饲粮中能量含量)]。

1.4 文昌鸡母鸡NEg、NEe和NEm的计算公式和NEr预测模型的建立

参考Farrell[15]的方法,建立文昌鸡ABW和BE的线性回归方程:BE=a+b×ABW,其中斜率b即为NEg,单位为每克增重所需的净能(kJ/g)。试验1测定的鲜蛋平均净能即为NEe,单位为每产1 g鸡蛋所需的净能值(kJ/g)。根据试验2测定的AME和ADFI,计算代谢能摄入量(MEi),减去文昌鸡的RE和EE,得出不同饲喂水平下文昌鸡的产热量(HP):HP=MEi-RE-EE。参照Lofgreen等[16]的方法,建立HP的对数和MEi之间的回归模型:lg(HP)=a+b×MEi,当MEi=0时HP即为文昌鸡的NEm,单位为每千克代谢体重每天所需的维持净能值[kJ/(BW0.75·d)]。最终根据得出的NEg、NEe和NEm,建立文昌鸡NEr的预测模型:
NEr(kJ/d)=NEm×BW0.75+NEg×ADG+NEe×AEP。
式中:NEm为维持净能需要量;BW0.75为代谢体重;NEg为生长净能需要量;ADG为平均日增重;NEe为产蛋净能需要量;AEP为平均产蛋量。

1.5 数据统计和分析

使用SPSS 26.0统计软件中的one-way ANOVA程序进行单因素方差分析,分析不同周龄或不同饲喂水平对文昌鸡生产性能、能量平衡及饲粮AME的影响。方差分析显著时进行Duncan氏法多重比较,P<0.05为差异显著标准。使用SPSS 26.0统计软件中的线性回归模块分析回归模型的显著性,因变量和自变量之间的相关性用决定系数(R2)表示,P<0.05表明回归模型具有统计学意义。使用GraphPad Prism 8软件绘图。

2 结果与分析

2.1 9~17周龄文昌鸡母鸡生产性能和体组成的变化

表2可以看出,不同周龄文昌鸡的生产性能存在显著变化(P<0.05)。随周龄的增加,文昌鸡的ABW显著升高(P<0.05),17周龄时达到最大值。10、11、12、14和15周龄的ADG显著高于16、17周龄(P<0.05)。14、15周龄ADFI显著高于10、11、12、13周龄(P<0.05)。17周龄的F/G显著高于10、11、12、13、14、15周龄(P<0.05)。文昌鸡在15周龄时开产,17周龄的产蛋率和平均产蛋量显著高于15、16周龄(P<0.05)。
表2 不同周龄文昌鸡母鸡的生产性能

Table 2 Performance of Wenchang hens at different weeks of age

项目
Items
平均体重
ABW/g
平均日增重
ADG/g
平均日采食量
ADFI/g
料重比
F/G
产蛋率
EPR/%
平均产蛋量
AEP/g
周龄Weeks of age
9 945.1i
10 1 080.3h 19.32ab 78.84d 4.14c
11 1 224.1g 20.54a 82.69d 4.05c
12 1 343.3f 17.03ab 90.20bc 5.38bc
13 1 451.8e 15.50bc 88.14c 5.73bc
14 1 561.5d 18.29ab 96.60a 5.38bc
15 1 706.2c 18.09ab 98.05a 5.51bc 3.12b 1.11b
16 1 788.6b 11.78cd 94.60ab 9.98ab 4.89b 1.22b
17 1 863.5a 9.35d 94.67ab 14.39a 14.38a 4.19a
均值标准误SEM 34.8 3.30 4.14 4.22 5.03 1.62
PP-value <0.01 <0.01 <0.01 <0.01 0.03 0.01

同列数据肩标不同小写字母表示差异显著(P<0.05),相同或无字母表示差异不显著(P>0.05)。下表同。

In the same column, values with different small letter superscripts mean significant difference (P<0.05), while with the same or no letter superscripts mean no significant difference (P>0.05). The same as below.

表3可以看出,不同周龄文昌鸡的BE和体组成存在显著变化(P<0.05)。随周龄的增加,文昌鸡的BE逐渐升高,16、17周龄的BE显著高于9、10、11、12、13、14、15周龄(P<0.05)。16、17周龄的BE和体蛋白质含量显著高于9、10、11、12、13、14周龄(P<0.05),13、14、15、16、17周龄的体脂肪含量显著高于9、10、11、12周龄(P<0.05)。其中,13周龄时文昌鸡的BE含量较9周龄时增加了37%(13.75 kJ/g vs. 10.06 kJ/g),17周龄时文昌鸡的BE含量较13周龄时增加了14%(15.66 kJ/g vs. 13.75 kJ/g);9~13周龄BE含量的快速增加主要与体脂肪的沉积有关,在这一阶段文昌鸡体蛋白质含量无显著变化(P>0.05),而体脂肪含量增加了60%;13~17周龄BE含量的增加是体蛋白质和体脂肪沉积共同促进的,在这一阶段文昌鸡体蛋白质含量增加了15%,体脂肪含量增加了17%。
表3 不同周龄文昌鸡母鸡的体组成

Table 3 Body composition of Wenchang hens at different weeks of age

项目
Items
体能
BE/MJ
体能含量
BE content/(kJ/g)
体蛋白质含量
Body protein content/(g/g)
体脂肪含量
Body lipid content/(g/g)
周龄Weeks of age
9 9.51g 10.06f 0.20c 0.15e
10 11.90f 11.01e 0.20c 0.18d
11 13.89e 11.35e 0.21bc 0.18cd
12 16.60d 12.37d 0.20c 0.21c
13 19.97c 13.75c 0.20c 0.24b
14 20.56c 13.17cd 0.20c 0.24b
15 25.72b 15.06b 0.23ab 0.26ab
16 28.67a 16.03a 0.23a 0.26ab
17 29.19a 15.66ab 0.23a 0.28a
均值标准误SEM 1.26 0.77 0.02 0.03
PP-value <0.01 <0.01 <0.01 <0.01

2.2 文昌鸡母鸡的NEg

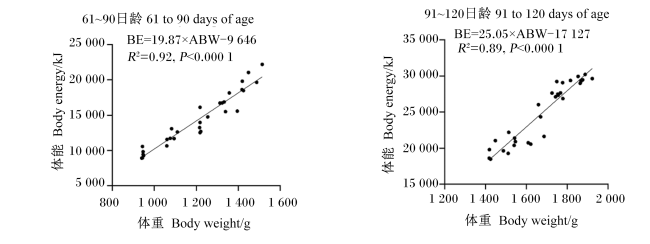
随周龄的增加,文昌鸡的ABW和BE均逐渐升高。分别建立61~90日龄和91~120日龄文昌鸡BE和ABW之间的线性回归模型(图1)。经F检验,2个线性回归模型均达到显著水平(P<0.05),R2分别为0.92和0.89。线性回归模型的斜率即为NEg,分别为19.87和25.05 kJ/g,表明试验后期文昌鸡的NEg明显升高。
图1 文昌鸡母鸡体能与平均体重之间的线性回归分析

Fig.1 Linear regression analysis between BE and ABW of Wenchang hens

2.3 文昌鸡母鸡的NEe

文昌鸡在15周龄时开始产蛋,15~17周龄一共收集、测定了151枚鸡蛋的净能值,平均每克鸡蛋为6.78 kJ,即为文昌鸡的NEe。

2.4 饲喂水平对文昌鸡母鸡生产性能和能量平衡的影响

表4可以看出,在61~90日龄和91~120日龄,随着饲喂水平的降低,文昌鸡的ABW、ADG和ADFI显著降低(P<0.05)。在61~90日龄,60%限饲组的F/G显著高于自由采食组和20%、40%限饲组(P<0.05);在91~120日龄,60%限饲组的ADG为负值,无法计算F/G,但40%限饲组的F/G仍显著高于自由采食组和20%限饲组(P<0.05)。饲喂水平对91~120日龄文昌鸡的产蛋率和平均产蛋量无显著影响(P>0.05);从数值上看,60%限饲组的产蛋率和产蛋量最低。
表4 饲喂水平对文昌鸡母鸡生产性能的影响

Table 4 Effects of feeding level on performance of Wenchang hens

项目
Items
平均体重
ABW/g
平均日增重
ADG/g
平均日采食量
ADFI/g
料重比
F/G
产蛋率
EPR/%
平均产蛋量
AEP/g
61~90日龄61 to 90 days of age
自由采食组Free feeding group 1 424.3a 20.62a 82.66a 4.02b
20%限饲组20% restricted feeding group 1 294.7b 16.32b 66.10b 4.05b
40%限饲组40% restricted feeding group 1 110.1c 10.22c 49.57c 4.90b
60%限饲组60% restricted feeding group 894.0d 2.96d 33.05d 11.77a
均值标准误SEM 25.9 0.84 1.22 1.73
PP-value <0.01 <0.01 <0.01 <0.01
91~120日龄91 to 120 days of age
自由采食组Free feeding group 1 764.6a 14.90a 95.51a 6.48b 2.41 0.64
20%限饲组20% restricted feeding group 1 653.8b 11.10b 75.37b 6.80b 3.02 0.79
40%限饲组40% restricted feeding group 1 490.7c 5.91c 56.52c 9.77a 2.47 0.62
60%限饲组60% restricted feeding group 1 285.6d -0.99d 37.68d 1.42 0.33
均值标准误SEM 37.0 1.15 1.36 1.00 1.57 0.39
PP-value <0.01 <0.01 <0.01 <0.01 0.32 0.23
表5可以看出,在61~90日龄和91~120日龄,40%和60%限饲组的AME显著高于自由采食组(P<0.05);随着饲喂水平的降低,MEi、RE和HP均显著降低(P<0.05)。在91~120日龄,60%限饲组的RE为负值。饲喂水平对91~120日龄文昌鸡的产蛋净能无显著影响(P>0.05);从数值上看,60%限饲组的产蛋净能最低。
表5 饲喂水平对文昌鸡母鸡能量平衡的影响

Table 5 Effects of feeding level on energy balance of Wenchang hens

项目
Items
表观代谢能
AME/
(MJ/kg)
代谢能摄入量
MEi/[kJ/
(BW0.75·d)]
沉积能
RE/[kJ/
(BW0.75·d)]
产蛋净能
EE/[kJ/
(BW0.75·d)]
产热量
HP/[kJ/
(BW0.75·d)]
61~90日龄61 to 90 days of age
自由采食组Free feeding group 13.24c 1 008.31a 366.77a 641.55a
20%限饲组20% restricted feeding group 13.28c 846.34b 255.83b 590.51b
40%限饲组40% restricted feeding group 13.35b 683.71c 134.90c 548.81c
60%限饲组60% restricted feeding group 13.62a 508.74d 26.53d 482.21d
均值标准误SEM 0.04 13.05 13.81 20.05
PP-value <0.01 <0.01 <0.01 <0.01
91~120日龄91 to 120 days of age
自由采食组Free feeding group 13.17c 909.01a 231.54a 2.34 675.14a
20%限饲组20% restricted feeding group 13.19c 738.06b 142.09b 2.86 593.10b
40%限饲组40% restricted feeding group 13.41b 588.34c 50.59c 2.34 535.42c
60%限饲组60% restricted feeding group 13.86a 428.92d -50.67d 1.64 479.62d
均值标准误SEM 0.04 8.44 25.98 1.29 27.00
PP-value <0.01 <0.01 <0.01 0.45 <0.01

2.5 文昌鸡母鸡的NEm

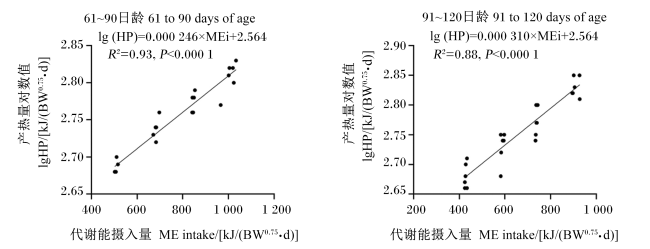
随采食量的降低,文昌鸡的MEi和HP线性降低。分别建立61~90日龄和91~120日龄文昌鸡lg(HP)和MEi之间的线性回归模型(图2)。经F检验,2个线性回归模型均达到显著水平(P<0.05),R2分别为0.93和0.88。根据回归模型,计算MEi=0时的HP即为NEm。61~90日龄和91~120日龄文昌鸡的NEm分别为366.44和351.56 kJ/(BW0.75·d)。
图2 文昌鸡母鸡代谢能摄入量与产热量之间的对数回归分析

Fig.2 Logarithmic regression analysis of ME intake and HP of Wenchang hens

2.6 文昌鸡母鸡NEr预测模型的建立

试验1得出64~91日龄和92~119日龄文昌鸡的NEg分别为19.87和25.05 kJ/g;92~119日龄文昌鸡的NEe为6.78 kJ/g;试验2得出61~90日龄和91~120日龄文昌鸡的NEm分别为366.44和351.56 kJ/(BW0.75·d)。利用这些数据,根据文昌鸡的ABW、ADG和AEP,可以预测文昌鸡NEr,预测模型为:
NEr(kJ/d)=366.4×BW0.75+19.87×ADG(61~90日龄);
NEr(kJ/d)=351.56×BW0.75+25.05×ADG+6.78×AEP(91~120日龄);
式中:BW0.75为代谢体重;ADG为平均日增重;AEP为平均产蛋量。

3 讨论

3.1 文昌鸡母鸡生产性能的变化及饲喂水平对文昌鸡母鸡生产性能的影响

家禽在生长后期一般增重缓慢[17-18],文昌鸡的生长也符合这一规律。本研究发现,在14~15周龄,文昌鸡的ADG出现短暂升高,ADFI也达到较高值,15周龄时文昌鸡开始产蛋,推测14~15周龄ADG的短暂升高可能与成熟卵泡的快速发育有关。Knížetová等[18]使用Gompertz模型拟合了9个肉鸡品系的生长曲线,发现母鸡拟合模型的R2低于公鸡,推测这种现象主要是由于母鸡卵巢在生长后期快速发育所致。Grossman等[19]研究发现,母鸡的ADG在13和25周龄左右存在2个波峰,认为雌性家禽的增重变化应采用多阶段模型拟合。文昌鸡在10~15周龄时F/G维持在4.0~5.5之间,开产后F/G快速增加到10~12,因此15周龄以后出栏将极大增加养殖成本。
限饲显著影响文昌鸡的生产性能,提高F/G,这与前人在肉鸡上的研究结果[20-21]一致。限饲减少肉鸡能量的摄入,但维持需要量不变,导致用于生长的能量减少,使F/G升高[22]。本研究发现,限饲对文昌鸡的产蛋率和平均产蛋量无显著影响。当能量摄入不足时,家禽可以减少体脂肪的沉积,优先保证产蛋的需要[23-26]。如果过度限饲,家禽即使消耗自身储备的能量和蛋白质,也将无法保证产蛋的需要。本研究发现,60%限饲组的体重降低,同时产蛋率和平均产蛋量有降低趋势。

3.2 饲喂水平对文昌鸡母鸡能量平衡的影响

本研究发现,限饲提高文昌鸡的饲粮AME。这一结果与前人的研究结果[7-8,20,27]一致。推测限饲减少肠道中食糜的数量,可能提高了饲料的消化率[8,27]。另外也可能与降低肉鸡体重、减少尿能的损失有关[20]。限饲降低文昌鸡MEi,导致RE和HP均显著降低。91~120日龄时,限饲60%导致文昌鸡的RE为负值,表明此时MEi不能满足文昌鸡的维持需要量,需要消耗体组织维持基础代谢,前人也有相似的报道[7,20]

3.3 文昌鸡母鸡的NEg

本研究发现,文昌鸡的NEg随日龄增加明显升高。本课题组测定了1~60日龄文昌鸡的NEg,发现31~60日龄文昌鸡的NEg比1~30日龄提高了50%。Longo等[28]研究1~21日龄和43~56日龄雌性肉鸡的NEg,分别为9.80和17.37 kJ/g。Sakomura等[9]同样发现,随日龄增加,肉鸡的NEg明显升高。但是李龙[14]测定了61~90日龄和91~120日龄雌性清远麻鸡的NEg,分别为15.94和15.33 kJ/g。肉鸡NEg随日龄的变化可能与肉鸡体组成的变化有关[29]。本研究发现,9~13周龄文昌鸡体脂肪含量增加了60%,13~17周龄可能由于卵巢的快速发育,体蛋白质含量增加了15%,体脂肪含量增加了17%。

3.4 文昌鸡母鸡的NEe

一般通过测定鸡蛋中的能量含量代表家禽的NEe,即每产1 g鸡蛋所需的净能值。文昌鸡在15周龄开始产蛋,平均每克鸡蛋的能值为6.78 kJ。朱中胜[13]测定皖南黄鸡鸡蛋的能量含量为6.52 kJ/g。肉种鸡[29]和蛋鸡[11]的NEe分别为6.63和6.15 kJ/g。上述研究表明,不同品种鸡蛋的能量含量较为接近。

3.5 文昌鸡母鸡的NEm

本研究测定了61~90日龄和91~120日龄文昌鸡的NEm,分别为366.4和351.6 kJ/(BW0.75·d)。Brainer等[11]发现34~42周龄散养蛋鸡的NEm为345 kJ/(BW0.75·d),与本研究的测定结果相似。本课题组研究发现,31~60日龄文昌鸡的NEm为398.1 kJ/(BW0.75·d),60日龄之后文昌鸡的NEm略有降低。李龙[14]同样发现,61~90日龄和91~120日龄清远麻鸡的MEm也略低于31~60日龄。家禽能量的维持需要量与体组成有关。由于骨骼肌的代谢活性和HP高于脂肪组织[10,30],因此骨骼肌含量越高,维持能量需要量也越高[31-32]。本研究发现,8周龄时文昌鸡每千克代谢体重的体蛋白质含量为206 g,13周龄时达到221 g,提高幅度较小,17周龄时达到268 g,文昌鸡后期体蛋白质含量的增加可能主要由于卵巢的快速发育,而骨骼肌组织可能没有增加,因此NEm略有降低。

4 结论

本研究采用析因法分别测定了61~120日龄文昌鸡母鸡的NEg、NEe和NEm,建立了文昌鸡NEr的预测模型:
NEr(kJ/d)=366.4×BW0.75+19.87×ADG(61~90日龄);
NEr(kJ/d)=351.56×BW0.75+25.05×ADG+6.78×AEP(91~120日龄)。
[1]
邹轶, 张小凤, 刘松柏, 等. 净能体系在肉鸡应用中的研究进展[J]. 中国畜牧兽医, 2019, 46(11):3270-3276.

DOI

ZOU Y, ZHANG X F, LIU S B, et al. Research advances of net energy application for broiler production[J]. China Animal Husbandry & Veterinary Medicine, 2019, 46(11):3270-3276. (in Chinese)

[2]
KERR B J, SOUTHERN L L, BIDNER T D, et al. Influence of dietary protein level,amino acid supplementation,and dietary energy levels on growing-finishing pig performance and carcass composition[J]. Journal of Animal Science, 2003, 81(12):3075-3087.

DOI

[3]
VAN DER KLIS J D, KWAKERNAAK C, JANSMAN A, et al. Energy in poultry diets:adjusted AME or net energy[C]// Proceedings of the 21st Annual Australian Poultry Science Sumposium. Sydney: Poultry Research Foundation, 2010:44-49.

[4]
WOYENGO T A, JHA R, BELTRANENA E, et al. Nutrient digestibility of lentil and regular- and low-oligosaccharide,micronized full-fat soybean fed to grower pigs[J]. Journal of Animal Science, 2014, 92(1):229-237.

DOI

[5]
李瑞, 呙于明, 侯德兴, 等. 家禽饲料原料有效能和氨基酸消化率评定体系及影响因素[J]. 动物营养学报, 2019, 31(5):1970-1980.

LI R, GUO Y M, HOU D X, et al. Evaluation system and influencing factors of effective energy and amino acids digestibility in feedstuffs fed to poultry[J]. Chinese Journal of Animal Nutrition, 2019, 31(5):1970-1980. (in Chinese)

[6]
班志彬, 武斌, 张芳毓, 等. 不同鸡品种维持净能的需要量测定[J]. 动物营养学报, 2020, 32(5):2158-2163.

DOI

BAN Z B, WU B, ZHANG F Y, et al. Determination to net energy requirements for maintenance for different chicken breeds[J]. Chinese Journal of Animal Nutrition, 2020, 32(5):2158-2163. (in Chinese)

[7]
SAKOMURA N K, SILVA R, COUTO H P, et al. Modeling metabolizable energy utilization in broiler breeder pullets[J]. Poultry Science, 2003, 82(3):419-427.

PMID

[8]
YANG T, YU L X, WEN M, et al. Modeling net energy requirements of 2 to 3-week-old Cherry Valley ducks[J]. Asian-Australasian Journal of Animal Sciences, 2020, 33(10):1624-1632.

DOI PMID

[9]
SAKOMURA N K, LONGO F A, OVIEDO-RONDON E O, et al. Modeling energy utilization and growth parameter description for broiler chickens1[J]. Poultry Science, 2005, 84(9):1363-1369.

PMID

[10]
FILHO J J, DA SILVA J H V, SILVA C T, et al. Energy requirement for maintenance and gain for two genotypes of quails housed in different breeding rearing systems[J]. Revista Brasileira de Zootecnia, 2011, 40(11):2415-2422.

DOI

[11]
BRAINER M M A, RABELLO C B V, SANTOS M J B, et al. Prediction of the metabolizable energy requirements of free-range laying hens[J]. Journal of Animal Science, 2016, 94(1):117-124.

DOI PMID

[12]
FILHO J J, DA SILVA J H V, COSTA F G P, et al. Prediction equations to estimate the demand of energy and crude protein for maintenance,gain and egg production for laying Japanese quails[J]. Revista Brasileira de Zootecnia, 2011, 40(11):2423-2430.

DOI

[13]
朱中胜. 皖南三黄鸡能量和蛋白质需要量研究[D]. 硕士学位论文. 合肥: 安徽农业大学, 2016.

ZHU Z S. Research on energy and protein requirements of Wannan three-yellow chicks[D]. Master's Thesis. Hefei: Anhui Agricultural University, 2016. (in Chinese)

[14]
李龙. 清远麻鸡生长规律与能量需要模型研究[D]. 博士学位论文. 广州: 华南农业大学, 2020.

LI L. Studies on growth pattern and energy requirement model of Qingyuan partridge chicken[D]. Ph.D.Thesis. Guangzhou: South China Agricultural University, 2020. (in Chinese)

[15]
FARRELL D. General principles and assumptions of calorimetry[M]//MORRIS T R,FREEMAN B M.Energy requirements of poultry. Edinberg, UK: British Poultry Science, 1974:1-23.

[16]
LOFGREEN G P, GARRETT W N. A system for expressing net energy requirements and feed values for growing and finishing beef cattle[J]. Journal of Animal Science, 1968, 27(3):793-806.

DOI

[17]
NARINÇ D, ÖKSÜZ NARINÇ N, AYGÜN A. Growth curve analyses in poultry science[J]. World's Poultry Science Journal, 2017, 73(2):395-408.

DOI

[18]
KNÍZETOVÁ H, HYÁNEK J, KNÍZE B, et al. Analysis of growth curves of fowl.Ⅰ.Chickens[J]. British Poultry Science, 1991, 32(5):1027-1038.

DOI

[19]
GROSSMAN M, KOOPS W J. Multiphasic analysis of growth curves in chickens[J]. Poultry Science, 1988, 67(1):33-42.

PMID

[20]
LIU W, LIN C H, WU Z K, et al. Estimation of the net energy requirement for maintenance in broilers[J]. Asian-Australasian Journal of Animal Sciences, 2017, 30(6):849-856.

DOI PMID

[21]
LATSHAW J D, MORITZ J S. The partitioning of metabolizable energy by broiler chickens[J]. Poultry Science, 2009, 88(1):98-105.

DOI PMID

[22]
NOURMOHAMMADI R, KHOSRAVINIA H, AFZALI N. Effects of feed form and xylanase supplementation on metabolizable energy partitioning in broiler chicken fed wheat-based diets[J]. Journal of Animal Physiology and Animal Nutrition, 2018, 102(6):1593-1600.

DOI PMID

[23]
RABELLO C B V, SAKOMURA N K, LONGO F A, et al. Modelling energy utilisation in broiler breeder hens[J]. British Poultry Science, 2006, 47(5):622-631.

PMID

[24]
MCDANIEL G R, BRAKE J, ECKMAN M K. Factors affecting broiler breeder performance:4.The interrelationship of some reproductive traits[J]. Poultry Science, 1981, 60(8):1792-1797.

DOI

[25]
PEARSON R A, HERRON K M. Effects of energy and protein allowances during lay on the reproductive performance of broiler breeder hens[J]. British Poultry Science, 1981, 22(3):227-239.

DOI

[26]
PEARSON R A, HERRON K M. Relationship between energy and protein intakes and laying characteristics in individually-caged broiler breeder hens[J]. British Poultry Science, 1982, 23(2):145-159.

DOI

[27]
ZANCANELA V, MARCATO S M, FURLAN A C, et al. Models for predicting energy requirements in meat quail[J]. Livestock Science, 2015, 171:12-19.

DOI

[28]
LONGO F A, SAKOMURA N K, RABELLO C B V, et al. Exigências energéticas para mantença e para o crescimento de frangos de corte[J]. Revista Brasileira de Zootecnia, 2006, 35(1):119-125.

DOI

[29]
REYES M E, SALAS C, COON C N. Energy requirement for maintenance and egg production for broiler breeder hens[J]. International Journal of Poultry Science, 2011, 10(12):913-920.

DOI

[30]
LOPEZ G, LEESON S. Utilization of metabolizable energy by young broilers and birds of intermediate growth rate[J]. Poultry Science, 2005, 84(7):1069-1076.

PMID

[31]
SCOTT M L, NESHEIM M C, YOUNG R J. Nutrition of the chicken[M]. 3rd ed.Ithaca, NY:M. L. Scott & Associates,1982.

[32]
SILVA E P, CASTIBLANCO D M C, ARTONI S M B, et al. Metabolisable energy partition for Japanese quails[J]. Animal, 2020, 14(S2):s275-s285.

DOI

Outlines

/