

1 材料与方法
1.1 试验动物
1.2 试验设计和样品收集
1.3 燕麦草及其降解残渣营养成分分析
1.4 细菌DNA提取和实时荧光定量PCR
1.5 细菌Illumina MiSeq测序和数据处理
1.6 数据统计分析
2 结果与分析
2.1 燕麦草的营养成分与瘤胃降解率
表1 燕麦草在瘤胃中的动态降解率Table 1 Dynamic degradation rate of oat grass in rumen % |
| 项目 Items | 时间Time/h | SEM | P值 P-value | |||||
|---|---|---|---|---|---|---|---|---|
| 2 | 6 | 12 | 24 | 48 | 72 | |||
| 干物质降解率DMD | 23.4f | 27.2e | 30.4d | 35.4c | 43.2b | 48.8a | 1.16 | <0.001 |
| 中性洗涤纤维降解率NDFD | 13.5e | 15.4de | 17.8d | 24.6c | 34.6b | 42.7a | 1.26 | <0.001 |
| 酸性洗涤纤维降解率ADFD | 8.3e | 11.4d | 13.8d | 22.2c | 32.0b | 41.8a | 1.43 | <0.001 |
同行数据肩标无字母或相同字母表示差异不显著(P>0.05),肩标不同字母表示差异显著(P<0.05)。下表同。 | |
In the same row, values with no letter or the same letter superscripts mean no significant difference (P>0.05), while with different small letter superscripts mean significant difference (P<0.05). The same as below. |
2.2 定植在燕麦草及瘤胃的细菌群落
表2 定植在燕麦草及瘤胃的细菌群落16S rRNA拷贝数和alpha多样性指数Table 2 16S rRNA copy number and alpha diversity indices of bacterial communities colonized in oat grass and rumen |
| 项目Items | 瘤胃Rumen | 燕麦草Oat grass |
|---|---|---|
| 细菌拷贝数Bacterial copy number/[lg(基因拷贝数/g FM)] | 11.99 | 11.73 |
| Good's覆盖度Good's coverage | 0.983 | 0.998 |
| 观测物种数Observed specie number | 2 383.4 | 136.5 |
| Chao指数Chao index | 2 992.5 | 148.6 |
| Shannon指数Shannon index | 9.23 | 3.83 |
表3 定植在燕麦草及瘤胃的细菌在门水平上的相对丰度Table 3 Relative abundance of bacteria colonized in oat grass and rumen at phylum level % |
| 项目Items | 瘤胃Rumen | 燕麦草Oat grass |
|---|---|---|
| 厚壁菌门Firmicutes | 49.04 | 8.95 |
| 拟杆菌门Bacteroidetes | 46.22 | 5.52 |
| 螺旋菌门Spirochaetae | 1.30 | 0.12 |
| Saccharibacteria | 1.13 | 0.04 |
| 变形菌门Proteobacteria | 0.64 | 78.50 |
| 软壁菌门Tenericutes | 0.64 | 0.00 |
| 放线菌门Actinobacteria | 0.00 | 6.74 |
2.3 燕麦草在瘤胃降解过程中黏附的细菌群落动态分析
表4 燕麦草在瘤胃降解过程中黏附的细菌群落alpha多样性Table 4 Alpha diversity of bacterial community attached to oat grass during rumen degradation |
| 项目 Items | 时间Time/h | SEM | P值 P-value | ||||
|---|---|---|---|---|---|---|---|
| 2 | 6 | 12 | 24 | 72 | |||
| Good's覆盖度Good's coverage | 0.971 | 0.970 | 0.973 | 0.971 | 0.973 | 0.000 9 | 0.216 |
| 观测物种数Observed specie number | 2 071.4 | 2 050.6 | 1 977.0 | 2 010.9 | 1 890.3 | 49.04 | 0.109 |
| Chao指数Chao index | 2 775.1 | 2 777.0 | 2 616.2 | 2 676.9 | 2 536.8 | 71.37 | 0.110 |
| Shannon指数Shannon index | 8.93 | 8.97 | 9.06 | 9.04 | 8.82 | 0.083 | 0.305 |
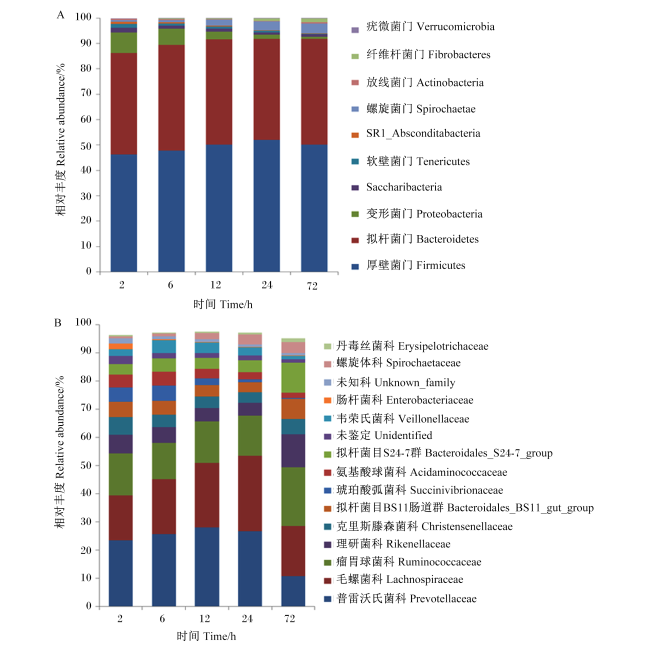
表5 燕麦草在瘤胃降解过程中黏附的细菌在属水平上相对丰度的变化Table 5 Changes in relative abundances of bacteria attached to oat grass during rumen degradation at genus level % |
| 项目 Items | 组别Groups | SEM | P值 P-value | ||||||||||||
|---|---|---|---|---|---|---|---|---|---|---|---|---|---|---|---|
| 2 | 6 | 12 | 24 | 72 | |||||||||||
| 克里斯滕森菌科R-7群 Christensenellaceae_R-7_group | 5.91 | 4.17 | 3.77 | 3.50 | 4.84 | 0.780 | 0.221 | ||||||||
| 溶纤维素真杆菌群 Eubacterium_cellulosolvens_group | 0.11b | 0.12b | 0.37b | 1.52a | 0.19b | 0.171 | <0.001 | ||||||||
| 产粪甾醇真杆菌群 Eubacterium_coprostanoligenes_group | 1.09a | 0.83ab | 0.67b | 0.53b | 1.11a | 0.109 | 0.003 | ||||||||
| 反刍动物真杆菌群 Eubacterium_ruminantium_group | 1.37bc | 1.86b | 2.39ab | 2.50a | 0.66d | 0.203 | <0.001 | ||||||||
| 毛螺菌科AC2044群 Lachnospiraceae_AC2044_group | 0.68b | 0.78b | 1.00ab | 1.25a | 0.92ab | 0.116 | 0.019 | ||||||||
| 毛螺菌科NK3A20群 Lachnospiraceae_NK3A20_group | 1.95bc | 2.04bc | 2.24ab | 2.48a | 1.66c | 0.125 | 0.001 | ||||||||
| 毛螺菌科XPB1014群 Lachnospiraceae_XPB1014_group | 1.03 | 0.99 | 1.27 | 1.69 | 1.16 | 0.210 | 0.166 | ||||||||
| 瘤胃球菌科NK4A214群 Ruminococcaceae_NK4A214_group | 3.49b | 2.99b | 2.78b | 2.61b | 6.47a | 0.346 | <0.001 | ||||||||
| 瘤胃球菌科UCG-005 Ruminococcaceae_UCG-005 | 0.62b | 0.64b | 0.55b | 0.58b | 0.98a | 0.096 | 0.027 | ||||||||
| 瘤胃球菌科UCG-010 Ruminococcaceae_UCG-010 | 0.45b | 0.34b | 0.33b | 0.32b | 0.98a | 0.074 | <0.001 | ||||||||
| 瘤胃球菌科UCG-014 Ruminococcaceae_UCG-014 | 1.67a | 0.90b | 0.91b | 0.57b | 0.35b | 0.192 | 0.001 | ||||||||
| 瘤胃球菌属1 Ruminococcus_1 | 2.20b | 3.13b | 5.53a | 5.21a | 2.58b | 0.412 | <0.001 | ||||||||
| 瘤胃球菌属2 Ruminococcus_2 | 2.00a | 1.17ab | 0.64b | 0.30b | 0.49b | 0.308 | 0.005 | ||||||||
| 瘤胃球菌属gauvreauii群 Ruminococcus_gauvreauii_group | 0.56 | 0.46 | 0.56 | 0.45 | 0.52 | 0.100 | 0.894 | ||||||||
| 解琥珀酸菌属Succiniclasticum | 4.52ab | 4.93a | 3.24bc | 2.50c | 1.89c | 0.508 | 0.001 | ||||||||
| 韦荣氏菌科UCG-001 Veillonellaceae_UCG-001 | 0.88 | 0.79 | 0.64 | 0.63 | 0.57 | 0.102 | 0.210 | ||||||||
| 假丁酸弧菌属Pseudobutyrivibrio | 0.87bc | 1.55ab | 1.70a | 1.78a | 0.70c | 0.255 | 0.014 | ||||||||
| Saccharofermentans | 1.58c | 1.59c | 2.17bc | 2.99b | 4.12a | 0.291 | <0.001 | ||||||||
| 月形单胞菌属1 Selenomonas_1 | 0.52b | 2.75a | 2.53a | 1.89a | 0.27b | 0.40 | <0.001 | ||||||||
| 普雷沃氏菌属_1 Prevotella_1 | 19.23a | 21.02a | 22.60a | 19.42a | 7.31b | 2.141 | <0.001 | ||||||||
| 普雷沃氏菌科UCG-001 Prevotellaceae_UCG-001 | 1.57a | 1.79a | 1.76a | 1.53a | 0.74b | 0.163 | 0.001 | ||||||||
| 普雷沃氏菌科UCG-003 Prevotellaceae_UCG-003 | 0.87 | 0.91 | 0.66 | 0.57 | 0.69 | 0.092 | 0.078 | ||||||||
| 普雷沃氏菌科YAB2003群 Prevotellaceae_YAB2003_group | 0.27b | 0.12b | 0.39b | 1.54a | 0.34b | 0.160 | <0.001 | ||||||||
| 理研菌科RC9肠道群 Rikenellaceae_RC9_gut_group | 6.49b | 5.50bc | 4.54c | 4.37c | 11.46a | 0.504 | <0.001 | ||||||||
| 聚乙酸菌属Acetitomaculum | 0.76b | 0.68bc | 0.61bc | 0.52c | 0.98a | 0.072 | 0.002 | ||||||||
| 厌氧弧菌属Anaerovibrio | 0.49ab | 0.62a | 0.36bc | 0.23cd | 0.10d | 0.054 | <0.001 | ||||||||
| 丁酸弧菌属2 Butyrivibrio_2 | 1.87 | 2.22 | 2.54 | 2.81 | 3.03 | 0.426 | 0.349 | ||||||||
| 琥珀酸弧菌科UCG-002 Succinivibrionaceae_UCG-002 | 4.47 | 4.53 | 1.86 | 0.81 | 0.23 | 1.332 | 0.086 | ||||||||
| Candidatus_Saccharimonas | 1.85 | 1.11 | 1.10 | 0.88 | 0.90 | 0.309 | 0.200 | ||||||||
| 密螺旋体属2 Treponema_2 | 0.69c | 0.89c | 2.22b | 3.51a | 3.88a | 0.425 | <0.001 | ||||||||
| 罗氏菌属Roseburia | 0.52b | 0.74ab | 0.77ab | 1.16a | 0.38b | 0.173 | 0.039 | ||||||||
| 未鉴定属Unidentified | 18.52b | 18.31b | 17.43b | 18.63b | 25.95a | 1.373 | 0.001 | ||||||||
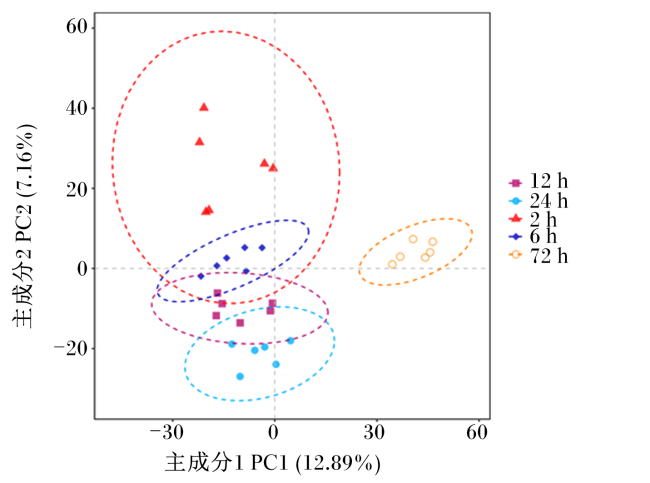
2.4 燕麦草DM、NDF和ADF含量与细菌群落的相关性
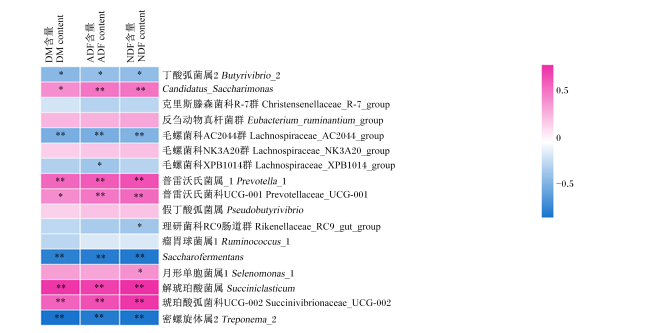


图3 燕麦草在瘤胃降解过程中营养成分含量与优势黏附菌属相对丰度的相关分析根据Pearson相关系数对单元格进行着色,红色表示正相关,蓝色表示负相关。*表示显著相关(P<0.05),**表示极显著相关(P<0.01)。 Fig.3 Correlation analysis between nutrient contents of oat grass and relative abundances of dominant attached genera during rumen degradation. Cells were colored based on Pearson correlation coefficient, and red color and blue color indicated positive and negative correlation, respectively. * mean significantly correlated (P<0.05), and ** mean extremely significantly correlated (P<0.01). |