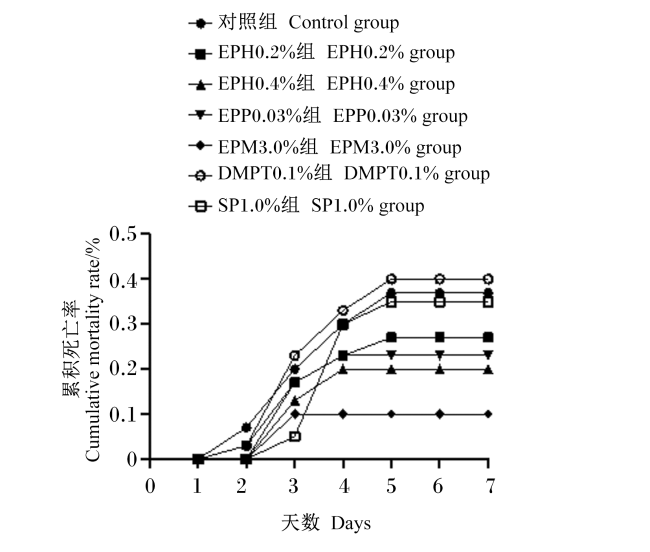
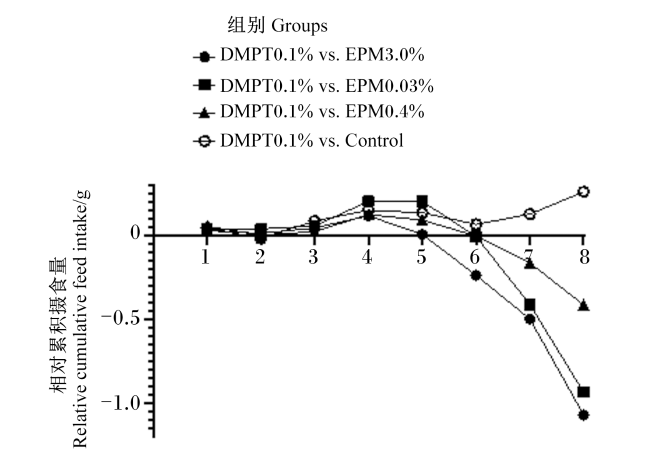
). Fish with an initial weight of about 7 g were randomly assigned to 7 groups with 3 replicates per group and 25 fish per replicate. Seven diets were formulated to contain non feed additives (control group), 0.2% of EPH (EPH0.2% group), 0.4% of EPH (EPH0.4% group), 0.03% of EPP (EPP0.03% group), 3.0% of EPM (EPM3.0%), 0.1% of dimethyl-β-propiothetine (DMPT0.1% group) and 1.0% of squid extract (SP1.0% group), respectively. The feeding trial was carried out for 63 days. Results showed as follows: 1) three E. prolifera bio-products had feeding attractiveness effect, which exceeded that of DMPT0.1% group after 7 to 10 days of feeding. 2) Three E. prolifera bio-products showed a benefit effect on the growth, which was EPM3.0% group>EPH0.2% group >EPH0.4% group >EPP0.03% group. 3) Compared with the control group, the contents of triglyceride (TG) in serum and liver significantly decreased in the EPH0.2% group (P<0.05), and simultaneously increasing serum high density lipoprotein cholesterol (HDL-C) content and decreasing low-density lipoprotein cholesterol (LDL-C) content were observed in the EPH0.4% group (P<0.05). 4) Compared with the control group, the EPH0.2% and EPH0.4% groups significantly increased the total antioxidant capacity (T-AOC) and the activity of superoxide dismutase (SOD) (P<0.05), respectively, and the three E. prolifera bio-products significantly decreased the content of serum malondialdehyde (MDA) (P<0.05); the activity of lysozyme (LZM) significantly increased in the EPH0.4% group (P<0.05). 5) Compared with the control group, regarding anti-inflammatory factor, the relative expression levels of interleukin-10 (IL-10) gene in the head kidney up-regulated in the EPH0.4% and EPM3.0% groups (P<0.05); to pro-inflammatory factor, the relatived expression level of tumor necrosis factor-α (TNF-α) was down-regulated by E. prolifera bio-products, and the relative expression levels of interleukin-1β (IL-1β) and IL-6 in the EPH0.2% group were significantly lower compared with the control group (P<0.05). 6) Cumulative mortality rate of 7 days after Vibrio harveyi challenge was the lowest at 10% in the EPM3.0% group, followed by the EPH0.4% group with the cumulative mortality rate of 20%. In conclusion, three types of E. prolifera bio-products has beneficial effects on the feed intake, growth, reduced blood lipids, antioxidant capacity and immunity of grouper to some extent. Moreover, after E. prolifera hydrolyzed by enzymatic treatment, they can reduce the amount of E. prolifera in feed, as well as have or exceed the benefit effects of the traditional EPM on grouper.
 )为研究对象,主要比较研究浒苔生物制品(EPM、EPP和EPH)对云龙石斑鱼摄食、生长、脂肪代谢、抗氧化能力和免疫力的影响,从而为进一步提高浒苔生物制品在海水鱼类上的应用提供理论依据,同时,本研究也有助于进一步提高浒苔的经济价值,推动对沿海地区浒苔爆发的治理。
1 材料与方法
1.1 试验材料
1.2 试验设计及试验饲料
表1 试验饲料组成及营养水平(干物质基础)Table 1 Composition and nutrient levels of experimental diets (DM basis) % |
| 项目 Items | 对照组 Control group | EPH0.2%组 EPH0.2% group | EPH0.4%组 EPH0.4% group | EPP0.03%组 EPP0.03% group | EPM3.0%组 EPM3.0% group | DMPT0.1%组 DMPT0.1% group | SP1.0%组 SP1.0% group |
|---|---|---|---|---|---|---|---|
| 原料Ingredients | |||||||
| 鱼粉Fish meal | 40.0 | 40.0 | 40.0 | 40.00 | 40.0 | 40.0 | 40.0 |
| 谷朊粉Wheat gluten | 5.0 | 5.0 | 5.0 | 5.00 | 5.0 | 5.0 | 5.0 |
| 啤酒酵母Beer yeast | 7.0 | 7.0 | 7.0 | 7.00 | 7.0 | 7.0 | 7.0 |
| 豆粕Soybean meal | 20.0 | 20.0 | 20.0 | 20.00 | 20.6 | 20.0 | 19.0 |
| 鳞虾粉Krill meal | 2.0 | 2.0 | 2.0 | 2.00 | 2.0 | 2.0 | 2.0 |
| 小麦粉Wheat meal | 15.8 | 15.6 | 15.4 | 15.77 | 12.2 | 15.7 | 15.8 |
| 浒苔酵素 E. prolifera hydrolysate | 0.2 | 0.4 | |||||
| 浒苔多糖 E. prolifera polysaccharide | 0.03 | ||||||
| 浒苔粉E. prolifera meal | 3.0 | ||||||
| 二甲基-β-丙酸噻亭 DMPT | 0.1 | ||||||
| 鱿鱼膏Squid paste | 1.0 | ||||||
| 卵磷脂Soybean lecithin | 1.0 | 1.0 | 1.0 | 1.00 | 1.0 | 1.0 | 1.0 |
| 豆油Soybean oil | 3.0 | 3.0 | 3.0 | 3.00 | 3.0 | 3.0 | 3.0 |
| 鱼油Fish oil | 3.0 | 3.0 | 3.0 | 3.00 | 3.0 | 3.0 | 3.0 |
| 矿物质预混料 Mineral premix1) | 0.5 | 0.5 | 0.5 | 0.50 | 0.5 | 0.5 | 0.5 |
| 维生素预混料 Vitamin premix2) | 1.0 | 1.0 | 1.0 | 1.00 | 1.0 | 1.0 | 1.0 |
| 磷酸二氢钙Ca(H2PO4)2 | 1.0 | 1.0 | 1.0 | 1.00 | 1.0 | 1.0 | 1.0 |
| 氯化胆碱Choline chloride | 0.2 | 0.2 | 0.2 | 0.20 | 0.2 | 0.2 | 0.2 |
| 维生素C Vitamin C | 0.5 | 0.5 | 0.5 | 0.50 | 0.5 | 0.5 | 0.5 |
| 合计Total | 100.0 | 100.0 | 100.0 | 100.00 | 100.0 | 100.0 | 100.0 |
| 营养水平Nutrient levels3) | |||||||
| 粗蛋白质CP | 48.40 | 48.29 | 48.68 | 48.96 | 48.94 | 48.35 | 48.55 |
| 粗脂肪EE | 10.64 | 10.88 | 10.14 | 10.79 | 10.32 | 10.73 | 10.50 |
| 粗灰分Ash | 10.33 | 10.36 | 10.44 | 10.30 | 11.18 | 10.37 | 10.40 |
1)每千克矿物质预混料含有 Per kg mineral premix contained the following:CoCl2·6H2O 0.4 g,CuSO4·5H2O 3.7 g,FeSO4·H2O 112.7 g,ZnSO4·H2O 45.2 g,MnSO4·H2O 9.3 g,Ca(IO3)2 0.3 g,Na2SeO3 0.1 g。 2)每千克维生素预混料含有 Per kg vitamin premix contained the following:硝酸硫胺 thiamine nitrate 0.93 g,核黄素 riboflavin 1.35 g,盐酸吡哆醇 pyridoxine hydrochloride 1.1 g,VB12 0.01 mg,生物素 biotin 0.047 5 g,VK3 1.2 g,肌醇 inositol 10 g,D-泛酸钙 D-calcium pantothenate 4.5 g,烟酰胺 nicotinamide 20 mg,叶酸 folic acid 0.46 5 g,VA 1.14 g,VD3 0.18 g,DL-α-生育酚乙酸酯 DL-α-tocopherol acetate 7.6 g,氰钴胺 cyanocobalamine 0.007 5 g。 3)营养水平均为实测值。Nutrient levels were all measured values. |
1.3 试验动物及饲养管理
1.4 样品采集
1.5 相关计算公式
1.6 样品分析
1.7 RNA提取与基因表达测定
表2 引物序列Table 2 Primers sequences |
| 基因名称 Gene names | 引物序列 Primer sequence (5'—3') | 产物长度 Product length/bp | GenBank登录号 GenBank accession No. |
|---|---|---|---|
| 白细胞介素-1β IL-1β | F:CTCGAGGAATGCAGCAAGGA R:TTAACACAGGACCAGGCGAC | 241 | XM_033647455.1 |
| 白细胞介素-6 IL-6 | F:TCCTGCTGGTTATGGCTGTTGATTC R:CAACGGATTCCTTCTGTATGAGTCTGG | 120 | XM_033647660.1 |
| 白细胞介素-8 IL-8 | F:AAGTTTGCCTTGACCCCGAA R:GCAAATCTCTCCCGGTCTGT | 94 | XM_033624830.1 |
| 白细胞介素-10 IL-10 | F:ACCCGTTGCTTCCAGTTAGT R:CAGTGGACGGGACGTAGATG | 178 | XM_033625798.1 |
| 肿瘤坏死因子-α TNF-α | F:CGAGTTGGTTACCCCATCGT R:GGAAGCCGGGAGACTGAATG | 184 | XM_050049493.1 |
| β-肌动蛋白 β-actin | F:AAGATGAAATCGCCGCAC R:GCTCCTCAGGGGCAACTC | 297 | KU200949.2 |
| 次黄嘌呤磷酸核糖基转移酶1 HPRT1 | F:GCGTGCTCAAAGGGGGTTAC R:TCATTGGGATGGAACGGTCA | 90 | XM_033633026.1 |
1.8 攻毒试验
1.9 统计分析
2 结果
2.1 浒苔生物制品在云龙石斑鱼上的诱食效果
表3 饲喂21 d后各组每尾鱼的累积摄食量Table 3 Cumulative feed intake per fish in each group after 21 days of feeding g |
| 项目 Items | 对照组 Control group | EPH0.2%组 EPH0.2% group | EPH0.4%组 EPH0.4% group | EPP0.03%组 EPP0.03% group | EPM3.0%组 EPM3.0% group | DMPT0.1%组 DMPT0.1% group | SP1.0%组 SP1.0% group | |||||||||||||||
|---|---|---|---|---|---|---|---|---|---|---|---|---|---|---|---|---|---|---|---|---|---|---|
| 第1餐 FF | 0.204 ±0.005b | 0.212 ±0.010ab | 0.195 ±0.010b | 0.208 ±0.008b | 0.222 ±0.003ab | 0.253 ±0.009a | 0.209 ±0.014ab | |||||||||||||||
| 第1天 Day 1 | 0.364 ±0.021 | 0.327 ±0.055 | 0.347 ±0.038 | 0.308 ±0.028 | 0.334 ±0.038 | 0.351 ±0.036 | 0.352 ±0.034 | |||||||||||||||
| 前3天 First 3 days | 0.902 ±0.080 | 0.949 ±0.060 | 0.965 ±0.041 | 0.932 ±0.002 | 0.943 ±0.092 | 0.992 ±0.075 | 0.893 ±0.035 | |||||||||||||||
| 前5天 First 5 days | 1.518 ±0.124 | 1.555 ±0.039 | 1.544 ±0.019 | 1.464 ±0.032 | 1.552 ±0.056 | 1.672 ±0.070 | 1.484 ±0.024 | |||||||||||||||
| 前7天 First 7 days | 2.118 ±0.096 | 2.132 ±0.033 | 2.163 ±0.021 | 2.050 ±0.057 | 2.249 ±0.041 | 2.257 ±0.059 | 2.051 ±0.097 | |||||||||||||||
| 前10天 First 10 days | 3.022 ±0.070 | 3.020 ±0.048 | 3.089 ±0.104 | 3.094 ±0.151 | 3.326 ±0.031 | 3.091 ±0.159 | 2.996 ±0.052 | |||||||||||||||
| 前14天 First 14 days | 4.536 ±0.021b | 4.671 ±0.105ab | 4.827 ±0.105ab | 5.076 ±0.148a | 5.163 ±0.008a | 4.667 ±0.179ab | 4.672 ±0.074ab | |||||||||||||||
| 前21天 First 21 days | 8.144 ±0.032b | 8.708 ±0.174ab | 8.820 ±0.258ab | 9.342 ±0.304a | 9.477 ±0.117a | 8.408 ±0.384ab | 8.755 ±0.183ab | |||||||||||||||
第1餐为试验开始后第1次饲喂后的摄食量;第1天为饲喂第1天总的摄食量,包括第1餐的累积摄食量;前3天为从饲喂第1天开始到第3天结束时的累积摄食量,以此类推。同行数据肩标无字母或相同字母表示差异不显著(P>0.05),不同字母表示差异显著(P<0.05)。下表同。 | |
The first feeding meal means the amount of feed intake of the first ingestion at the beginning of the trial; the day 1 means the total amount of feed intake of day 1 ingestion, including the amount of cumulative feed intake of the first feeding meal; the first 3 days means the amount of cumulative feed intake from day 1 to day 3 ingestion, and so on. In the same row, values with no letter or the same letter superscripts mean no significant difference (P>0.05 ), while with different letter superscripts mean significant difference (P<0.05 ). The same as below. |
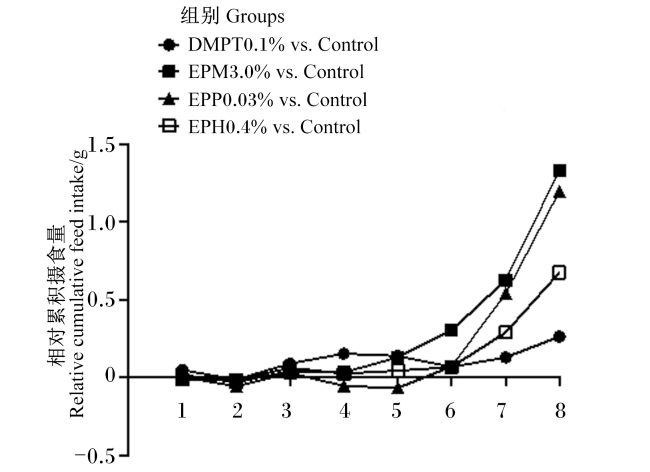
图1 DMPT、浒苔生物制品与对照组摄食后21 d相对累积摄食量横坐标中,数字1代表第1餐相对摄食量,数字2代表第1天相对摄食量,数字3代表前3天相对累积摄食量,数字4代表前5天相对累积摄食量,数字5代表前7天相对累积摄食量,数字6代表前10天相对累积摄食量,数字7代表前14天相对累积摄食量,数字8代表前21天相对累积摄食量。图2同。 Fig.1 Relative cumulative feed intake of DMPT, E. prolifera bio-products compared with control group after 21 days of feeding On the horizontal axis, No.1 represents the amount of relative feed intake of the first feeding (FF) meal, No.2 represents the amount of relative feed intake on day 1, No.3 represents the amount of relative cumulative feed intake on first 3 days, No.4 represents the amount of relative cumulative feed intake on first 5 days, No.5 represents the amount of relative cumulative feed intake on first 7 days, No.6 represents the amount of relative cumulative feed intake on first 10 days, No.7 represents the amount of relative cumulative feed intake on first 14 days, and No.8 represents the amount of relative cumulative feed intake on first 21 days. The same as Fig.2. |
2.2 浒苔生物制品对云龙石斑鱼生长性能的影响
表4 浒苔生物制品对云龙石斑鱼生长性能的影响Table 4 Effects of E. prolifera bio-products on growth performance of Yunlong grouper |
| 项目 Items | 对照组 Control group | EPH0.2%组 EPH0.2% group | EPH0.4%组 EPH0.4% group | EPP0.03%组 EPP0.03% group | EPM3.0%组 EPM3.0% group | DMPT0.1%组 DMPT0.1% group | SP1.0%组 SP1.0% group | |||||||
|---|---|---|---|---|---|---|---|---|---|---|---|---|---|---|
| 初始体重 IW/g | 7.47 ±0.03 | 7.48 ±0.01 | 7.49 ±0.02 | 7.44 ±0.01 | 7.48 ±0.02 | 7.48 ±0.01 | 7.47 ±0.01 | |||||||
| 终末体重 FW/g | 48.84 ±2.19ab | 52.66 ±1.30a | 50.12 ±1.22ab | 49.68 ±3.59ab | 52.24 ±0.97a | 44.52 ±1.10b | 49.93 ±0.40ab | |||||||
| 存活率 SR/% | 98.67 ±1.33 | 100.00 ±0.00 | 100.00 ±0.00 | 100.00 ±0.00 | 100.00 ±0.00 | 100.00 ±0.00 | 98.67 ±1.33 | |||||||
| 增重率 WGR/% | 552 ±31ab | 603 ±19a | 568 ±16ab | 593 ±48ab | 598 ±11a | 495 ±15b | 567 ±5ab | |||||||
| 特定生长率 SGR/(%/d) | 2.98 ±0.08ab | 3.10 ±0.04a | 3.02 ±0.04ab | 3.01 ±0.11ab | 3.08 ±0.03a | 2.83 ±0.04b | 3.02 ±0.01ab | |||||||
| 摄食率 FI/(%/d) | 2.22 ±0.04b | 2.28 ±0.05b | 2.31 ±0.02ab | 2.48 ±0.10ab | 2.58 ±0.05a | 2.43 ±0.17ab | 2.43 ±0.06ab | |||||||
| 饲料转化率 FCR | 0.95 ±0.03 | 0.96 ±0.03 | 0.98 ±0.02 | 1.06 ±0.05 | 1.08 ±0.02 | 1.08 ±0.08 | 1.04 ±0.03 | |||||||
| 蛋白质效率 PER | 2.17 ±0.07 | 2.17 ±0.06 | 2.07 ±0.03 | 1.93 ±0.09 | 1.88 ±0.04 | 1.94 ±0.14 | 2.99 ±0.06 | |||||||
| 蛋白质沉积率 PPV/% | 42.35 ±1.43 | 41.67 ±1.46 | 40.89 ±1.13 | 38.22 ±1.69 | 37.42 ±1.11 | 38.21 ±2.90 | 38.73 ±0.93 | |||||||
2.3 浒苔生物制品对云龙石斑鱼鱼体成分组成及糖、脂代谢的影响
表5 浒苔生物制品对云龙石斑鱼鱼体成分组成及糖、脂代谢的影响Table 5 Effects of E. prolifera bio-products on body composition and glucose and lipid metabolism of Yunlong grouper |
| 项目 Items | 对照组 Control group | EPH0.2%组 EPH0.2% group | EPH0.4%组 EPH0.4% group | EPP0.03%组 EPP0.03% group | EPM3.0%组 EPM3.0% group | DMPT0.1%组 DMPT0.1% group | SP1.0%组 SP1.0% group | |||||||||||||||
|---|---|---|---|---|---|---|---|---|---|---|---|---|---|---|---|---|---|---|---|---|---|---|
| 鱼体组成Body composition of fish/% | ||||||||||||||||||||||
| 水分 Moisture | 70.57 ±0.67 | 69.58 ±0.64 | 70.21 ±0.36 | 70.84 ±0.28 | 71.03 ±0.40 | 71.11 ±0.16 | 70.81 ±0.38 | |||||||||||||||
| 粗灰分 Ash | 4.47 ±0.05 | 4.45 ±0.09 | 4.46 ±0.02 | 4.66 ±0.06 | 4.65 ±0.11 | 4.50 ±0.12 | 4.47 ±0.05 | |||||||||||||||
| 粗脂肪 EE | 5.63 ±0.59 | 6.81 ±0.39 | 6.53 ±0.93 | 6.07 ±0.42 | 5.33 ±0.3 | 5.73 ±0.12 | 5.71 ±0.29 | |||||||||||||||
| 粗蛋白质 CP | 18.49 ±0.11ab | 19.48 ±0.33a | 18.71 ±0.36ab | 17.56 ±0.25b | 18.18 ±0.48ab | 18.55 ±0.15ab | 19.05 ±0.14a | |||||||||||||||
| 脂代谢指标Lipid metabolism indexes | ||||||||||||||||||||||
| 血清甘油三脂 Serum TG/(mmol/L) | 2.10 ±0.09ab | 1.52 ±0.05c | 1.77 ±0.06abc | 2.04 ±0.09ab | 1.69 ±0.05bc | 2.17 ±0.11a | 1.97 ±0.15ab | |||||||||||||||
| 肝脏甘油三酯 Liver TG/(mmol/L) | 3.66 ±0.81a | 1.67 ±0.23b | 1.85 ±0.29ab | 2.27 ±0.39ab | 2.73 ±0.31ab | 2.16 ±0.21ab | 3.38 ±0.30ab | |||||||||||||||
| 肝脏粗脂肪 LCL/% | 10.94 ±0.69 | 9.77 ±0.56 | 10.24 ±0.07 | 11.32 ±0.62 | 11.33 ±0.78 | 10.72 ±0.75 | 10.91 ±0.83 | |||||||||||||||
| 脂肪沉积率 LPV/% | 75.27 ±11.31ab | 95.82 ±8.38a | 74.80 ±13.94ab | 61.50 ±4.83ab | 49.05 ±3.48b | 54.00 ±4.60b | 59.61 ±2.85ab | |||||||||||||||
| 血清高密度脂蛋白胆固醇 Serum HDL-C/ (mmol/L) | 2.72 ±0.22b | 3.05 ±0.23ab | 3.60 ±0.04a | 3.16 ±0.23ab | 3.33 ±0.24ab | 3.00 ±0.24ab | 2.66 ±0.10b | |||||||||||||||
| 血清低密度脂蛋白胆固醇 Serum LDL-C/ (mmol/L) | 0.54 ±0.05a | 0.49 ±0.05ab | 0.34 ±0.03b | 0.34 ±0.04b | 0.32 ±0.05b | 0.52 ±0.04a | 0.51 ±0.10a | |||||||||||||||
| 糖代谢指标Glucose metabolism index | ||||||||||||||||||||||
| 血清葡萄糖 Serum GLU/(mmol/L) | 4.94 ±0.57ab | 3.96 ±0.41b | 4.75 ±1.05ab | 8.01 ±0.62a | 5.55 ±0.92ab | 4.69 ±0.97ab | 4.66 ±0.69ab | |||||||||||||||
2.4 浒苔生物制品对云龙石斑鱼血清抗氧化、免疫指标的影响
表6 浒苔生物制品对云龙石斑鱼血清抗氧化、免疫指标的影响Table 6 Effects of E. prolifera bio-products on serum antioxidant and immune indexes of Yunlong grouper |
| 项目 Items | 对照组 Control group | EPH0.2%组 EPH0.2% group | EPH0.4%组 EPH0.4% group | EPP0.03%组 EPP0.03% group | EPM3.0%组 EPM3.0% group | DMPT0.1%组 DMPT0.1% group | SP1.0%组 SP1.0% group | |||||||
|---|---|---|---|---|---|---|---|---|---|---|---|---|---|---|
| 抗氧化指标Antioxidant indexes | ||||||||||||||
| 还原型谷胱甘肽 GSH/(mg/L) | 9.30 ±1.63 | 8.76 ±1.13 | 11.07 ±2.92 | 16.14 ±3.37 | 16.14 ±3.23 | 16.67 ±2.70 | 11.61 ±2.73 | |||||||
| 总抗氧化能力 T-AOC/(U/mL) | 6.52 ±1.60b | 14.16 ±2.67a | 8.88 ±0.59ab | 10.86 ±0.55ab | 7.84 ±1.00ab | 8.45 ±0.87ab | 8.11 ±1.18ab | |||||||
| 超氧化物歧化酶 SOD/(U/mL) | 21.43 ±2.66b | 33.37 ±2.52ab | 34.94 ±2.63a | 27.67 ±2.72ab | 24.53 ±1.48ab | 26.74 ±3.22ab | 26.45 ±3.37ab | |||||||
| 丙二醛 MDA/(nmol/mL) | 23.64 ±1.52a | 13.15 ±1.12b | 13.09 ±0.88b | 15.04 ±0.96b | 17.85 ±1.13b | 18.32 ±1.41ab | 17.71 ±1.08b | |||||||
| 谷胱甘肽过氧化物酶 GSH-Px/(U/mL) | 1 074 ±115 | 1 172 ±88 | 1 258 ±88 | 1 011 ±75 | 1 132 ±91 | 1 201 ±177 | 1 185 ±68 | |||||||
| 免疫指标Immune indexes | ||||||||||||||
| 酸性磷酸酶 ACP/(U/dL) | 3.63 ±0.55 | 2.83 ±0.15 | 2.71 ±0.27 | 3.23 ±0.44 | 2.61 ±0.17 | 2.94 ±0.44 | 3.03 ±0.39 | |||||||
| 碱性磷酸酶 AKP/(U/dL) | 11.59 ±0.85 | 15.10 ±0.89 | 11.53 ±2.35 | 12.81 ±1.93 | 11.88 ±2.27 | 13.54 ±0.95 | 10.42 ±0.59 | |||||||
| 溶菌酶 LZM/(μg/mL) | 1.79 ±0.09ab | 1.81 ±0.06ab | 2.05 ±0.03a | 1.86 ±0.06ab | 2.00 ±0.04ab | 1.79 ±0.05ab | 1.75 ±0.06b | |||||||
| 谷丙转氨酶 GPT/卡门氏单位 | 84.07 ±6.71 | 77.24 ±4.45 | 91.28 ±8.64 | 94.36 ±4.51 | 78.96 ±9.40 | 83.15 ±9.28 | 78.20 ±9.83 | |||||||
| 谷草转氨酶 GOT/卡门氏单位 | 55.57 ±6.90 | 49.25 ±6.61 | 49.07 ±9.60 | 50.65 ±5.20 | 59.92 ±6.31 | 53.34 ±4.67 | 51.57 ±6.20 | |||||||
2.5 浒苔生物制品对云龙石斑鱼肝脏的影响
2.6 浒苔生物制品对云龙石斑鱼头肾组织免疫相关基因表达的影响
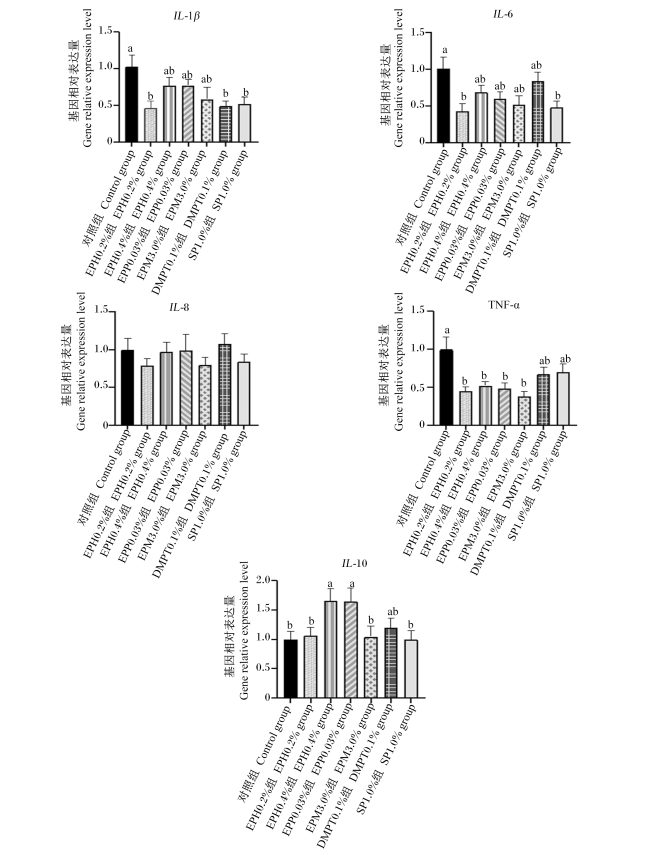
图4 浒苔生物制品对云龙石斑鱼头肾组织免疫相关基因表达的影响IL-1β:白细胞介素-1β interleukin-1β;IL-6:白细胞介素-6 interleukin-6;IL-8:白细胞介素-8 interleukin-8;TNF-α:肿瘤坏死因子-α tumor necrosis factor-α;IL-10:白细胞介素-10 interleukin-10。 柱状图中不同字母表示不同组间有显著差异(P<0.05)。 Fig.4 Effects of E. prolifera bio-products on expression of immune-related genes in head kidney of Yunlong grouper Bars with different letters mean significant difference between groups (P<0.05). |