1 材料与方法
1.1 试验材料
1.2 试验设计
表1 基础饲粮组成及营养水平(风干基础)Table 1 Composition and nutrient levels of the basal diet (air-dry basis) % |
| 原料Ingredients | 含量Content | 营养水平Nutrient levels2) | 含量Content | |
|---|---|---|---|---|
| 玉米Corn | 62.60 | 代谢能ME/(MJ/kg) | 11.09 | |
| 豆粕Soybean meal | 26.45 | 干物质DM | 90.19 | |
| 石粉Limestone | 8.65 | 粗蛋白质CP | 16.42 | |
| 磷酸氢钙CaHPO4 | 1.30 | 钙Ca | 3.61 | |
| 食盐NaCl | 0.30 | 总磷TP | 0.59 | |
| 氯化胆碱Choline chloride (50%) | 0.10 | 蛋氨酸Met | 0.35 | |
| DL-蛋氨酸DL-methionine | 0.10 | 赖氨酸Lys | 0.85 | |
| 预混料Premix1) | 0.50 | 锰Mn/(mg/kg) | 21.77 | |
| 合计Total | 100.00 |
1)预混料为每千克饲粮提供 The premix provided the following per kg of the diet: VA 8 800 IU,VD3 3 300 IU,VE 20 IU,VB12 23 μg,核黄素 riboflavin 5.5 mg,烟酸 niacin 30 mg,泛酸 pantothenic acid 8 mg,VK3 1.2 mg,叶酸 folic acid 1.75 mg,吡哆醇 pyridoxine 1.2 mg,硫胺素 thiamine 1.7 mg,生物素 biotin 55 μg,Cu [Cu2(OH)3Cl] 8.12 mg,Fe (FeSO4·H2O) 80.1 mg,Zn (ZnSO4·H2O) 80.04 mg,I [Ca(IO3)2] 1.2 mg,Se (Na2SeO3) 0.3 mg。 2)粗蛋白质、钙、总磷、锰为实测值,其他为计算值,根据《动物营养参数与饲养标准》[21]计算。CP, Ca, TP and Mn were measured values, while the others were calculated values, which calculated according to Nutrition Parameter and Feeding Standard for Animals[21]. |
1.3 饲养管理
1.4 测定指标和方法
1.4.1 产蛋性能测定
1.4.2 血清激素水平测定
1.4.3 生殖器官发育指标测定
1.4.4 肝脏指数和腹脂率测定
1.4.5 肝脏脂肪代谢相关生化指标测定
1.4.6 肝脏组织油红O染色切片观察
1.4.7 饲粮营养成分测定
1.5 统计分析
2 结果
2.1 甘氨酸锰对产蛋后期蛋鸡产蛋性能的影响
表2 甘氨酸锰对产蛋后期蛋鸡产蛋性能的影响Table 2 Effects of manganese glycine on laying performance of laying hens during late laying period |
| 项目 Items | 组别Groups | P值 P-value | |||
|---|---|---|---|---|---|
| 对照Control | Ⅰ | Ⅱ | Ⅲ | ||
| 产蛋率Laying rate/% | 90.70±2.19 | 93.58±0.98 | 91.47±2.56 | 92.21±0.97 | 0.071 |
| 平均蛋重Average egg weight/g | 63.41±0.80 | 63.21±0.78 | 63.41±0.73 | 63.86±1.17 | 0.633 |
| 日均蛋重Average daily egg mass/(g/d) | 57.52±1.86 | 59.15±0.98 | 58.00±1.75 | 58.89±1.53 | 0.272 |
| 平均日采食量Average daily feed intake/(g/d) | 119.05±1.40 | 118.40±1.42 | 118.97±1.28 | 119.45±1.64 | 0.659 |
| 料蛋比Feed to egg ratio | 2.07±0.07 | 2.00±0.04 | 2.05±0.09 | 2.03±0.06 | 0.261 |
同行数据肩标不同小写字母表示差异显著(P<0.05),相同或无字母表示差异不显著(P>0.05)。下表同。 | |
In the same row, values with different small letter superscripts mean significant difference (P<0.05), while with the same or no letter superscripts mean no significant difference (P>0.05). The same as below. |
2.2 甘氨酸锰对产蛋后期蛋鸡各周龄产蛋率的影响
表3 甘氨酸锰对产蛋后期蛋鸡各周龄产蛋率的影响Table 3 Effects of manganese glycine on laying rate in each weeks of age of laying hens during late laying period % |
| 周龄 Weeks of age | 组别Groups | P值 P-value | |||
|---|---|---|---|---|---|
| 对照Control | Ⅰ | Ⅱ | Ⅲ | ||
| 71 | 94.51±2.58 | 95.45±4.25 | 94.27±1.86 | 96.03±2.41 | 0.704 |
| 72 | 93.94±2.25 | 94.95±3.06 | 94.35±2.90 | 95.93±1.50 | 0.558 |
| 73 | 93.37±4.04 | 94.46±2.29 | 94.43±4.48 | 95.82±1.11 | 0.646 |
| 74 | 93.33±2.78 | 95.95±2.99 | 93.99±4.31 | 91.43±3.13 | 0.170 |
| 75 | 92.01±2.65 | 94.28±2.01 | 92.66±4.34 | 91.46±2.53 | 0.420 |
| 76 | 90.69±3.14 | 92.60±2.49 | 91.33±5.93 | 91.49±2.66 | 0.854 |
| 77 | 90.18±2.05 | 92.57±1.70 | 88.98±3.72 | 91.77±4.23 | 0.223 |
| 78 | 90.06±1.58 | 93.31±1.54 | 89.70±3.62 | 91.57±2.84 | 0.089 |
| 79 | 89.93±3.93 | 94.05±2.22 | 90.43±5.36 | 91.37±5.73 | 0.149 |
| 80 | 85.52±3.08b | 90.40±1.94a | 88.43±2.99ab | 89.43±1.78a | 0.018 |
| 81 | 86.65±3.98 | 91.72±1.26 | 89.08±3.25 | 89.77±2.65 | 0.054 |
| 82 | 87.86±5.77c | 93.15±2.24a | 89.77±5.82b | 90.13±3.89b | 0.046 |
| 71~76 | 92.98±2.03 | 94.61±1.70 | 93.51±2.91 | 93.69±1.94 | 0.634 |
| 77~82 | 88.38±2.57b | 92.53±1.28a | 89.40±2.86b | 90.69±2.34ab | 0.034 |
2.3 甘氨酸锰对产蛋后期蛋鸡血清雌二醇和孕酮水平的影响
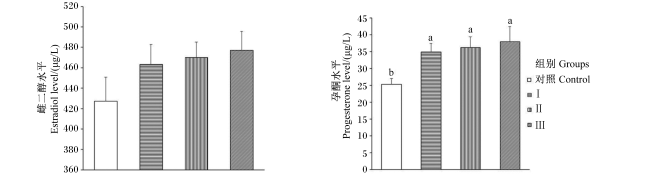
图1 甘氨酸锰对产蛋后期蛋鸡血清雌二醇和孕酮水平的影响数据柱标相同小写字母表示差异不显著(P>0.05),不同小写字母表示差异显著(P<0.05)。下图同。 Fig.1 Effects of manganese glycine on serum estradiol and progesterone levels of laying hens during late laying period Value columns with the same small letters mean no significant difference (P>0.05), while with different small letters mean significant difference (P<0.05). The same as below. |
2.4 甘氨酸锰对产蛋后期蛋鸡生殖器官发育指标的影响
表4 甘氨酸锰对产蛋后期蛋鸡生殖器官发育指标的影响Table 4 Effects of manganese glycine on reproductive organ development indexes of laying hens during late laying period |
| 项目 Items | 组别Groups | P值 P-value | |||
|---|---|---|---|---|---|
| 对照Control | Ⅰ | Ⅱ | Ⅲ | ||
| 排卵前卵泡数Preovulatory follicle amount/个 | 6.17±0.75 | 5.67±0.82 | 5.17±0.75 | 5.17±0.41 | 0.067 |
| 小黄卵泡数Small yellow follicle amount/个 | 20.33±5.65 | 24.83±7.60 | 23.67±4.97 | 20.17±4.75 | 0.424 |
| 大白卵泡数Big white follicle amount/个 | 18.67±5.28 | 19.33±6.02 | 22.83±4.26 | 23.50±4.46 | 0.274 |
| 输卵管长度Oviduct length/cm | 57.90±9.11 | 62.33±3.20 | 60.60±6.09 | 62.43±2.09 | 0.509 |
| 输卵管重Oviduct weight/g | 80.85±7.93 | 78.22±9.45 | 78.53±8.48 | 73.50±16.04 | 0.704 |
| 卵巢基质部重Ovary stroma weight/g | 2.39±0.43 | 2.58±0.42 | 2.67±0.85 | 2.34±0.57 | 0.748 |
| 排卵前卵泡重Preovulatory follicle weight/g | 45.73±15.85 | 38.72±6.78 | 37.44±8.13 | 34.35±6.34 | 0.278 |
| 小黄卵泡重Small yellow follicle weight/g | 2.87±1.03 | 3.60±1.03 | 3.56±0.73 | 2.84±0.36 | 0.241 |
| 大白卵泡重Big white follicle weight/g | 0.68±0.30 | 0.52±0.21 | 0.70±0.15 | 0.75±0.22 | 0.350 |
| 输卵管长度体重比 Oviduct length to body weight/(cm/kg) | 28.11±4.12 | 27.80±2.26 | 29.79±3.63 | 29.34±2.22 | 0.656 |
| 输卵管指数Oviduct index/(g/kg) | 39.52±6.34 | 34.87±4.41 | 38.50±3.70 | 34.40±6.97 | 0.303 |
| 卵巢基质部指数Ovary stroma index/(g/kg) | 1.16±0.16 | 1.15±0.17 | 1.30±0.38 | 1.11±0.31 | 0.647 |
| 排卵前卵泡指数 Preovulatory follicle index/(g/kg) | 22.11±7.34 | 17.43±4.17 | 18.54±5.05 | 16.11±2.96 | 0.243 |
| 小黄卵泡指数 Small yellow follicle index/(g/kg) | 1.39±0.49 | 1.61±0.47 | 1.74±0.35 | 1.33±0.17 | 0.262 |
| 大白卵泡指数 Big white follicle index/(g/kg) | 0.32±0.14 | 0.23±0.09 | 0.34±0.06 | 0.35±0.11 | 0.193 |
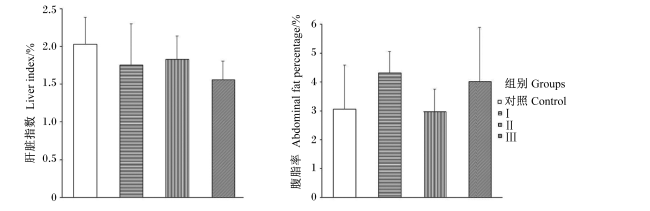
2.5 甘氨酸锰对产蛋后期蛋鸡肝脏指数和腹脂率的影响
2.6 甘氨酸锰对产蛋后期蛋鸡肝脏脂肪代谢相关生化指标的影响
表5 甘氨酸锰对产蛋后期蛋鸡肝脏脂肪代谢相关生化指标的影响Table 5 Effects of manganese glycine on liver biochemical indexes related to liver fat metabolism of laying hens during late laying periodmmol/g prot |
| 项目 Items | 组别Groups | P值 P-value | |||
|---|---|---|---|---|---|
| 对照Control | Ⅰ | Ⅱ | Ⅲ | ||
| 甘油三酯Triglyceride | 0.305±0.026a | 0.207±0.029b | 0.181±0.013bc | 0.164±0.022c | <0.001 |
| 总胆固醇Total cholesterol | 1.506±0.070a | 1.154±0.085b | 1.079±0.064bc | 1.016±0.067c | <0.001 |
| 游离脂肪酸Free fatty acid | 0.202±0.013a | 0.140±0.011b | 0.129±0.015b | 0.134±0.019b | <0.001 |
| 高密度脂蛋白胆固醇 High-density lipoprotein cholesterol | 0.060±0.005c | 0.088±0.005b | 0.094±0.003a | 0.099±0.005a | <0.001 |
| 低密度脂蛋白胆固醇 Low-density lipoprotein cholesterol | 0.262±0.018a | 0.180±0.008b | 0.161±0.006c | 0.150±0.014c | <0.001 |
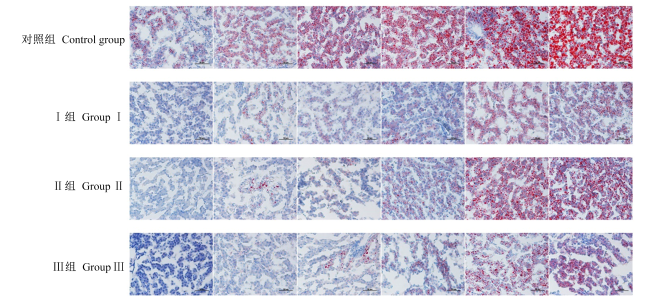
2.7 甘氨酸锰对产蛋后期蛋鸡肝脏脂滴面积和占比及肝脏组织油红O染色的影响
表6 甘氨酸锰对产蛋后期蛋鸡肝脏脂滴面积和占比的影响Table 6 Effects of manganese glycine on area and ratio of lipid droplet in liver of laying hens during late laying period |
| 项目 Items | 组别Groups | P值 P-value | |||
|---|---|---|---|---|---|
| 对照Control | Ⅰ | Ⅱ | Ⅲ | ||
| 组织视野面积 Tissue field area/μm2 | 40 216.8±1 664.0 | 37 839.2±1 124.2 | 39 640.1±1 777.1 | 36 220.2±980.6 | 0.194 |
| 脂滴面积 Lipid droplet area/μm2 | 10 076.2±1 947.8a | 855.3±233.8b | 3 511.4±926.5b | 1 085.7±379.8b | <0.001 |
| 脂滴占比 Lipid droplet ratio/% | 23.08±3.84a | 2.24±0.63b | 8.51±2.05b | 3.04±1.04b | <0.001 |