

1 材料与方法
1.1 菌种来源
1.2 试验仪器
1.3 试验试剂
1.4 B10-Glu、B10-LCI基因克隆及原核表达
1.4.1 B10-Glu、B10-LCI基因克隆
1.4.2 B10-Glu、B10-LCI原核表达
1.4.3 B10-Glu、B10-LCI纯化及活性验证
1.5 B10-Glu、B10-LCI MIC的测定
1.6 B10-Glu、B10-LCI作用效果的研究
1.6.1 B10-Glu、B10-LCI对黄曲霉微观形态的影响
1.6.2 B10-Glu、B10-LCI对黄曲霉细胞膜通透性的影响
1.6.3 B10-Glu、B10-LCI对黄曲霉线粒体膜电位的影响
1.6.4 B10-Glu、B10-LCI对黄曲霉胞内活性氧(ROS)含量及过氧化氢酶(CAT)、超氧化物歧化酶(SOD)活性的影响
1.7 数据统计分析
2 结果与分析
2.1 B10-Glu、B10-LCI克隆结果
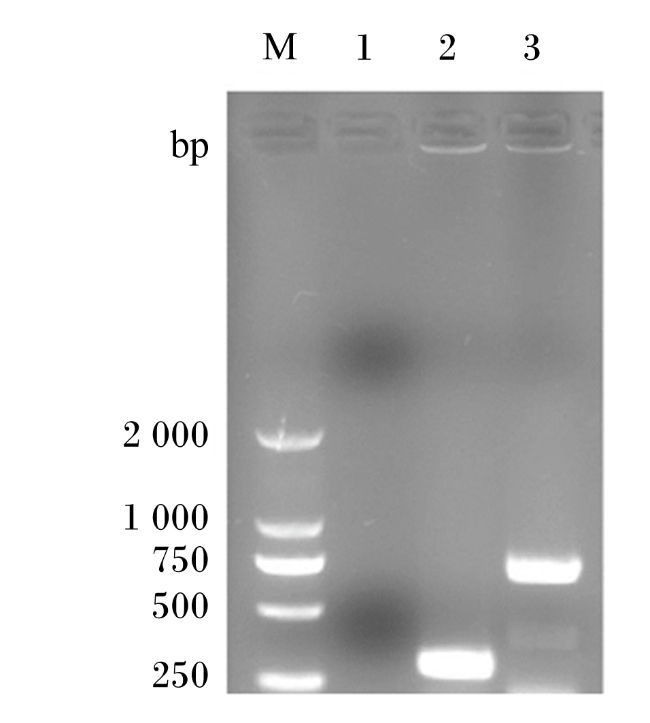
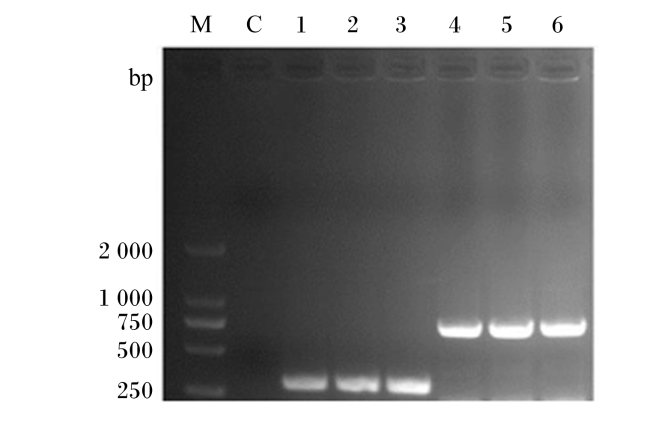
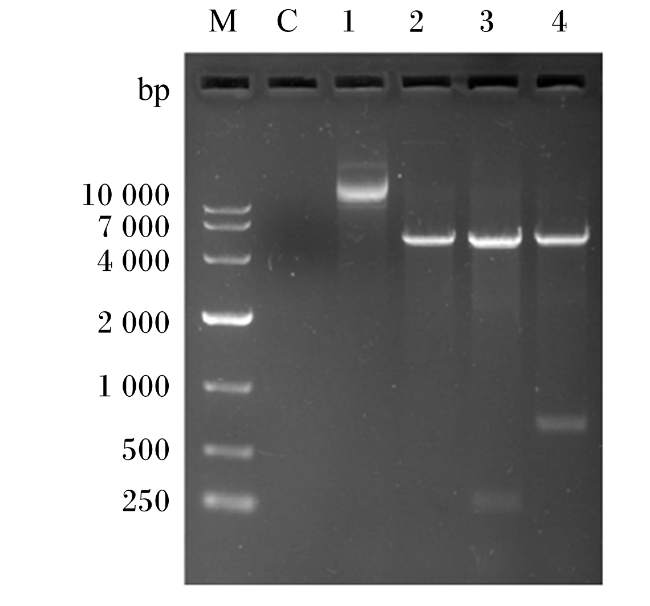
图3 重组质粒双酶切验证M1: DL10000 DNA标志物; C: 阴性对照; 1: 空质粒不酶切; 2:空质粒双酶切; 3: B10-LCI重组质粒双酶切; 4: B10-Glu重组质粒双酶切。 Fig.3 Verification of recombinant plasmid by double-enzyme digestion M1: DL10000 DNA marker; C: negative control; 1: empty plasmid is not digested; 2: double-enzyme digestion of empty plasmid; 3: double-enzyme digestion of recombinant plasmid B10-LCI; 4: double-enzyme digestion of recombinant plasmid B10-Glu. |
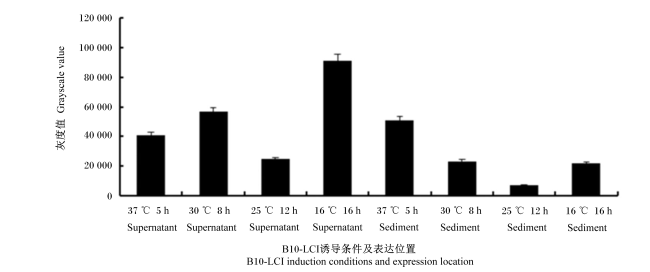
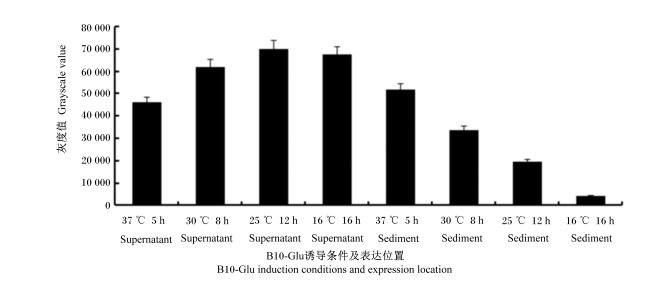
2.2 B10-Glu、B10-LCI表达结果
表1 B10-Glu、B10-LCI分析结果Table 1 B10-Glu, B10-LCI analysis results |
| 目的蛋白名称 Names of target proteins | 预计分子质量 Expected molecular weight/ku | 预计等电点 Expected isoelectric point | 不稳定系数 Instability coefficient | 脂肪族指数 Aliphatic index | 亲水性总平均值 Hydrophilicity total average value | 预计半衰期 Expected half-life |
|---|---|---|---|---|---|---|
| 抗菌肽LCI B10-LCI | 9 900.34 | 9.44 | 24.80 | 81.17 | 0.081 | 体外哺乳动物 网织红细胞:30 h 酵母菌:>20 h 大肠杆菌:>10 h |
| 1,3-1,4-β-D-葡聚糖 4-葡聚糖水解酶 B10-Glu | 27 402.67 | 6.89 | 17.01 | 60.62 | -0.430 |
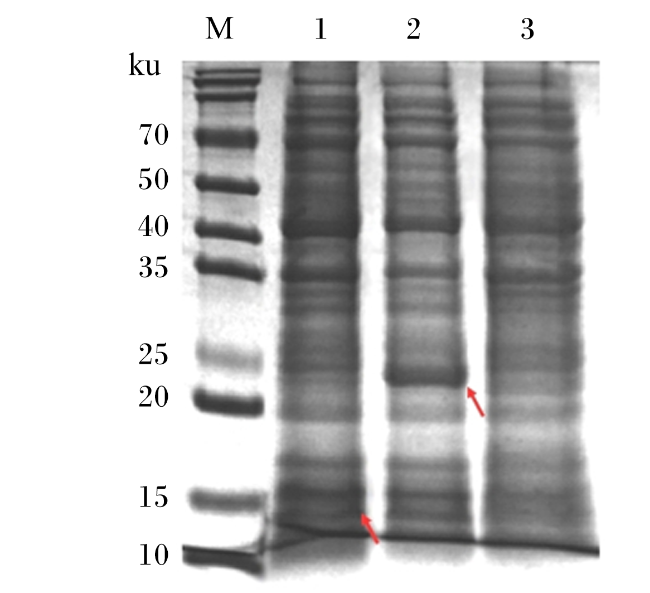
2.3 B10-Glu、B10-LCI纯化及抑菌效果
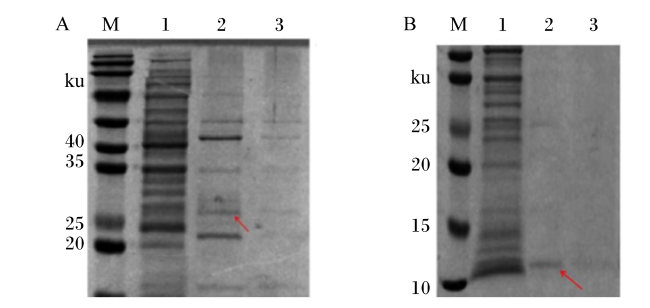
图7 B10-Glu、B10-LCI纯化结果M: 蛋白标志物; 1: B10-Glu未纯化组; 2: B10-Glu 200 mmol/L咪唑纯化组; 3: B10-Glu 300 mmol/L咪唑纯化组。 Fig.7 Purification results of B10-Glu and B10-LCI M: protein marker; 1: B10-Glu unpurified group; 2: B10-Glu 200 mmol/L imidazole purification group; 3: B10-Glu 300 mmol/L imidazole purification group. |

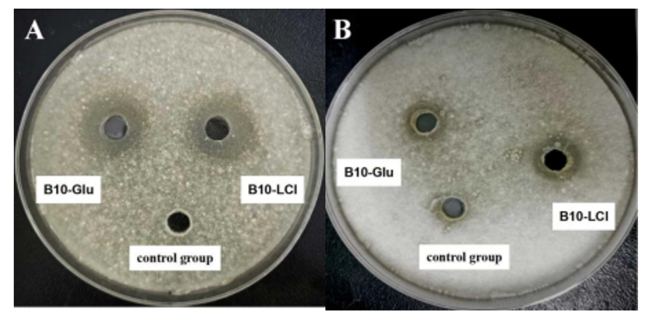
图8 B10-Glu、B10-LCI蛋白抑菌活性验证结果A: B10-Glu未纯化组; B: B10-Glu纯化组;C: B10-LCI未纯化组; D: B10-LCI纯化组。 Fig.8 Validation results of bacteriostatic activity of B10-Glu and B10-LCI proteins A: B10-Glu unpurified group; B: B10-Glu purification group; C: B10-LCI unpurified group; D: B10-LCI purification group. |
2.4 B10-Glu、B10-LCI MIC测定结果
2.5 B10-Glu、B10-LCI抑菌作用效果分析
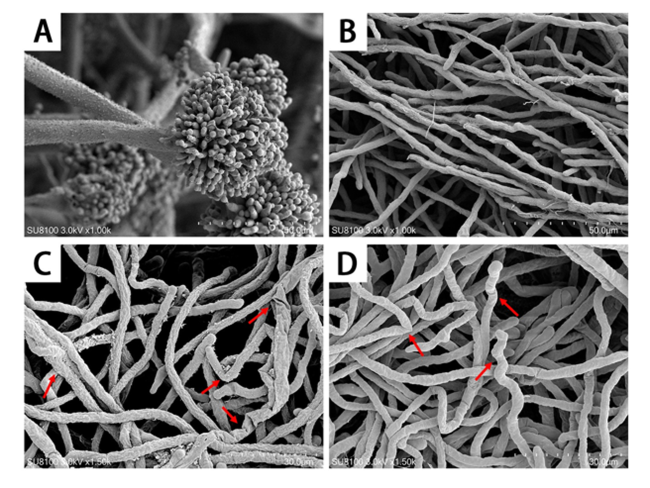
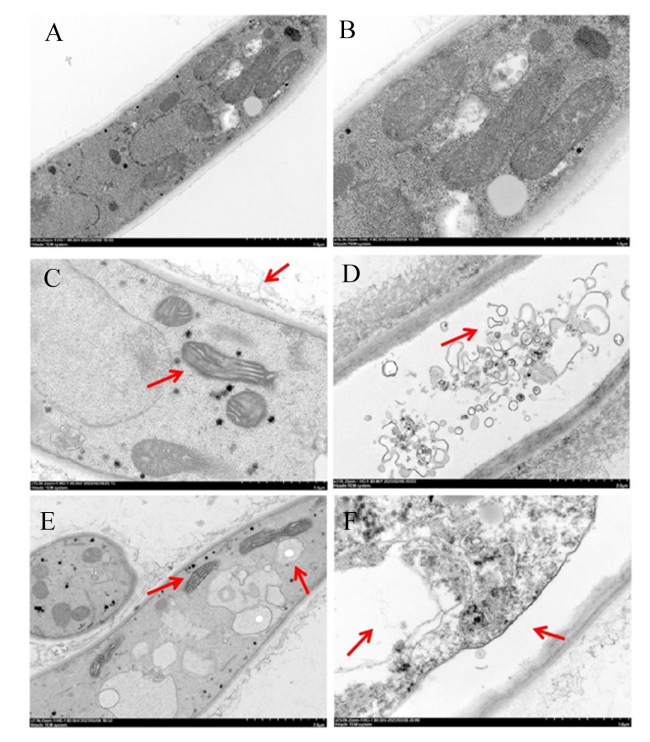
2.5.1 黄曲霉微观形态变化结果
2.5.2 黄曲霉细胞膜通透性变化结果
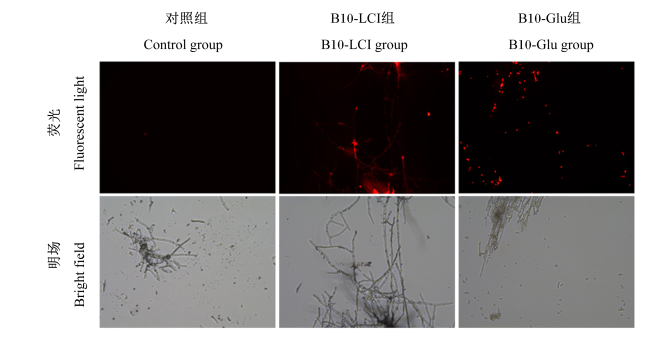
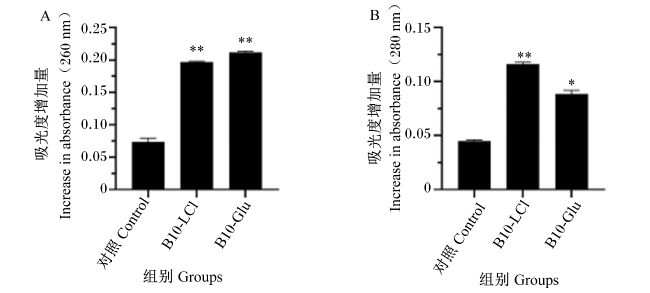
图13 黄曲霉内容物泄露结果A: 黄曲霉核酸泄露情况; B: 黄曲霉蛋白泄露情况。“*”表示试验组与对照组相比有显著差异(P<0.05), “**”表示试验组与对照组相比有极显著差异(P<0.01)。 Fig.13 Leakage results of Aspergillusflavus content A: Aspergillusflavus nucleic acid leakage situation; B: Aspergillusflavus protein leakage situation. “*” indicates a signigicant difference between the experimental group and the control group (P<0.05),“**” indicates a significant difference between the experimental group and the control group (P<0.01). |
2.5.3 黄曲霉线粒体膜电位变化结果
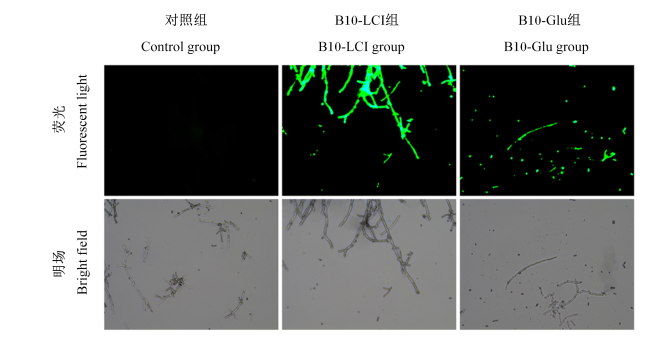
2.5.4 黄曲霉胞内ROS含量及CAT、SOD活性变化结果
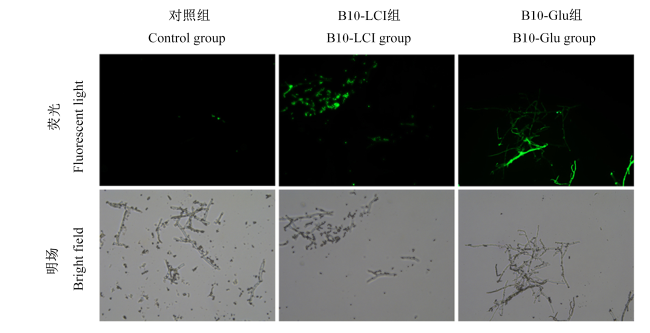
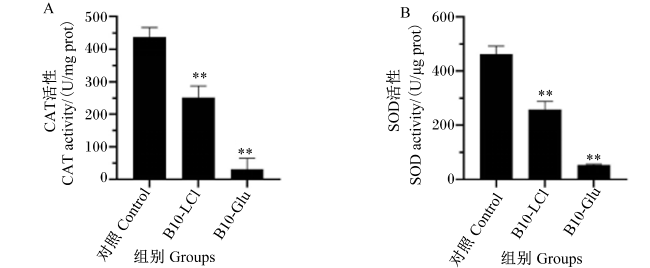


图16 黄曲霉CAT和SOD活性结果A: 黄曲霉CAT活性; B: 黄曲霉SOD活性。“**”表示试验组与对照组相比有极显著差异(P<0.01)。 Fig.16 Results of CAT and SOD activities of Aspergillusflavus A: CAT activity of Aspergillusflavus; B: SOD activity of Aspergillusflavus. “**” indicates a significant difference between the experimental group and the control group (P<0.01). |