

1 材料与方法
1.1 材料和试剂
1.2 主要仪器
1.3 公英散提取流程和提取率判定
1.3.1 公英散的提取流程
1.3.2 公英散提取率的判定
绿原酸得率(%)=[N×V×(A-0.002 7)/0.047 5]/W。
1.4 单因素试验
1.5 Plackett-Burman试验
表1 Plackett-Burman试验因素和水平Table 1 Plackett-Burman test factors and levels |
| 因素 Factors | 水平Levels | |
|---|---|---|
| -1 | +1 | |
| 超声温度Ultrasonic temperature/℃ (A) | 50 | 80 |
| 超声时间Ultrasonic time/min (B) | 30 | 90 |
| 液料比Liquid-material ratio (C) | 20∶1 | 40∶1 |
| 超声功率Ultrasonic power/W (D) | 350 | 490 |
1.6 Box-Behnken响应面优化试验
表2 Box-Behnken响应面试验因素和水平Table 2 Box-Behnken response surface test factors and levels |
| 因素 Factors | 水平Levels | ||
|---|---|---|---|
| -1 | 0 | +1 | |
| 超声温度Ultrasonic temperature/℃(A) | 50 | 65 | 80 |
| 超声时间Ultrasonic time/min (B) | 30 | 60 | 90 |
| 液料比Liquid-material ratio (C) | 20∶1 | 30∶1 | 40∶1 |
1.7 抗氧化试验
1.7.1 1,1-二苯基-2-三硝基苯肼(DPPH)自由基清除试验
DPPH自由基清除率(%)=[1-(AⅠ-AⅡ)/AⅢ]×100。
1.7.2 羟自由基清除试验
羟自由基清除率(%)=[1-(AⅠ-AⅡ)/AⅢ]×100。
1.8 公英散水提物的体外抑菌试验
1.8.1 最低抑菌浓度(MIC)和最低杀菌浓度(MBC)
1.8.2 抑菌圈直径的测定
1.9 统计分析方法
2 结果与分析
2.1 单因素试验
2.1.1 超声温度对绿原酸得率的影响
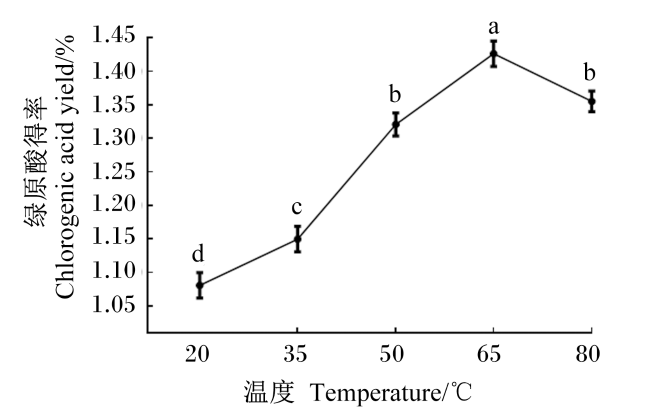
图1 超声温度对绿原酸得率的影响数据标相同小写字母表示差异不显著(P>0.05),不同小写字母表示差异显著(P<0.05)。下图同。 Fig.1 Effects of ultrasonic temperature on chlorogenic acid yield (n=3) Values with the same small letter mean no significant difference (P>0.05), while with different small letters mean significant difference (P<0.05). The same as below. |
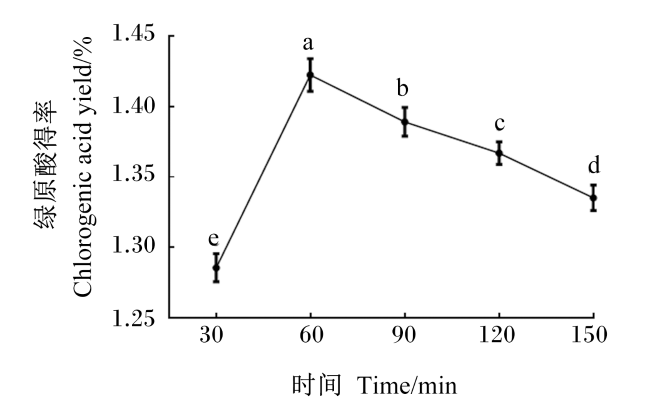
2.1.2 超声时间对绿原酸得率的影响
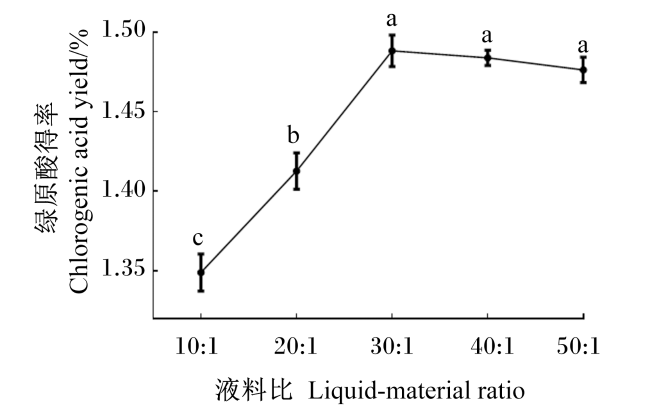
2.1.3 液料比对绿原酸得率的影响
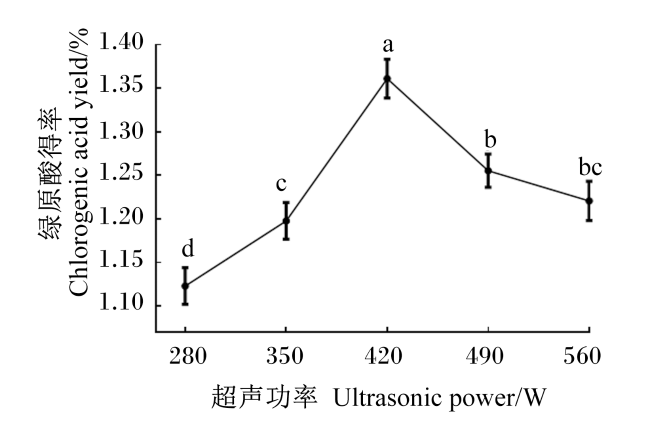
2.1.4 超声功率对绿原酸得率的影响
2.2 Plackett-Burman试验
表3 Plackett-Burman试验结果Table 3 Results of Plackett-Burman test |
| 试验号 Test No. | 因素Factors | 绿原酸得率 Chlorogenic acid yield/% | |||
|---|---|---|---|---|---|
| A | B | C | D | ||
| 1 | 1(80) | 1(90) | 1(40∶1) | -1(350) | 2.48 |
| 2 | 1 | 1 | -1(20∶1) | -1 | 2.41 |
| 3 | 1 | 1 | -1 | 1(490) | 2.25 |
| 4 | 1 | -1(30) | 1 | 1 | 2.43 |
| 5 | 1 | -1 | 1 | 1 | 2.43 |
| 6 | -1(50) | -1 | 1 | -1 | 1.99 |
| 7 | 1 | -1 | -1 | -1 | 1.98 |
| 8 | -1 | 1 | -1 | 1 | 1.92 |
| 9 | -1 | 1 | 1 | 1 | 2.11 |
| 10 | -1 | 1 | 1 | -1 | 2.04 |
| 11 | -1 | -1 | -1 | 1 | 1.49 |
| 12 | -1 | -1 | -1 | -1 | 1.43 |
A:超声温度 ultrasonic temperature;B:超声时间 ultrasonic time;C:液料比 liquid-material ratio;D:超声功率 ultrasonic power。下表同 the same as below。 |
表4 Plackett-Burman试验各因素显著性分析Table 4 Significant analysis of various factors in Plackett-Burman test |
| 来源 Sources | 自由度 DF | 平方和 Adj SS | 均方和 Adj MS | F值 F-value | P值 P-value | 显著性 Significance |
|---|---|---|---|---|---|---|
| 模型Model | 4 | 1.268 5 | 0.317 1 | 24.36 | <0.001 | ** |
| A | 1 | 0.750 0 | 0.750 0 | 57.61 | <0.001 | ** |
| B | 1 | 0.177 6 | 0.177 6 | 13.64 | 0.008 | ** |
| C | 1 | 0.333 3 | 0.333 3 | 25.60 | 0.001 | ** |
| D | 1 | 0.007 5 | 0.007 5 | 0.58 | 0.473 | |
| 误差Error | 7 | 0.091 1 | 0.013 0 | |||
| 失拟Lack of fit | 6 | 0.091 1 | 0.015 2 | |||
| 纯误差Pure error | 1 | <0.000 1 | <0.000 1 | |||
| 合计Total | 11 | 1.359 6 |
决定系数=93.30%,校正决定系数=89.47%,**表示极显著(P<0.01)。 | |
R2=93.30%, =89.47%, ** indicates extremely significant (P<0.01). |
2.3 Box-Behnken响应面试验
表5 Box-Bchnken响应面试验结果Table 5 Results of Box-Bchnken response surface test |
| 试验号 Test No. | 因素Factors | 绿原酸得率 Chlorogenic acid yield/% | ||
|---|---|---|---|---|
| A | B | C | ||
| 1 | 1 | -1 | 0 | 2.51 |
| 2 | 0 | -1 | -1 | 1.55 |
| 3 | 0 | 0 | 0 | 2.39 |
| 4 | 1 | 0 | -1 | 2.43 |
| 5 | -1 | 0 | -1 | 1.51 |
| 6 | 0 | -1 | 1 | 2.28 |
| 7 | 0 | 0 | 0 | 2.31 |
| 8 | -1 | -1 | 0 | 1.54 |
| 9 | 1 | 1 | 0 | 2.62 |
| 10 | 0 | 0 | 0 | 2.35 |
| 11 | 0 | 0 | 0 | 2.28 |
| 12 | 0 | 0 | 0 | 2.31 |
| 13 | -1 | 0 | 1 | 2.27 |
| 14 | -1 | 1 | 0 | 2.16 |
| 15 | 0 | 1 | 1 | 2.61 |
| 16 | 1 | 0 | 1 | 2.66 |
| 17 | 0 | 1 | -1 | 2.16 |
表6 回归模型方差分析结果Table 6 Results of variance analysis of regression model |
| 来源 Source | 平方和 Adj SS | 自由度 DF | 均方 MS | F值 F-value | P值 P-value | 显著性 Significance |
|---|---|---|---|---|---|---|
| 模型Model | 2.100 | 9 | 0.230 | 84.450 | <0.000 1 | ** |
| A | 0.930 | 1 | 0.930 | 337.060 | <0.000 1 | ** |
| B | 0.350 | 1 | 0.350 | 127.670 | <0.000 1 | ** |
| C | 0.590 | 1 | 0.590 | 212.620 | <0.000 1 | ** |
| AB | 0.064 | 1 | 0.064 | 23.070 | 0.002 0 | ** |
| AC | 0.068 | 1 | 0.068 | 24.540 | 0.001 6 | ** |
| BC | 0.018 | 1 | 0.018 | 6.630 | 0.036 8 | * |
| A2 | 0.003 | 1 | 0.003 | 1.140 | 0.320 4 | |
| B2 | 0.038 | 1 | 0.038 | 13.760 | 0.007 6 | ** |
| C2 | 0.031 | 1 | 0.031 | 11.150 | 0.012 4 | * |
| 残差Residual | 0.019 | 7 | 0.003 | |||
| 失拟Lack of fit | 0.012 | 3 | 0.004 | 2.040 | 0.251 5 | |
| 纯误差Pure error | 0.007 | 4 | 0.002 | |||
| 合计Total | 2.111 | 16 |
决定系数=99.09%,校正决定系数=97.91%,*表示显著(P<0.05),**表示极显著(P<0.01)。 | |
R2=99.09%, =97.91%, * indicates significant (P<0.05), ** indicates extremely significant (P<0.01). |
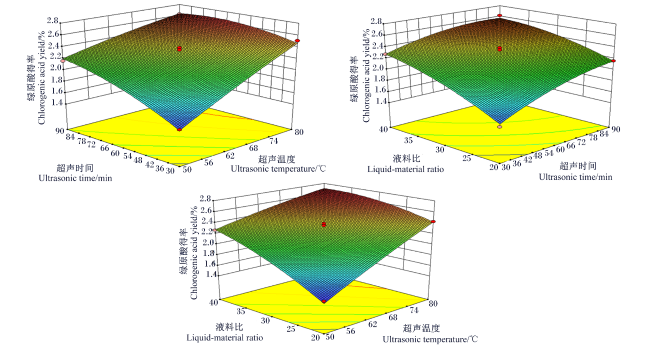
2.4 提取条件的交互作用对绿原酸得率的影响
2.5 体外抗氧化试验结果
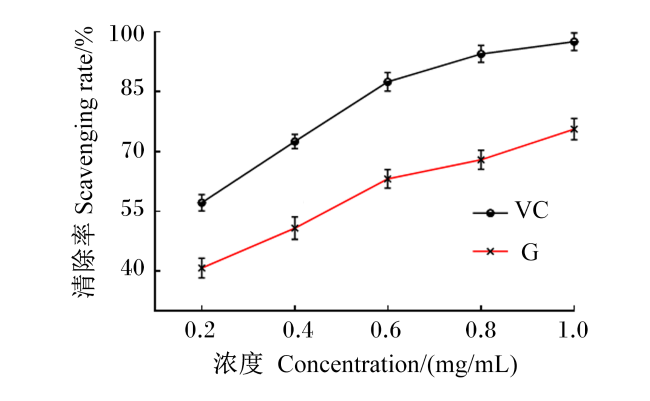
2.5.1 DPPH自由基清除能力
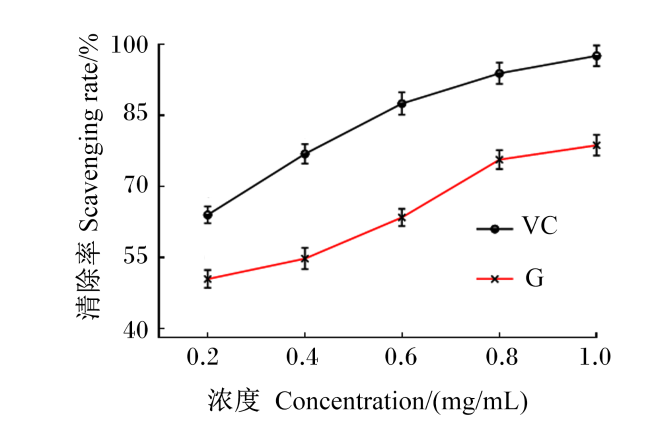
2.5.2 羟自由基清除能力


2.6 体外抑菌试验
表7 公英散水提物对3种奶牛乳房炎临床致病菌的MIC和MBCTable 7 MIC and MBC of aqueous extract of Gongying powder against three clinical pathogenic bacteria of dairy cow mastitismg/mL |
| 菌株Strains | 最低抑菌浓度MIC | 最低杀菌浓度MBC |
|---|---|---|
| 金黄色葡萄球菌S. aureus | 2.25 | 4.50 |
| 大肠杆菌E. coli | 9.00 | 18.00 |
| 无乳链球菌S. agalactiae | 4.50 | 9.00 |
表8 不同药物对3种奶牛乳房炎临床致病菌的抑菌圈直径Table 8 Diameter of antibacterial zone of different drugs against three clinical pathogenic bacteria of dairy cow mastitis |
| 项目 Items | 抑菌圈直径Diameter of antibacterial zone/mm | ||
|---|---|---|---|
| 金黄色葡萄球菌 S. aureus | 大肠杆菌 E. coli | 无乳链球菌 S. agalactiae | |
| 青霉素Penicillin | 33.08±0.18 | - | 37.05±0.18 |
| 头孢氨苄Cephalexin | 25.07±0.15 | 23.06±0.21 | 31.02±0.17 |
| 庆大霉素Gentamicin | / | 24.05±0.29 | / |
| 万古霉素Vancomycin | 17.01±0.16 | / | 25.06±0.18 |
| G1(144.00 mg/mL) | 22.04±0.20 | 15.07±0.19 | 18.11±0.59 |
| G2(72.00 mg/mL) | 15.15±0.59 | 8.34±0.52 | 11.13±0.20 |
| G3(36.00 mg/mL) | 11.22±0.54 | - | 7.02±0.26 |
| G4(18.00 mg/mL) | 8.06±0.20 | - | - |
-表示无抑菌圈,/表示没有进行该次试验,G1~G4分别代表高、中、低和较低浓度的公英散水提物。 | |
- indicates no bacteriostatic ring, / indicates the test has not been carried out, and G1 to G4 represent the high, medium, low and lower concentrations of the aqueous extract of Gongying powder, respectively. |