

1 材料与方法
1.1 试验材料
1.2 试验动物、试验饲粮及饲养管理
表1 试验饲粮组成及营养水平(风干基础)Table 1 Composition and nutrient levels of experimental diets (air-dry basis) % |
| 项目 Items | 常规蛋 白质饲粮 Normal- protein diet | 低蛋白 质饲粮 Low- protein diet |
|---|---|---|
| 原料Ingredients | ||
| 玉米Corn | 73.00 | 76.00 |
| 豆粕Soybean meal | 18.00 | 10.00 |
| 麦麸Wheat bran | 5.00 | 10.00 |
| 石粉Limestone | 1.00 | 1.05 |
| 磷酸氢钙CaHPO4 | 0.80 | 0.80 |
| 氯化钠NaCl | 0.40 | 0.40 |
| L-赖氨酸盐酸盐L-Lys·HCl | 0.27 | |
| DL-蛋氨酸DL-Met | 0.04 | |
| L-苏氨酸L-Thr | 0.11 | |
| L-色氨酸L-Trp | 0.03 | |
| 沸石粉Zeolite powder | 0.80 | 0.30 |
| 预混料Premix1) | 1.00 | 1.00 |
| 合计Total | 100.00 | 100.00 |
| 营养水平Nutrient levels2) | ||
| 净能NE/(MJ/kg) | 10.47 | 10.55 |
| 干物质DM | 88.47 | 88.11 |
| 粗蛋白质CP | 14.27 | 12.35 |
| 粗纤维CF | 3.23 | 3.32 |
| 淀粉Starch | 46.12 | 48.92 |
| 钙Ca | 0.65 | 0.62 |
| 总磷TP | 0.48 | 0.47 |
| 赖氨酸Lys | 0.84 | 0.81 |
| 蛋氨酸Met | 0.24 | 0.24 |
| 苏氨酸Thr | 0.51 | 0.55 |
| 色氨酸Trp | 0.14 | 0.14 |
1)预混料为每千克饲粮提供The premix provides the following per kilogram of diets:VD3 950 IU,VA 4 500 IU,VK3 0.5 mg,VE 12 mg,VB1 1.5 mg,VB2 2 mg,VB6 1.0 mg,VB12 0.004 mg,泛酸 pantothenic acid 3 mg,烟酸 nicotinic acid 4.8 mg,生物素 biotin 0.5 mg,Fe (as ferrous sulfate) 100 mg,Mn (as manganese sulfate) 20 mg,Cu (as copper sulfate) 6 mg,Zn (as zinc sulfate) 80 mg,Se (as sodium selenite) 0.3 mg,I (as potassium iodide) 0.5 mg。 | |
2)净能、粗纤维和淀粉为参照GB/T 39235—2020所得计算值,干物质、粗蛋白质、钙、总磷和氨基酸为实测值。NE, CF and starch are calculated values according to GB/T 39235—2020, while DM, CP, Ca, TP and amino acids are measured values. |
1.3 饲粮营养成分测定
1.4 生长性能测定
1.5 粪便样品采集及指标测定
1.5.1 粪便样品采集
1.5.2 粪便菌群分析
1.5.3 粪便非靶向代谢组学分析
1.5.4 粪便中吲哚、粪臭素、氨氮和SCFAs含量测定
1.6 数据处理与分析
2 结果与分析
2.1 育肥猪的生长性能
表2 育肥猪的生长性能Table 2 Growth performance of finishing pigs |
| 项目 Items | 对照组 Control group | 试验Ⅰ组 Experimental group Ⅰ | 试验Ⅱ组 Experimental group Ⅱ |
|---|---|---|---|
| 始重Initial weight/kg | 81.07±1.14 | 80.07±0.67 | 80.53±0.68 |
| 末重Final weight/kg | 120.40±1.10 | 119.17±1.20 | 121.63±1.21 |
| 平均日增重ADG/g | 936.51±10.13a | 930.95±26.55a | 978.57±21.44b |
| 平均日采食量ADFI/kg | 2.98±0.02 | 2.98±0.02 | 2.86±0.02 |
| 料重比F/G | 3.19±0.04a | 3.21±0.09a | 2.92±0.06b |
同行数据肩标不同小写字母表示差异显著(P<0.05),肩标无字母或相同小写字母表示差异不显著(P>0.05)。下表(表5除外)同。 | |
In the same row, values with different small letter superscripts mean significant difference (P<0.05), while with no letter or the same small letter superscripts mean no significant difference (P>0.05). The same as below (except Table 5). |
2.2 育肥猪的粪便菌群多样性和组成
2.2.1 粪便菌群alpha多样性和beta多样性
表3 育肥猪的粪便菌群alpha多样性指数Table 3 Alpha diversity indexes of fecal microbiota of finishing pigs |
| 项目 Items | 对照组 Control group | 试验Ⅰ组 Experimental group Ⅰ | 试验Ⅱ组 Experimental group Ⅱ |
|---|---|---|---|
| Sobs指数Sobs index | 678.00±20.68 | 679.00±23.37 | 713.50±36.74 |
| Shannon指数Shannon index | 3.49±0.14 | 3.34±0.09 | 3.67±0.19 |
| Simpson指数Simpson index | 0.10±0.01 | 0.12±0.01 | 0.10±0.02 |
| ACE指数ACE index | 825.15±28.56 | 828.00±29.50 | 839.29±40.24 |
| Chao1指数Chao1 index | 830.20±21.72 | 838.30±34.91 | 853.09±40.21 |
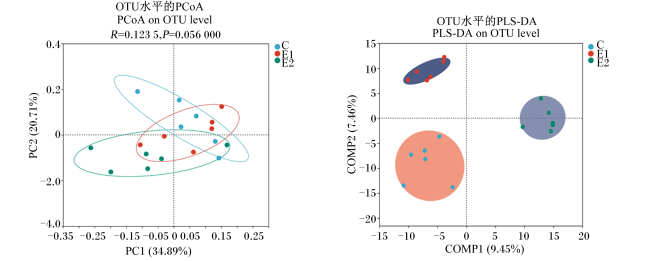
图1 育肥猪的粪便菌群beta多样性(OTU水平的PCoA和PLS-DA)C为对照组,E1为试验Ⅰ组,E2为试验Ⅱ组。下图同。PC1为第1主成分,PC2为第2主成分;COMP1为第1主成分解释度,COMP2为第2主成分解释度。 Fig.1 Beta diversity (PCoA and PLS-DA on OTU level) of fecal microbiota of finishing pigs C is control group, E1 is experimental group Ⅰ, and E2 is experimental group Ⅱ. The same as below. PC1 is the first principal component, and PC2 is the second principal component; COMP1 is the first principal component interpretability, and COMP2 is the second principal component interpretability. |
2.2.2 粪便菌群组成
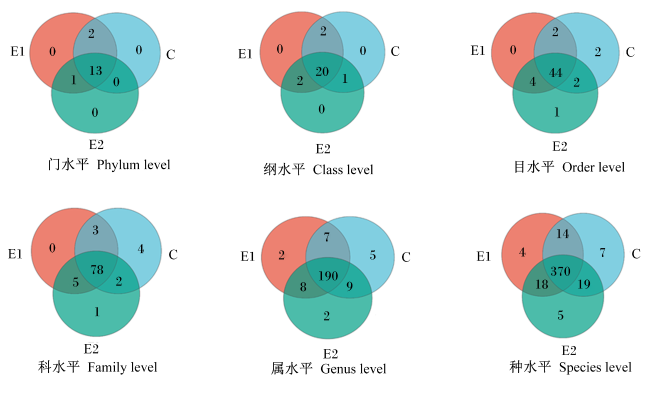
图2 粪便菌群门水平至种水平维恩图Fig.2 Venn diagrams of fecal microbiota at phylum level to species level |
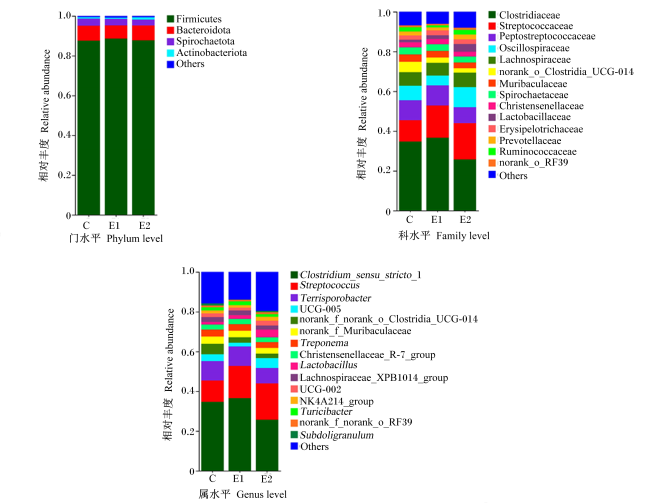
图3 育肥猪粪便中优势菌群分布Firmicutes:厚壁菌门;Bacteroidota:拟杆菌门;Spirochaetota:螺旋体门;Actinobacteriota:放线菌门;Others:其他;Clostridiaceae:梭菌科;Streptococcaceae:链球菌科;Peptostreptococcaceae:消化链球菌科;Oscillospiraceae:颤螺菌科;Lachnospiraceae:毛螺菌科; Spirochaetaceae:螺旋体科;Christensenellaceae:克里斯滕森菌科;Lactobacillaceae:乳杆菌科;Erysipelotrichaceae:丹毒丝菌科;Prevotellaceae:普雷沃氏菌科;Ruminococcaceae:瘤胃球菌科;Clostridium_sensu_stricto_1:狭义梭菌属1;Streptococcus:链球菌属;Treponema:密螺旋体属;Christensenellaceae_R-7_group:克里斯滕森菌科R-7群;Lactobacillus:乳杆菌属;Lachnospiraceae_XPB1014_group:毛螺菌科XPB1014群;NK4A214_group:NK4A214群。 Fig.3 Distribution of dominant microbiota in feces of finishing pigs |
2.2.3 粪便菌群差异分析
表4 育肥猪的粪便菌群差异Table 4 Difference of fecal microbiota of finishing pigs % |
| 项目 Items | 对照组 Control group | 试验Ⅰ组 Experimental group Ⅰ | 试验Ⅱ组 Experimental group Ⅱ |
|---|---|---|---|
| 目水平Order level | |||
| 颤螺菌目Oscillospirales | 11.22±2.51a | 7.08±0.52b | 14.24±1.80a |
| 毛螺菌目Lachnospirales | 6.79±0.97b | 6.38±0.15c | 7.29±0.15a |
| 乳杆菌目Lactobacillales | 12.06±2.13c | 18.18±3.40b | 22.14±3.24a |
| 科水平Family level | |||
| 颤螺菌科Oscillospiraceae | 7.32±1.90ab | 4.94±0.33b | 10.10±1.54a |
| 毛螺菌科Lachnospiraceae | 6.79±0.97b | 6.38±0.15c | 7.29±0.15a |
| 瘤胃球菌科Ruminococcaceae | 2.08±1.08a | 0.97±0.14b | 2.33±0.46a |
| 属水平Genus level | |||
| UCG-005 | 3.43±1.09a | 1.91±0.35b | 4.99±0.92a |
| 粪杆菌属Faecalibacterium | 0.18±0.11a | 0.02±0.01b | 0.14±0.03a |
| 解纤维素菌属Cellulosilyticum | 0.09±0.01b | 0.15±0.02a | 0.10±0.02b |
| 小杆菌属Dialister | 0.06±0.03a | 0.01±0.01b | 0.06±0.01a |
| 福涅氏菌属Fournierella | 0.03±0.02a | 0.01±0.00b | 0.02±0.00a |
2.3 育肥猪的粪便非靶向代谢组特征
表5 育肥猪粪便中鉴定出的代谢物数目Table 5 Number of metabolites identified in feces of finishing pigs 种 |
| 离子模式 Ion modes | 质谱峰数目 Mass spectrum peak number | 粪便中鉴定出的代谢物数目 Number of metabolites identified in feces | 注释到KEGG数据库的代谢物个数 Number of metabolites annotated to the KEGG database |
|---|---|---|---|
| 正Positive | 3 431 | 660 | 174 |
| 负Negative | 3 204 | 394 | 134 |
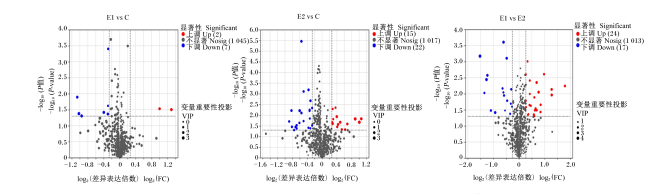
图4 差异代谢物火山图横坐标为代谢物在2组间差异表达倍数(FC)变化值,即log2(FC);纵坐标为代谢物表达量变化差异的统计学检验P值,即-log10(P-value)。图中每个点代表1个特定的代谢物,点的大小表示变量重要性投影(VIP)值,蓝色为表达下调的代谢物,红色为表达上调的代谢物,灰色为表达无显著变化的代谢物。 Fig.4 Volcanic map of differential metabolites The abscissa is the fold change (FC) change value of metabolites between the two groups, that is log2(FC); the ordinate is the statistical test P-value of the difference in metabolite expression, namely -log10(P-value). Each point in the figure represents a specific metabolite, and the size of the point indicates the variable importance in projection (VIP) value. Blue is the metabolite whose expression is down-regulated, and red is the metabolite whose expression is up-regulated, and gray is the metabolite whose expression does not change significantly. |
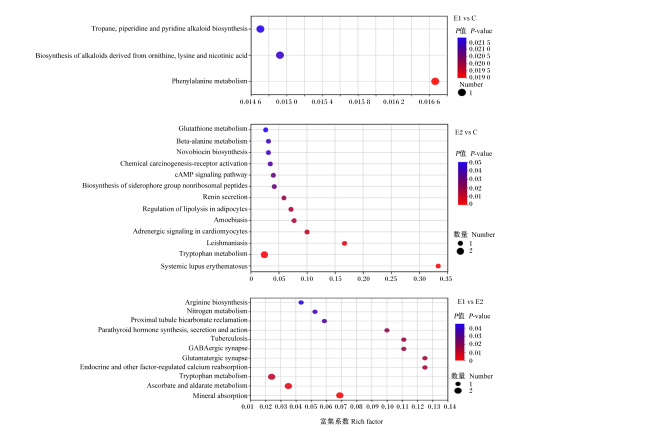


图5 KEGG富集通路分析横坐标为富集系数;纵坐标为KEGG通路。图中气泡的大小代表该通路中富集到代谢集中的化合物的数量,气泡的颜色表示不同富集显著性P值的大小。 Tropane, piperidine and pyridine alkaloid biosynthesis:托烷、哌啶和吡啶生物碱的生物合成;Biosynthesis of alkaloids derived from ornithine, lysine and nicotinic acid:鸟氨酸、赖氨酸和烟酸生物碱的生物合成;Phenylalanine metabolism:苯丙氨酸代谢;Glutathione metabolism:谷胱甘肽代谢;Beta-alanine metabolism:β-丙氨酸代谢;Novobiocin biosynthesis:新生霉素生物合成;Chemical carcinogenesis-receptor activation:化学致癌-受体活化;cAMP signaling pathway:cAMP信号通路;Biosynthesis of siderophore group nonribosomal peptides:铁载体类非核糖体肽的生物合成;Renin secretion:肾素分泌;Regulation of lipolysis in adipocytes:脂肪细胞脂解的调节;Amoebiasis:阿米巴病;Adrenergic signaling in cardiomyocytes:心肌细胞中的肾上腺素能信号传导;Leishmaniasis:利什曼病;Tryptophan metabolism:色氨酸代谢;Systemic lupus erythematosus:系统性红斑狼疮;Arginine biosynthesis:精氨酸生物合成;Nitrogen metabolism:氮代谢;Proximal tubule bicarbonate reclamation:近端小管碳酸氢盐回收;Parathyroid hormone synthesis, secretion and action:甲状旁腺激素的合成、分泌和作用;Tuberculosis:肺结核;GABAergic synapse:GABA能突触;Glutamatergic synapse:谷氨酸能突触;Endocrine and other factor-regulated calcium reabsorption:内分泌和其他因素调节钙的再吸收;Tryptophan metabolism:色氨酸代谢;Ascorbate and aldarate metabolism:抗坏血酸和醛酸代谢;Mineral absorption:矿物吸收。 Fig.5 KEGG enrichment pathway analysis The abscissa is rich factor; the ordinate is the KEGG pathway. The size of the bubbles in the figure represents the amount of compound enriched to the metabolic concentration in this pathway, and the color of the bubbles represents the size of different enrichment significance P-value. |
表6 粪便样品中的关键差异代谢物Table 6 Key differential metabolites in fecal samples |
| 代谢物名称 Metabolite names | 代谢物ID Metabolite ID | 离子模式 Ion mode | KEGG通路ID KEGG pathway ID | 对照组 Control group | 试验Ⅰ组 Experimental group Ⅰ | 试验Ⅱ组 Experimental group Ⅱ |
|---|---|---|---|---|---|---|
| N-乙酰-L-苯丙氨酸 N-acetyl-L-phenylalanine | metab_8136 | 负 | map01100;map00360 | 1.28±0.19a | 0.61±0.11b | 1.56±0.27a |
| 肾上腺素 Epinephrine | metab_457 | 正 | map01100;map05207; map04261;map04923; map04024 | 2.61±0.09a | 2.54±0.10a | 2.16±0.08b |
| 5-羟基吲哚乙酸 5-hydroxyindoleacetic acid | metab_3883 | 正 | map01100;map04726; map00380 | 3.35±0.33b | 3.15±0.24b | 4.41±0.11a |
| L-谷氨酰胺 L-glutamine | metab_8595 | 负 | map04964;map04727; map04724;map01100; map00220;map04978; map00910 | 0.99±0.12ab | 0.83±0.12b | 1.27±0.06a |
| D-葡萄糖醛酸 D-glucuronic acid | metab_8759 | 负 | map01100;map00053 | 2.61±0.43ab | 1.76±0.66b | 3.37±0.13a |
2.4 育肥猪粪便中短链脂肪酸、吲哚、粪臭素和氨氮含量
表7 育肥猪粪便中SCFAs含量Table 7 Contents of SCFAs in feces of finishing pigs mg/kg |
| 项目 Items | 对照组 Control group | 试验Ⅰ组 Experimental group Ⅰ | 试验Ⅱ组 Experimental group Ⅱ |
|---|---|---|---|
| 乙酸Acetic acid | 6 686.05±212.66a | 6 154.48±370.06a | 5 325.21±78.28b |
| 丙酸Propionic acid | 3 615.83±1.47a | 3 132.75±237.75b | 2 919.87±26.68b |
| 丁酸Butyric acid | 1 979.99±179.41ab | 1 688.36±119.20b | 2 022.43±104.41a |
| 戊酸Valeric acid | 427.83±22.11a | 348.28±11.91b | 320.69±0.22b |
| 异丁酸Isobutyric acid | 408.37±20.63a | 332.01±22.01b | 294.49±7.30b |
| 异戊酸Isovaleric acid | 681.50±61.20a | 588.75±27.27ab | 475.38±9.77b |
| 总支链脂肪酸Total BCFAs | 1 089.87±81.82a | 920.76±49.22b | 769.86±16.56b |
| 总短链脂肪酸Total SCFAs | 13 799.59±355.50a | 12 244.64±781.49b | 11 358.07±146.50b |
表8 育肥猪粪便中吲哚、粪臭素、氨氮含量Table 8 Contents of indole, skatole and ammonia nitrogen in feces of finishing pigs mg/kg |
| 项目 Items | 对照组 Control group | 试验Ⅰ组 Experimental group Ⅰ | 试验Ⅱ组 Experimental group Ⅱ |
|---|---|---|---|
| 吲哚Indole | 10.20±0.70 | 8.37±0.91 | 9.37±0.31 |
| 粪臭素Skatole | 19.97±1.05a | 15.35±0.79b | 14.33±0.88b |
| 氨氮Ammonia nitrogen | 918.24±26.56a | 762.67±15.32b | 705.89±16.78b |