

1 材料与方法
1.1 微贮饲料的制备
表1 脐橙渣、甜叶菊渣和稻草的营养成分Table 1 Nutrient composition of navel orange residue, stevia residue and rice straw % |
| 项目 Items | 含量Content | ||
|---|---|---|---|
| 脐橙渣Navel orange residue | 甜叶菊渣Stevia residue | 稻草Rice straw | |
| 干物质DM | 30 | 35 | 88 |
| 粗脂肪EE | 0.71 | 4.75 | 1.44 |
| 粗蛋白质CP | 7.00 | 13.31 | 5.53 |
| 粗灰分Ash | 2.96 | 8.64 | 11.31 |
| 水溶性碳水化合物WSC | 48.05 | 0.65 | 8.99 |
| 中性洗涤纤维NDF | 12.12 | 60.54 | 59.51 |
| 酸性洗涤纤维ADF | 11.72 | 43.89 | 39.10 |
干物质含量以鲜样为基础,其余指标以干物质为基础。 | |
DM content was based on the fresh sample, and the other indexes were based on DM. |
1.2 试验设计和饲养管理
表2 试验饲粮组成及营养水平(风干基础)Table 2 Composition and nutrient levels of experimental diets (air-dry basis) % |
| 项目 Items | 含量Content | |||
|---|---|---|---|---|
| 对照组 Control group | 试验Ⅰ组 Experiment group Ⅰ | 试验Ⅱ组 Experiment group Ⅱ | 试验Ⅲ组 Experiment group Ⅲ | |
| 原料Ingredients | ||||
| 微贮稻草Microbial silage rice straw | 30.0 | 6.0 | 6.0 | 6.0 |
| 微贮脐橙渣 Microbial silage navel orange residue | 24.0 | 12.0 | ||
| 微贮甜叶菊渣 Microbial silage stevia residue | 24.0 | 12.0 | ||
| 豆渣Soybean residue | 20.0 | 20.0 | 20.0 | 20.0 |
| 麦秆Wheat straw | 6.0 | 6.0 | 6.0 | 6.0 |
| 麦壳Wheat hulls | 4.7 | 5.8 | 5.5 | 5.4 |
| 玉米Corn | 26.2 | 26.2 | 26.2 | 26.2 |
| 豆粕Soybean meal | 7.5 | 6.4 | 6.7 | 6.8 |
| 麦麸Wheat bran | 3.0 | 3.0 | 3.0 | 3.0 |
| 预混料Premix1) | 1.6 | 1.6 | 1.6 | 1.6 |
| 小苏打NaHCO3 | 1.0 | 1.0 | 1.0 | 1.0 |
| 合计Total | 100.0 | 100.0 | 100.0 | 100.0 |
| 营养水平Nutrient levels2) | ||||
| 总能GE/(MJ/kg) | 15.32 | 15.08 | 14.91 | 14.97 |
| 粗脂肪EE | 2.13 | 2.81 | 2.03 | 2.37 |
| 粗蛋白质CP | 12.28 | 13.34 | 12.55 | 13.01 |
| 中性洗涤纤维NDF | 36.65 | 37.47 | 31.69 | 33.45 |
| 酸性洗涤纤维ADF | 24.48 | 25.84 | 20.83 | 22.91 |
| 钙Ca | 0.42 | 0.37 | 0.34 | 0.37 |
| 磷P | 0.25 | 0.22 | 0.21 | 0.22 |
1)预混料为每千克饲粮提供 Premix provided the following per kg of diets:VA 3 300 IU,VD 880 IU,VE 60 mg,Cu 10 mg,Fe 50 mg,Mn 20 mg,I 0.5 mg,Se 0.1 mg,Co 0.1 mg。 | |
2)总能为计算值,其余均为实测值。GE was a calculated value, while the others were measured values. |
1.3 样品采集和指标测定
1.3.1 饲粮营养水平
1.3.2 生长性能
1.3.3 血浆生化指标检测
1.3.4 粪便微生物多样性
1.4 数据统计与分析
2 结果与分析
2.1 不同微贮饲料对肉牛生长性能的影响
表3 不同微贮饲料对肉牛生长性能的影响Table 3 Effects of different microbial silage feed on growth performance of beef cattle |
| 项目 Items | 对照组 Control group | 试验Ⅰ组 Experiment group Ⅰ | 试验Ⅱ组 Experiment group Ⅱ | 试验Ⅲ组 Experiment group Ⅲ |
|---|---|---|---|---|
| 初重IBW/kg | 617.25±32.35 | 648.56±56.81 | 607.33±60.96 | 614.00±76.75 |
| 末重FBW/kg | 716.50±38.15 | 773.50±60.75 | 709.28±59.90 | 741.63±88.13 |
| 平均日增重ADG/kg | 1.27±0.08b | 1.60±0.05a | 1.31±0.04b | 1.64±0.15a |
| 平均日采食量ADFI/kg | 8.75±0.20 | 9.01±0.14 | 8.51±0.37 | 9.19±0.10 |
| 料重比F/G | 6.91±0.29a | 5.71±0.23b | 6.51±0.10a | 5.49±0.26b |
同行数据肩标无字母或相同字母表示差异不显著(P>0.05),肩标不同字母表示差异显著(P<0.05)。下表同。 | |
In the same row, values with no letter or the same letter superscripts mean no significant difference (P>0.05), while with different letter superscripts mean significant difference (P<0.05). The same as below. |
2.2 不同微贮饲料对肉牛血浆生化指标的影响
表4 不同微贮饲料对肉牛血浆生化指标的影响Table 4 Effects of different microbial silage feed on blood biochemical indicators of beef cattle |
| 项目 Items | 对照组 Control group | 试验Ⅰ组 Experiment group Ⅰ | 试验Ⅱ组 Experiment group Ⅱ | 试验Ⅲ组 Experiment group Ⅲ |
|---|---|---|---|---|
| 谷草转氨酶AST/(ng/L) | 341.10±31.71 | 348.99±3.03 | 346.91±0.29 | 321.05±35.71 |
| 谷丙转氨酶ALT/(ng/L) | 209.01±1.43 | 167.56±23.29 | 199.95±15.41 | 210.89±10.48 |
| 谷草转氨酶/谷丙转氨酶 AST/ALT | 1.74±0.03ab | 1.86±0.03a | 1.51±0.10b | 1.45±0.16b |
| 肌酐CRE/(μmol/L) | 99.72±19.62 | 87.24±3.07 | 90.58±4.89 | 88.08±13.83 |
| 尿素氮UN/(μmol/L) | 1 692.48±122.01a | 1 778.65±173.32a | 1 859.42±23.81a | 1 087.66±31.02b |
| 尿酸UA/(μmol/L) | 39.10±5.78 | 36.49±1.88 | 41.72±0.85 | 35.73±1.24 |
| 丙酮酸激酶PK/(ng/L) | 607.69±3.78a | 592.48±12.18a | 549.51±11.85ab | 476.56±37.41b |
| 谷氨酸Glu/(μmol/L) | 16.35±0.14d | 33.13±0.41a | 26.89±0.38c | 31.29±0.38b |
| 磷酸果糖激酶PFK/(ng/L) | 503.28±3.45b | 604.56±32.86b | 618.71±17.97b | 698.93±77.51a |
| 葡萄糖-6-磷酸脱氢 G6PDH/(ng/L) | 404.56±44.43bc | 585.61±17.59a | 444.61±5.38b | 588.32±4.88a |
2.3 不同微贮饲料对肉牛粪便微生物多样性的影响
2.3.1 肉牛粪便微生物门水平结构分析
表5 肉牛粪便微生物优势细菌门水平的相对丰度Table 5 Relative abundance of dominant bacteria in feces of beef cattle at phylum level % |
| 项目 Items | 对照组 Control group | 试验Ⅰ组 Experiment group Ⅰ | 试验Ⅱ组 Experiment group Ⅱ | 试验Ⅲ组 Experiment group Ⅲ |
|---|---|---|---|---|
| 厚壁菌门Firmicutes | 60.39±0.16a | 63.25±0.09a | 66.05±1.24a | 47.54±5.09b |
| 拟杆菌门Bacteroidota | 36.88±0.19a | 28.43±0.71b | 25.62±0.23c | 28.51±0.20b |
| 变形菌门Proteobacteria | 0.24±0.02b | 4.06±0.72b | 5.62±1.28b | 20.60±5.13a |
| 螺旋体门Spirochaetota | 1.37±0.10b | 3.01±0.20a | 0.79±0.11c | 1.04±0.10bc |
2.3.2 属水平肉牛粪便微生物结构分析
表6 肉牛粪便微生物优势细菌属水平的相对丰度Table 6 Relative abundance of dominant bacteria in feces of beef cattle at genus level % |
| 项目 Items | 对照组 Control group | 试验Ⅰ组 Experiment group Ⅰ | 试验Ⅱ组 Experiment group Ⅱ | 试验Ⅲ组 Experiment group Ⅲ |
|---|---|---|---|---|
| UCG-005 | 11.76±0.30b | 14.06±0.23a | 14.19±0.44a | 8.78±0.82c |
| 理研菌科RC9肠道群 Rikenellaceae_RC9_gut_group | 11.32±0.09a | 8.83±0.20b | 5.01±0.10d | 7.61±0.77c |
| UCG-010 | 8.59±0.20a | 5.09±0.07b | 4.39±0.21c | 3.79±0.87c |
| 不动菌属Acinetobacter | 0.00±0.00c | 2.91±0.51b | 2.65±1.08b | 14.44±4.05a |
| 另枝菌属Alistipes | 4.57±0.12b | 2.45±0.05c | 6.58±0.26a | 2.02±0.13d |
2.3.3 肉牛粪便微生物Alpha多样性分析
表7 不同微贮饲料对肉牛粪便微生物Alpha多样性指数的影响Table 7 Effects of different microbial silage on fecal microbial Alpha diversity indexes of beef cattle |
| 项目 Items | 对照组 Control group | 试验Ⅰ组 Experiment group Ⅰ | 试验Ⅱ组 Experiment group Ⅱ | 试验Ⅲ组 Experiment group Ⅲ |
|---|---|---|---|---|
| 覆盖度指数Coverage index | 0.999 4±0.000 2 | 0.999 6±0.000 2 | 0.999 1±0.000 2 | 0.999 2±0.000 4 |
| Faith_pd指数Faith_pd index | 227.38±1.68c | 250.55±5.28b | 228.53±6.32c | 274.67±8.66a |
| ACE指数ACE index | 3 339.33±46.68a | 3 374.86±56.45a | 3 153.96±56.73b | 3 557.53±197.84a |
| Chao1指数Chao1 index | 3 333.61±47.78a | 3 369.49±53.43a | 3 144.80±57.38b | 3 548.52±194.82a |
| Shannon指数Shannon index | 10.010±0.035a | 9.919±0.002a | 9.592±0.103b | 9.604±0.271b |
| Simpson指数Simpson index | 0.997±0.000a | 0.996±0.000a | 0.994±0.001ab | 0.989±0.004b |
2.3.4 肉牛粪便微生物Beta多样性分析
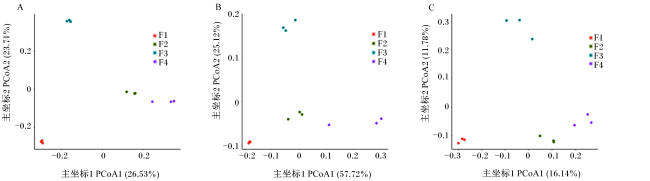
图1 粪便微生物Bray-curtis距离(A)、Weighted-Unifrac距离(B)和Unweighted-Unifrac距离(C)PCoA结果图中圆点分别表示各个样品,不同颜色表示样品属于不同的分组。 F1、F2、F3、F4分别表示对照组、试验Ⅰ组、试验Ⅱ组、试验Ⅲ组。图2同。 Fig.1 PCoA results of Bray-curtis distance (A), Weighted-Unifrac distance (B) and Unweighted-Unifrac distance (C) of fecal microorganisms The dots in the figure indicated the samples, and different colors indicated that the samples belong to different groups F1, F2, F3 and F4 indicated the control group, experiment group Ⅰ, experiment group Ⅱ, and experiment group Ⅲ, respectively. The same as Fig.2. |
2.4 肉牛粪便微生物基因功能预测分析
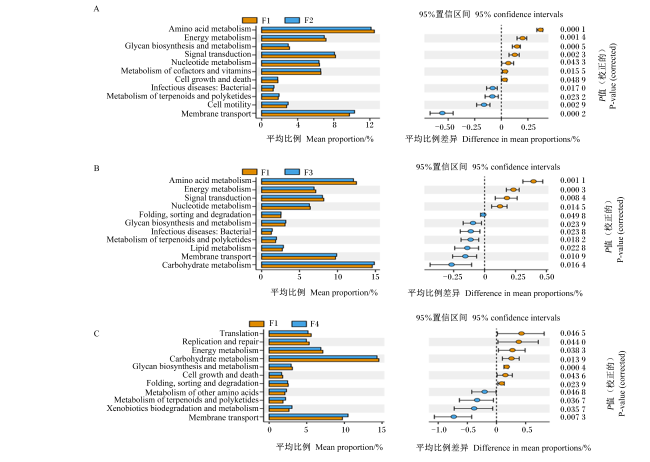


图2 各组肉牛粪便的差异微生物功能预测Amino acid metabolism:氨基酸代谢;Energy metabolism:能量代谢;Glycan biosynthesis and metabolism:聚糖的生物合成和代谢;Signal transduction:信号转导;Nucleotide metabolism:核苷酸代谢;Metabolism of cofactors and vitamins:辅助因子和维生素的代谢;Cell growth and death:细胞生长与死亡;Infectious diseases: Bacterial:传染病:细菌性;Metabolism of terpenoids and polyketides:萜类和多酮类的代谢;Cell motility:细胞活性;Membrane transport:膜运输;Folding, sorting and degradation:折叠、分类和降解;Lipid metabolism:脂质代谢;Carbohydrate metabolism:碳水化合物代谢;Translation:翻译;Replication and repair:复制和修复;Metabolism of other amino acids:其他氨基酸的代谢;Xenobiotics biodegradation and metabolism:异种生物降解和代谢。 图为第2层级下KEGG代谢途径的差异分析,图中不同颜色代表不同的分组。图片中左图所示为不同功能在2组样品中的相对丰度比例,中间所示为95%置信区间内功能相对丰度的差异比例。 Fig.2 Prediction of differential bacterial function in the feces of beef cattle in different groups The figure presents the differential analysis of KEGG pathways at the second level, where different groups are represented by different colors. The left image displays the abundance ratio of different functions in two groups of samples, while the middle image shows the difference ratio of functional abundance within the 95% confidence interval. |