

“精准营养”是畜牧业未来的发展趋势,推广“精准营养”技术可降低饲料成本,减轻养殖环保压力,提升畜产品品质,推动畜牧业、饲料工业绿色可持续发展[1]。而不同来源和品种的原料其有效能存在差异[2-3],因此要实现“精准营养”首先要准确测定各类原料的有效养分含量,实现精准配方。动物代谢试验是研究中最常用的手段,然而动物代谢试验周期长、费时费力,不能实现“先测后配”,因此有必要探索并建立快速、经济的饲料原料有效能值评定方法[4-5]。目前,常见快速预测饲料原料有效能值的方法有:基于化学成分的预测模型[6]、近红外光谱法(near infrared spectrometry, NIRS)[7]、体外酶解法等[8]。化学成分法常用的预测因子有总能(GE)、粗蛋白质(CP)、粗脂肪(EE)、粗纤维(CF)、酸性洗涤纤维(ADF)和中性洗涤纤维(NDF)等,但预测因子为绝对的养分含量而非可消化的养分含量,因此加工方式和抗营养因子对能量利用的影响未考虑在内[4]。NIRS是一种绿色、非破坏性的快速预测方法,但建立NRIS预测模型成本昂贵且需要准确持续的校准,预测质量依赖于校正值的准确性和重复性,使用时还需考虑饲料的颗粒密度等物理因素[9]。体外酶解法包括一步酶解、两步酶解和三步酶解,即分别模拟胃、胃-小肠和胃-小肠-大肠的消化,早期体外酶解多以三角瓶作为消化反应容器,并人工加酶,易造成系统误差,同时整个消化过程在三角瓶中发生,与动物消化吸收生理过程不符,消化产物可能会对酶活性产生抑制作用[10]。单胃动物仿生消化系统(simulated digestion system, SDS)由电脑程控系统模拟饲粮在单胃动物体内的消化过程,避免了三角瓶法测值的弊端,所测饲料原料生物学效价与动物试验法有较强的相关性,可用于快速评定饲料原料的养分效价[11⇓-13]。因此,本研究利用SDS测定玉米、高粱原料的酶水解物能值(enzymatic hydrolysate gross energy, EHGE),并结合前期测定的鸡玉米、高粱的表观代谢能(AME)和真代谢能(TME)建立基于EHGE的AME和TME预测模型,以期丰富快速评定玉米、高粱有效能的方法。
1 材料与方法
1.1 试验原料
本试验所用原料由四川某食品有限责任公司和天津某生物科技有限公司提供,包括5种玉米和5种高粱,采用四分法取样后用粉碎机粉碎并过60目筛,充分混合均匀,贮存于样品瓶中-20 ℃保存备用。原料来源及养分含量见表1。
表1 原料来源及养分含量Table 1 Source and nutrient contents of ingredients |
| 原料 Ingredients | 编号 No. | 产地 Source | 干物质 DM/% | 粗蛋 白质 CP/ % DM | 粗脂肪 EE/ % DM | 粗灰分 Ash/ % DM | 中性洗 涤纤维 NDF/ % DM | 酸性洗 涤纤维 ADF/ % DM | 总能 GE/ (MJ/kg DM) | 单宁 Tannins/ % DM |
|---|---|---|---|---|---|---|---|---|---|---|
| 玉米 Corn | 1 | 海南 | 87.91 | 11.17 | 4.49 | 1.68 | 14.39 | 3.12 | 18.75 | |
| 2 | 新疆 | 88.36 | 11.18 | 4.59 | 1.61 | 12.69 | 3.03 | 18.75 | ||
| 3 | 河北 | 87.84 | 8.77 | 4.35 | 1.21 | 11.86 | 2.94 | 18.62 | ||
| 4 | 宁夏 | 87.08 | 8.73 | 3.59 | 1.49 | 11.53 | 2.63 | 18.48 | ||
| 5 | 新疆 | 87.08 | 8.31 | 4.52 | 1.30 | 11.40 | 2.63 | 18.55 | ||
| 平均值Mean | 87.65 | 9.63 | 4.31 | 1.46 | 12.37 | 2.87 | 18.63 | |||
| 变异系数CV/% | 0.64 | 14.75 | 9.52 | 13.86 | 9.96 | 7.94 | 0.65 | |||
| 高粱 Sorghum | 1 | 美国 | 87.36 | 10.15 | 3.14 | 1.57 | 18.02 | 5.25 | 18.51 | 0.21 |
| 2 | 山西 | 87.03 | 9.24 | 2.41 | 1.77 | 20.79 | 9.79 | 18.67 | 3.53 | |
| 3 | 河北 | 88.03 | 10.37 | 3.82 | 1.99 | 17.33 | 8.01 | 18.64 | 1.36 | |
| 4 | 河北 | 87.65 | 10.92 | 3.38 | 2.01 | 20.74 | 7.90 | 18.77 | 2.78 | |
| 5 | 山西 | 88.76 | 10.67 | 3.97 | 1.57 | 14.36 | 4.38 | 18.27 | 0.18 | |
| 平均值Mean | 87.77 | 10.27 | 3.34 | 1.78 | 18.25 | 7.07 | 18.57 | 1.61 | ||
| 变异系数CV/% | 0.76 | 6.29 | 18.48 | 12.11 | 14.66 | 31.23 | 1.03 | 93.72 |
1.2 试验设计
试验采用单因素完全随机设计,分别测定上述5种来源的玉米原料和5种来源的高粱原料的体外干物质消化率(in vitro dry matter digestibility, IVDMD)、体外总能消化率(in vitro gross energy digestibility, IVGED)和EHGE,每个样品处理设置5个重复,每个重复1根体外仿生消化管进行体外仿生消化操作,比较不同来源对玉米和高粱原料的IVDMD、IVGED和EHGE的影响。
本试验参考使用的鸡AME和TME值为本实验室前期使用同批次原料的检测值[14],该动物试验使用的是25周龄健康体成熟的海兰褐公鸡,采用自由采食结合全收粪法测定所得。
1.3 测定指标及方法
1.3.1 常规指标测定方法
原料及仿生消化残渣的DM、CP、EE、Ash、NDF和ADF的含量分别参照GB/T 6435—2014、GB/T 6432—1994、GB/T 6433—2006、GB/T 6438—2007、GB/T 20806—2006和NY/T 1459—2007的方法进行测定,高粱原料单宁含量参照GB/T 27985—2011的方法进行测定,原料的GE使用Parr 6400全自动氧弹量热仪测定。
1.3.2 IVDMD、IVGEDH和EHGE测定方法
IVDMD(%)=[上样样品重量(kg DM)-
消化残渣重量(kg DM)]/
[上样样品重量(kg DM)×0.01];
消化残渣重量(kg DM)]/
[上样样品重量(kg DM)×0.01];
IVGED(%)=[上样样品GE(MJ)-
消化残渣GE(MJ)]/
[上样样品GE(MJ)×0.01];
消化残渣GE(MJ)]/
[上样样品GE(MJ)×0.01];
EHGE(MJ/kg DM)=[饲料GE(MJ)-
消化残渣GE(MJ)]/
上样样品重量(kg DM)。
消化残渣GE(MJ)]/
上样样品重量(kg DM)。
1.4 数据统计分析
使用SAS 9.4的MEANS模块对基本统计量进行分析,ANOVA模块对数据进行方差分析,以Duncan氏法进行多重比较,使用CORR模块进行回归分析,使用REG模块进行线性回归。以P<0.05为差异显著判断标准,以P<0.01为差异极显著判断标准,结果以平均值表示。
2 结果与分析
2.1 不同来源玉米的IVDMD、IVGED和EHGE
由表2可知,5种玉米IVDMD、IVGED和EHGE的平均值分别为74.41%、79.73%和14.78 MJ/kg DM,变异系数(CV)分别为0.68%、0.99%及1.56%。5种玉米的IVDMD、IVGED和EHGE均存在显著差异(P<0.05),其中1号玉米的IVDMD、IVGED和EHGE最低,分别为73.71%、78.92%和14.66 MJ/kg DM,2号玉米的IVDMD、IVGED和EHGE最高,分别为75.12%、80.89%和15.19 MJ/kg DM。
表2 不同来源玉米的IVDMD、IVGED和EHGE (干物质基础)Table 2 IVDMD, IVGED and EHGE of corn from different sources (DM basis) |
| 项目 Items | 体外干物质消化率 IVDMD/% | 体外总能消化率 IVGED/% | 酶水解物能值 EHGE/(MJ/kg DM) | 表观代谢能 AME/(MJ/kg) | 真代谢能 TME/(MJ/kg) |
|---|---|---|---|---|---|
| 编号No. | |||||
| 1 | 73.71b | 78.92c | 14.66b | 15.96bc | 16.08bc |
| 2 | 75.12a | 80.89a | 15.19a | 16.23a | 16.36a |
| 3 | 74.29ab | 79.19c | 14.68b | 15.82c | 15.95c |
| 4 | 74.37ab | 80.11ab | 14.66b | 15.91bc | 16.03bc |
| 5 | 74.54a | 79.55bc | 14.71b | 16.11ab | 16.24ab |
| 平均值Mean | 74.41 | 79.73 | 14.78 | 16.01 | 16.13 |
| 最小值Minimum | 73.71 | 78.92 | 14.66 | 15.82 | 15.95 |
| 最大值Maximum | 75.12 | 80.89 | 15.19 | 16.23 | 16.36 |
| 变异系数CV/% | 0.68 | 0.99 | 1.56 | 1.02 | 1.03 |
| P值P-value | 0.025 | 0.001 | <0.001 | 0.009 | 0.004 |
2.2 不同来源高粱的IVDMD、IVGED和EHGE
由表3可知,5种高粱IVDMD、IVGED和EHGE的平均值分别为68.60%、72.40%和13.40 MJ/kg DM,CV分别为14.17%、15.64%及15.71%。5种高粱的IVDMD、IVGED和EHGE均存在显著差异(P<0.05),其中2号高粱的IVDMD、IVGED和EHGE最低,分别为55.93%、58.28%和10.72 MJ/kg DM,5号高粱的IVDMD、IVGED和EHGE最高,分别为79.28%、85.15%和15.73 MJ/kg DM。
表3 不同来源高粱的IVDMD、IVGED和EHGE (干物质基础)Table 3 IVDMD, IVGED and EHGE of sorghum from different sources (DM basis) |
| 项目 Items | 体外干物质消化率 IVDMD/% | 体外总能消化率 IVGED/% | 酶水解物能值 EHGE/(MJ/kg DM) | 表观代谢能 AME/(MJ/kg) | 真代谢能 TME/(MJ/kg) |
|---|---|---|---|---|---|
| 编号No. | |||||
| 1 | 75.51b | 81.07b | 15.04b | 14.27 | 14.69 |
| 2 | 55.93e | 58.28e | 10.72e | 13.43 | 13.59 |
| 3 | 70.81c | 73.71c | 13.64c | 14.10 | 14.22 |
| 4 | 61.49d | 63.81d | 11.86d | 13.79 | 13.94 |
| 5 | 79.28a | 85.15a | 15.73a | 15.37 | 15.48 |
| 平均值Mean | 68.60 | 72.40 | 13.40 | 14.19 | 14.38 |
| 最小值Minimum | 55.93 | 58.28 | 10.72 | 13.43 | 13.59 |
| 最大值Maximum | 79.28 | 85.15 | 15.73 | 15.37 | 15.48 |
| 变异系数CV/% | 14.17 | 15.64 | 15.71 | 5.16 | 5.10 |
| P值P-value | <0.001 | <0.001 | <0.001 | 0.481 | 0.636 |
2.3 5种不同来源玉米营养成分含量、体外消化指标与有效能的相关性分析
由表4可知,玉米的AME和TME与EHGE之间的相关系数均为0.80;DM含量与ADF含量和GE之间存在显著正相关(P<0.05),与IVGED之间存在极显著正相关(P<0.01);GE与CP、ADF含量和IVGED之间存在显著正相关(P<0.05);ADF含量与IVGED之间存在显著正相关(P<0.05)。
表4 玉米原料营养成分含量、IVDMD、IVGED、EHGE、AME与TME相关性分析Table 4 Correlation analysis between nutrient contents, IVDMD, IVGED, EHGE, AME and TME of corn |
| 项目 Items | 干物质 DM | 粗蛋 白质 CP | 粗脂肪 EE | 粗灰分 Ash | 中性洗 涤纤维 NDF | 酸性洗 涤纤维 ADF | 总能 GE | 体外 干物质 消化率 IVDMD | 体外 总能 消化率 IVGED | 酶水解 物能值 EHGE | 表观 代谢能 AME |
|---|---|---|---|---|---|---|---|---|---|---|---|
| 干物质DM | |||||||||||
| 粗蛋白质CP | 0.82 | ||||||||||
| 粗脂肪EE | 0.59 | 0.45 | |||||||||
| 粗灰分Ash | 0.42 | 0.85 | 0.05 | ||||||||
| 中性洗涤纤维NDF | 0.61 | 0.87 | 0.41 | 0.76 | |||||||
| 酸性洗涤纤维ADF | 0.91* | 0.85 | 0.57 | 0.51 | 0.85 | ||||||
| 总能GE | 0.91* | 0.91* | 0.74 | 0.57 | 0.83 | 0.95* | |||||
| 体外干物质消化率 IVDMD | 0.22 | 0.00 | 0.15 | -0.10 | -0.49 | -0.20 | -0.01 | ||||
| 体外总能消化率 IVGED | 0.99** | 0.76 | 0.60 | 0.33 | 0.59 | 0.92* | 0.89* | 0.16 | |||
| 酶水解物能值 EHGE | 0.68 | 0.56 | 0.43 | 0.37 | 0.10 | 0.35 | 0.54 | 0.82 | 0.60 | ||
| 表观代谢能AME | 0.29 | 0.42 | 0.51 | 0.39 | 0.07 | 0.06 | 0.37 | 0.70 | 0.19 | 0.80 | |
| 真代谢能TME | 0.30 | 0.40 | 0.53 | 0.36 | 0.05 | 0.06 | 0.37 | 0.71 | 0.20 | 0.80 | 1.00 |
2.4 5种不同来源高粱营养成分含量、体外消化指标与有效能的相关性分析
由表5可知,高粱的EHGE与AME和TME之间存在显著正相关(P<0.05);DM与EE含量和AME之间存在显著正相关(P<0.05);NDF含量与IVDMD、IVGED、EHGE、AME和TME之间均存在显著负相关(P<0.05),与GE之间存在显著正相关(P<0.05);ADF含量与IVDMD、IVGED、EHGE、AME和TME之间均存在显著负相关(P<0.05),与单宁含量之间存在显著正相关(P<0.05);单宁含量与IVDMD、IVGED和EHGE之间存在极显著负相关(P<0.01),与TME之间存在显著负相关(P<0.05);IVDMD与IVGED和EHGE之间存在极显著正相关(P<0.01),与AME和TME之间存在显著正相关(P<0.05);IVGED与EHGE之间存在极显著正相关(P<0.01),与AME和TME之间存在显著正相关(P<0.05);AME和TME与GE之间均存在显著负相关(P<0.05),与EHGE之间均存在显著正相关(P<0.05),TME与AME之间存在极显著正相关(P<0.01)。
表5 高粱原料营养成分含量、单宁含量、IVDMD、IVGED、EHGE、AME与TME相关性分析Table 5 Correlation analysis between nutrient contents, tannins content, IVDMD, IVGED, EHGE, AME and TME of sorghum |
| 项目 Items | 干物质 DM | 粗蛋 白质 CP | 粗脂肪 EE | 粗灰分 Ash | 中性洗 涤纤维 NDF | 酸性洗 涤纤维 ADF | 总能 GE | 单宁 Tannins | 体外 干物质 消化率 IVDMD | 体外 总能 消化率 IVGED | 酶水解 物能值 EHGE | 表观 代谢能 AME |
|---|---|---|---|---|---|---|---|---|---|---|---|---|
| 干物质DM | ||||||||||||
| 粗蛋白质CP | 0.67 | |||||||||||
| 粗脂肪EE | 0.92* | 0.82 | ||||||||||
| 粗灰分Ash | -0.15 | 0.22 | 0.05 | |||||||||
| 中性洗涤纤维 NDF | -0.86 | -0.38 | -0.77 | 0.53 | ||||||||
| 酸性洗涤纤维 ADF | -0.64 | -0.53 | -0.62 | 0.69 | 0.80 | |||||||
| 总能GE | -0.69 | -0.16 | -0.48 | 0.82 | 0.91* | 0.83 | ||||||
| 单宁Tannins | -0.61 | -0.42 | -0.66 | 0.61 | 0.86 | 0.93* | 0.79 | |||||
| 体外干物质 消化率 IVDMD | 0.72 | 0.48 | 0.74 | -0.57 | -0.91* | -0.93* | -0.82 | -0.99** | ||||
| 体外总能 消化率 IVGED | 0.69 | 0.45 | 0.70 | -0.62 | -0.91* | -0.94* | -0.85 | -0.99** | 1.00** | |||
| 酶水解物能值 EHGE | 0.69 | 0.46 | 0.71 | -0.61 | -0.90* | -0.95* | -0.84 | -0.99** | 1.00** | 1.00** | ||
| 表观代谢能 AME | 0.88* | 0.52 | 0.76 | -0.58 | -0.95* | -0.90* | -0.92* | -0.84 | 0.89* | 0.90* | 0.89* | |
| 真代谢能 TME | 0.80 | 0.48 | 0.70 | -0.67 | -0.93* | -0.96* | -0.93* | -0.90* | 0.94* | 0.95* | 0.94* | 0.98** |
2.5 基于仿生消化法构建鸡玉米、高粱原料有效能预测模型
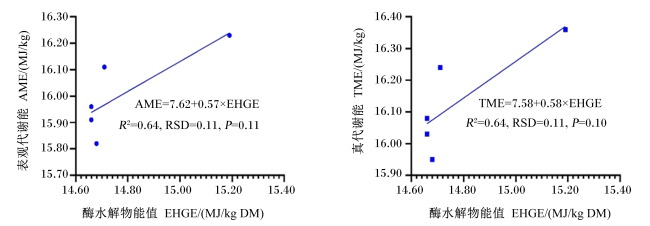
基于EHGE预测体内法测定的玉米原料AME和TME模型见图1,在本试验条件下AME预测模型为AME=7.62+0.57×EHGE[R2=0.64,相对标准偏差(RSD)=0.11,P=0.11];TME预测模型为TME=7.58+0.58×EHGE(R2=0.64,RSD=0.11,P=0.10)。
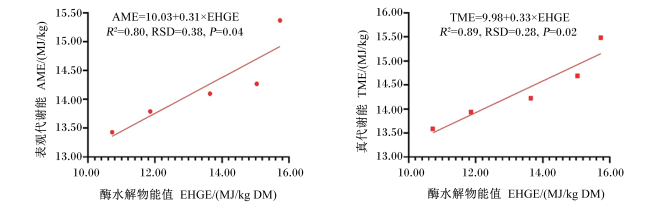
基于EHGE预测体内法测定的高粱原料AME和TME模型见图2, 在本试验条件下AME预测模型为 AME=10.03+0.31×EHGE(R2=0.80, RSD=0.38, P=0.04) ; TME预测模型为 TME=9.98+0.33×EHGE(R2=0.89, RSD=0.28, P=0.02)。


3 讨论
3.1 玉米和高粱原料的营养成分
3.2 玉米和高粱原料的IVDMD、IVGED和EHGE
3.3 鸡有效能预测方程
现阶段,关于有效能的预测多是基于化学成分[28-29]。在Meloche等[28]研究中建立了肉鸡基于化学成分的代谢能预测方程为AMEn(kcal/kg)=-12 282+(2.60×GE)+(89.75×CP)+(125.80×淀粉)-(40.67×总纤维),其中R2=0.86,P<0.01。该结果中的R2与本研究结果接近,但P值达到了差异极显著的水平,这可能与饲料原料间的变异相关,该试验所使用原料的AMEn变异范围为7.82~11.82 MJ/kg,而本研究中高粱的AME和TME的变异范围分别为13.43~15.37 MJ/kg和13.59~15.48 MJ/kg。因此,原料有效能变异范围的大小可能会影响预测方程的预测效果。
通过体外手段模拟动物体内的消化过程,获得与有效能高度相关的EHGE,也是一种常见预测原料有效能值的方法[5]。相较于传统生物学方法,该方法可以减少测值速度慢、费时、费力等弊端。在早期的研究中,体外消化模拟方式使用的是三角瓶模拟动物胃、小肠、大肠的消化,但与动物消化吸收生理过程吻合度不高,消化产物可能会对酶活性产生抑制作用[10]。因此,发展出了现在的SDS,避免了三角瓶体外酶解法的弊端,可以更加真实模拟动物体内养分的消化过程。在Zhao等[30]研究中,表明SDS所测EHGE可以有效预测鸭对玉米的代谢能;在Yu等[31]研究中使用SDS所测EHGE准确预测了公鸡对玉米的代谢能,因此本研究中代谢能预测方程选择EHGE作为预测因子。本研究的相关性分析中,鸡对高粱的代谢能与EHGE、IVDMD和IVGED均具有显著相关关系;而鸡对玉米的代谢能与EHGE的相关性最高,其次是IVDMD,但能否用IVDMD作为预测因子还有待进一步研究。在Yu等[31]研究中建立的基于肉鸡饲粮的预测方程为AME=0.844 9×IVDE+451(R2=0.98,RSD=28,P<0.01),其R2优于本研究的结果,这可能与试验使用饲粮的类型及规模有关。本研究建立了以EHGE为自变量的鸡对玉米和高粱AME和TME的预测方程,其中玉米代谢能预测方程的R2均为0.64,低于高粱的结果(0.80和0.89)。预测方程R2较低可能与使用的原料来源较少有关,导致预测方程易受极值点的影响。除样品规模外,还可能与原料的抗营养成分组成有关。本试验中高粱的单宁含量差异较大,使AME、TME和EHGE的变异增大,一定程度上提高了预测方程的准确性。表6列出了已发表文献中AME和TME实测值与基于本研究中预测模型获得的预测值的对比,可以看到本研究中的预测方程可以准确预测玉米和高粱的TME,差值分别为0.32和0.24 MJ/kg,而AME的预测值差异较大,可能与使用的动物品种、样品收集、试验方法等有关。
表6 基于已有数据验证玉米和高粱的有效能预测方程(干物质基础)Table 6 Available energy prediction equations of corn and sorghum were verified based on available data (DM basis) |
| 原料 Ingredients | 指标 Index | 实际值 Actual value/ (MJ/kg) | 预测值 Predicted value/ (MJ/kg) | 差值 Difference value/ (MJ/kg) | 饲喂方法 Test method | 收集方法 Collecting method | 文献来源 Literature source |
|---|---|---|---|---|---|---|---|
| 玉米Corn | AME | 14.74 | 16.65 | 1.91 | 强饲法 | 全收粪法 | 杨霞[16] |
| 玉米Corn | TME | 16.45 | 16.77 | 0.32 | 强饲法 | 全收粪法 | 杨霞[16] |
| 高粱Sorghum | AME | 12.08 | 14.17 | 2.08 | 强饲法 | 全收粪法 | Zhao等[12] |
| 高粱Sorghum | TME | 14.14 | 14.38 | 0.24 | 强饲法 | 全收粪法 | Zhao等[12] |
4 结论
① 5种来源玉米和高粱的EHGE与AEM和TME间具有较强的相关性,其中高粱的相关性更强。
② 基于EHEG的AME预测模型 : 玉米AME=7.62+0.57× EHGE(R2=0.64, RSD=0.11,P=0.11), 高粱AME=10.03+0.31×EHGE(R2=0.80, RSD=0.38,P=0.04)。
③ 基于EHEG的TME预测模型 : 玉米TME=7.58+0.58×EHGE(R2=0.64, RSD=0.11, P=0.10), 高粱TME=9.98+0.33×EHGE(R2=0.89,RSD=0.28, P=0.02)。