

1 材料与方法
1.1 试验设计
1.2 试验饲粮
表1 精料营养水平(干物质基础)Table 1 Nutrient levels of the concentrate (DM basis)% |
| 项目 Items | 含量 Content | |
|---|---|---|
| 粗蛋白质 CP/% | 19.75 | |
| 粗纤维 CF/% | 5.55 | |
| 粗灰分 Ash/% | 9.50 | |
| 钙 Ca/% | 1.20 | |
| 总磷 TP/% | 0.58 | |
| 氯化钠 NaCl/% | 1.15 | |
| L-赖氨酸 L-Lys/% | 0.80 | |
| 维生素A Vitamin A/(IU/kg) | 10 000.00 | |
| 维生素D3 Vitamin D3/(IU/kg) | 2 000.00 | |
| 维生素E Vitamin E/(IU/kg) | 50.00 | |
| 铜 Cu/(mg/kg) | 45.00 | |
| 铁 Fe/(mg/kg) | 350.00 | |
| 锌 Zn/(mg/kg) | 75.00(有机锌) | |
| 锰 Mn/(mg/kg) | 50.00 | |
| 硒 Se/(mg/kg) | 0.43(有机硒) | |
| 碘 I/(mg/kg) | 0.65 | |
| 钴 Co/(mg/kg) | 0.35 | |
| 非淀粉多糖酶 NSP enzyme/(mg/kg) | 300.00 | |
1.3 饲养管理
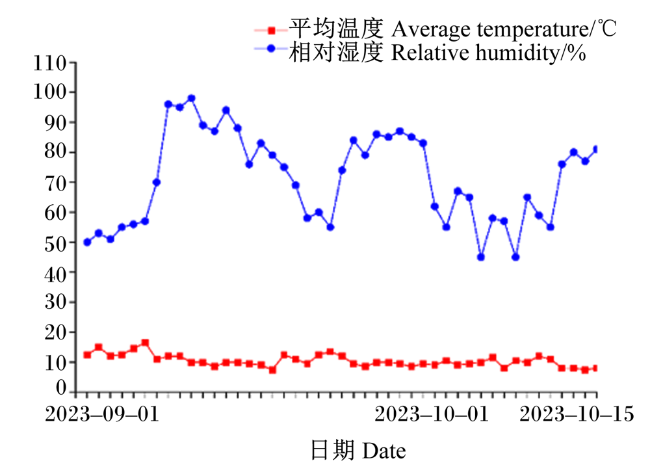


1.4 样品采集
1.4.1 血液样品采集
1.4.2 精液样品采集
1.5 测定指标及方法
1.5.1 生长性能指标
1.5.2 血清指标测定
1.5.3 精液品质测定
1.6 数据统计与分析
2 结果与分析
2.1 不同精料补饲水平对牦牛种公牛生长性能的影响
表2 不同精料补饲水平对牦牛种公牛生长性能的影响Table 2 Effects of different levels of concentrate supplementation on growth performance of yak breeding bulls |
| 项目 Items | 组别 Groups | P值 P-value | ||||||||
|---|---|---|---|---|---|---|---|---|---|---|
| Ⅰ(对照 Control) | Ⅱ | Ⅲ | Ⅳ | Ⅴ | 方差分析 ANOVA | 线性 Linear | 二次 Quadratic | |||
| 初始体重 IBW/kg | 580.00 ±50.34 | 577.00 ±69.84 | 590.00 ±44.75 | 591.40 ±67.05 | 584.00 ±67.23 | 0.994 | 0.797 | 0.843 | ||
| 终末体重 FBW/kg | 590.80 ±48.40 | 593.80 ±58.83 | 603.40 ±36.83 | 609.00 ±58.37 | 613.60 ±58.61 | 0.952 | 0.426 | 0.993 | ||
| 总增重 TWG/kg | 10.80 ±2.86 | 16.80 ±15.71 | 13.40 ±9.10 | 17.60 ±10.36 | 29.60 ±9.37** | 0.080 | 0.016 | 0.270 | ||
| 平均日增重 ADG/(kg/d) | 0.24 ±0.06 | 0.37 ±0.35 | 0.30 ±0.20 | 0.39 ±0.23 | 0.66 ±0.21** | 0.080 | 0.016 | 0.270 | ||
同行数据肩标无字母或相同小写字母表示差异不显著(P>0.05),不同小写字母表示差异显著(P<0.05),不同大写字母表示差异极显著(P<0.01)。*表示与对照组相比差异显著(P<0.05),**表示与对照组相比差异极显著(P<0.01)。下表同。 In the same row, values with no letter or the same small letter superscripts mean no significant difference (P>0.05), while with different small letter superscripts mean significant difference (P<0.05), and with different capital letter superscripts mean extremely significant difference (P<0.01). * mean significant difference compared with the control group (P<0.05), and ** mean extremely significant difference compared with the control group (P<0.01). The same as below. |
2.2 不同精料补饲水平对牦牛种公牛血清生化指标的影响
表3 不同精料补饲水平对牦牛种公牛血清生化指标的影响Table 3 Effects of different levels of concentrate supplementation on serum biochemical indices of yak breeding bulls |
| 项目 Items | 组别 Groups | P值 P-value | |||||||
|---|---|---|---|---|---|---|---|---|---|
| Ⅰ(对照 Control) | Ⅱ | Ⅲ | Ⅳ | Ⅴ | 方差分析 ANOVA | 线性 Linear | 二次 Quadratic | ||
| 葡萄糖 GLU/(mmol/L) | 4.21 ±0.40 | 4.41 ±0.94 | 4.84 ±0.29 | 4.82 ±1.01 | 5.08 ±0.80 | 0.412 | 0.063 | 0.810 | |
| 总蛋白 TP/(g/L) | 73.88 ±4.71c | 74.62 ±6.36bc | 78.98 ±3.54abc | 81.64 ±3.11ab | 82.57 ±6.34a | 0.046 | 0.003 | 0.881 | |
| 白蛋白 ALB/(g/L) | 33.73 ±0.87 | 35.40 ±1.26 | 36.65 ±1.92* | 34.82 ±1.83 | 35.35 ±2.26 | 0.190 | 0.293 | 0.080 | |
| 甘油三酯 TG/(mmol/L) | 0.18 ±0.08 | 0.26 ±0.12 | 0.28 ±0.12 | 0.28 ±0.14 | 0.45 ±0.19* | 0.071 | 0.010 | 0.524 | |
| 低密度脂蛋白胆固醇 LDL-C/(mmol/L) | 0.19 ±0.16 | 0.31 ±0.24 | 0.24 ±0.21 | 0.40 ±0.26 | 0.47 ±0.16 | 0.256 | 0.045 | 0.707 | |
| 总胆汁酸 TBA/(μmol/L) | 6.72 ±1.01 | 9.30 ±3.22 | 9.90 ±1.78 | 9.46 ±2.64 | 10.52 ±2.25** | 0.134 | 0.028 | 0.317 | |
| 谷丙转氨酶 ALT/(U/L) | 33.96 ±5.61 | 38.02 ±6.40 | 39.45 ±8.53 | 41.58 ±7.14 | 45.29 ±7.94* | 0.193 | 0.020 | 0.999 | |
| 总胆红素 TBIL/(μmol/L) | 1.63 ±0.46 | 1.78 ±0.69 | 1.75 ±0.54 | 1.77 ±0.40 | 2.37 ±0.88 | 0.391 | 0.116 | 0.394 | |
| 尿素 UREA/(mmol/L) | 4.31 ±0.68b | 4.60 ±0.72ab | 4.61 ±0.09ab | 5.32 ±0.75a | 5.50 ±0.67a | 0.041 | 0.003 | 0.681 | |
| 淀粉酶 AMY/(U/L) | 17.30 ±2.52 | 15.43 ±3.40 | 15.95 ±1.42 | 18.58 ±4.98 | 19.34 ±3.25 | 0.397 | 0.154 | 0.230 | |
2.3 不同精料补饲水平对牦牛种公牛血清抗氧化指标的影响
表4 不同精料补饲水平对牦牛种公牛血清抗氧化指标的影响Table 4 Effects of different levels of concentrate supplementation on serum antioxidant indices of yak breeding bulls |
| 项目 Items | 组别 Groups | P值 P-value | ||||||||
|---|---|---|---|---|---|---|---|---|---|---|
| Ⅰ(对照 Control) | Ⅱ | Ⅲ | Ⅳ | Ⅴ | 方差分析 ANOVA | 线性 Linear | 二次 Quadratic | |||
| 过氧化氢酶 CAT/(U/mL) | 2.35 ±1.22 | 1.97 ±1.03 | 1.94 ±0.16 | 2.89 ±1.29 | 2.16 ±0.36 | 0.748 | 0.739 | 0.888 | ||
| 谷胱甘肽过氧化物酶 GSH-Px/(U/mL) | 89.40 ±9.77b | 100.26 ±12.78ab | 117.14 ±4.24a | 101.30 ±10.06ab | 107.03 ±17.15ab | 0.034 | 0.046 | 0.052 | ||
| 丙二醛 MDA/(nmol/mL) | 3.05 ±1.46 | 3.29 ±0.50 | 4.39 ±1.10 | 5.09 ±1.85 | 5.61 ±0.61* | 0.055 | 0.004 | 0.941 | ||
2.4 不同精料补饲水平对牦牛种公牛血清细胞因子含量的影响
表5 不同精料补饲水平对牦牛种公牛血清细胞因子含量的影响Table 5 Effects of different levels of concentrate supplementation on serum cytokine contents of yak breeding bullsng/L |
| 项目 Items | 组别 Groups | P值 P-value | ||||||||
|---|---|---|---|---|---|---|---|---|---|---|
| Ⅰ(对照 Control) | Ⅱ | Ⅲ | Ⅳ | Ⅴ | 方差分析 ANOVA | 线性 Linear | 二次 Quadratic | |||
| 白细胞介素-1 IL-1 | 116.56 ±16.78 | 129.67 ±16.65 | 117.63 ±15.42 | 110.06 ±10.53 | 129.64 ±12.84 | 0.198 | 0.756 | 0.500 | ||
| 白细胞介素-2 IL-2 | 219.79 ±32.71 | 202.22 ±46.84 | 209.26 ±37.66 | 223.32 ±21.73 | 213.71 ±15.31 | 0.866 | 0.845 | 0.682 | ||
| 白细胞介素-4 IL-4 | 58.54 ±6.20 | 58.09 ±3.15 | 69.93 ±5.13* | 63.96 ±7.28 | 60.55 ±10.51 | 0.142 | 0.346 | 0.073 | ||
| 肿瘤坏死因子-α TNF-α | 193.94 ±43.21 | 197.34 ±37.06 | 183.62 ±16.58 | 196.28 ±51.81 | 209.60 ±23.26 | 0.889 | 0.580 | 0.489 | ||
2.5 不同精料补饲水平对牦牛种公牛精液品质的影响
表6 不同精料补饲水平对牦牛种公牛精液品质的影响Table 6 Effects of different levels of concentrate supplementation on semen quality of yak breeding bulls |
| 项目 Items | 组别 Groups | P值 P-value | ||||||||
|---|---|---|---|---|---|---|---|---|---|---|
| Ⅰ(对照 Control) | Ⅱ | Ⅲ | Ⅳ | Ⅴ | 方差分析 ANOVA | 线性 Linear | 二次 Quadratic | |||
| 射精量 Ejaculation volume/mL | 4.30 ±1.77 | 3.23 ±1.19 | 3.66 ±1.29 | 2.33 ±0.41 | 4.11 ±1.47 | 0.180 | 0.517 | 0.105 | ||
| 精子密度 Sperm density/ (×108个/mL) | 10.03 ±2.02Bb | 13.00 ±1.78ABa | 15.28 ±0.63Aa | 14.54 ±2.03Aa | 15.25 ±0.79Aa | 0.001 | <0.001 | 0.016 | ||
| 冻精预冻支数 Number of pre-frozen semen tubes/支 | 94.22 ±21.13 | 104.58 ±17.76 | 107.94 ±12.79 | 101.37 ±11.57 | 117.75 ±11.82 | 0.245 | 0.069 | 0.939 | ||
| 冻精入库支数 Number of frozen semen stocked tubes/支 | 129.72 ±39.08 | 130.40 ±30.84 | 137.42 ±13.85 | 121.22 ±13.55 | 145.94 ±6.91 | 0.542 | 0.508 | 0.555 | ||
| 精子前向运动能力 Sperm forward motion ability/% | 30.08 ±6.67Bc | 44.75 ±11.91ABb | 58.90 ±11.17Aa | 49.14 ±6.76Aab | 60.98 ±4.16Aa | <0.001 | <0.001 | 0.066 | ||
| 精子形态正常率 Sperm morphological normality/% | 86.83 ±6.51 | 82.54 ±3.47 | 82.27 ±3.94 | 84.10 ±5.32 | 85.45 ±3.55 | 0.603 | 0.865 | 0.131 | ||
| 精子尾部弯曲 Sperm tail bending/% | 1.93 ±0.52 | 2.41 ±0.23 | 1.45 ±1.00 | 2.19 ±0.32 | 1.98 ±0.32 | 0.166 | 0.877 | 0.746 | ||