1 材料与方法
1.1 试验饲料与饲养管理
表1 试验饲料组成及营养水平(风干基础)Table 1 Composition and nutrient levels of experimental diets (air-dry basis) % |
| 项目 Items | 含量Content | ||||
|---|---|---|---|---|---|
| C | M | ||||
| 原料Ingredients | |||||
| 豌豆浓缩蛋白Pea protein concentrate | 26.30 | 26.30 | |||
| 喷干血球粉Spray-dried blood meal | 6.50 | 6.50 | |||
| 面粉Wheat flour | 56.98 | 56.98 | |||
| 沸石粉Zeolite | 2.20 | 2.20 | |||
| 豆油Soybean oil | 3.50 | 3.50 | |||
| 维生素和矿物质预混料Vitamin and mineral premix1) | 1.20 | 1.20 | |||
| 磷酸二氢钙Ca(H2PO4)2 | 3.00 | 3.00 | |||
| L-谷氨酸L-glutamic acid | 0.32 | ||||
| DL-蛋氨酸DL-methionine (98%) | 0.32 | ||||
| 合计Total | 100.00 | 100.00 | |||
| 营养水平Nutrient levels2) | |||||
| 水分Moisture | 6.17 | 6.64 | |||
| 粗蛋白质Crude protein | 33.77 | 34.32 | |||
| 粗脂肪Crude lipid | 3.84 | 3.86 | |||
| 粗灰分Ash | 6.17 | 6.64 | |||
| 总能Gross energy/(MJ/kg) | 17.82 | 17.94 | |||
1)维生素和矿物质预混料为每千克饲粮提供 The vitamin and mineral premix provided the following per kg of diets:VA 24 000 IU,VB1 10 mg,VB2 12 mg,VB6 10 mg,VB12 (1%) 4 mg,VD3 160 000 IU,VE 200 mg,VK3 7 mg,生物素 biotin 1 mg,叶酸 folic acid 3 mg,D-泛酸 D-pantothenic acid 30 mg,烟酸 nicotinic acid 50 mg,VC (35%) 200 mg,肌醇 inositol 200 mg,氯化胆碱 choline chloride 2 000 mg,抗氧化剂 antioxidant 100 mg,MgSO4·7H2O 2 000 mg,NaHCO3 20 mg,FeSO4·7H2O 300 mg,ZnSO4·7H2O 220 mg,MnSO4·7H2O 25 mg,KIO3 5 mg,Na2SeO3 (10% Se) 5 mg,CoCl·6H2O (10% Co) 5 mg,沸石 zeolite 6 669 mg。 2) 营养水平均为实测值。Nutrient levels were measured values. |
表2 试验饲料氨基酸组成(分别以g/kg和g/16 g N表示)Table 2 Amino acid composition of experimental diets (expressed as g/kg and g/16 g N, respectively) |
| 项目 Items | C | M | C | M | |
|---|---|---|---|---|---|
| g/kg | g/16 g N | ||||
| 必需氨基酸EAA | |||||
| 蛋氨酸Met | 3.85 | 6.83 | 1.14 | 1.99 | |
| 精氨酸Arg | 22.40 | 22.40 | 6.63 | 6.53 | |
| 组氨酸His | 11.10 | 11.00 | 3.29 | 3.21 | |
| 异亮氨酸Ile | 12.30 | 12.20 | 3.64 | 3.56 | |
| 亮氨酸Leu | 29.80 | 29.70 | 8.82 | 8.66 | |
| 赖氨酸Lys | 21.90 | 22.20 | 6.49 | 6.47 | |
| 苯丙氨酸Phe | 18.80 | 18.90 | 5.57 | 5.51 | |
| 苏氨酸Thr | 11.00 | 10.90 | 3.26 | 3.18 | |
| 缬氨酸Val | 17.80 | 17.90 | 5.27 | 5.22 | |
| 非必需氨基酸NEAA | |||||
| 天冬氨酸Asp | 34.10 | 34.00 | 10.10 | 9.91 | |
| 丝氨酸Ser | 16.10 | 15.90 | 4.77 | 4.64 | |
| 甘氨酸Gly | 13.40 | 13.40 | 3.97 | 3.91 | |
| 丙氨酸Ala | 15.70 | 15.80 | 4.65 | 4.61 | |
| 胱氨酸Cys | 3.50 | 3.60 | 1.04 | 1.05 | |
| 谷氨酸Glu | 67.90 | 65.30 | 20.11 | 19.04 | |
| 脯氨酸Pro | 17.90 | 18.70 | 5.30 | 5.45 | |
1.2 检测指标与方法
1.3 计算公式
1.4 数据统计分析
2 结果与分析
2.1 生长性能
表3 补充蛋氨酸对鲤生长性能和形体指标的影响Table 3 Effects of Met supplementation on growth performance and morphological indexes of common carp (n=9) |
| 项目 Items | 组别Groups | |
|---|---|---|
| C | M | |
| 生长性能指标Growth performance indexes | ||
| 特定生长率SGR/(%/d) | 1.65±0.04a | 2.17±0.03b |
| 总摄食量FC/(g/尾) | 33.51±0.70a | 36.86±0.48b |
| 摄食率FR/(% BW/d) | 2.32±0.02b | 2.05±0.02a |
| 饲料系数FCR | 1.50±0.03b | 1.06±0.02a |
| 蛋白质效率PER | 197.43±4.39a | 276.25±4.42b |
| 形体指标Morphological indexes | ||
| 肥满度CF/(g/cm3) | 1.84±0.02 | 1.88±0.02 |
| 肝体比HSI/% | 2.58±0.14b | 2.20±0.20a |
| 脏体比VSI/% | 11.75±0.35 | 12.13±0.74 |
同行数据肩标不同字母表示差异显著(P<0.05)。下表同。 | |
Values in the same row with different superscript letters are significantly different (P<0.05). The same as below. |
2.2 氮循环和氨基酸沉积率
表4 补充蛋氨酸对鲤氮循环和氨基酸沉积率的影响Table 4 Effects of Met supplementation on nitrogen cycle and amino acid retention rates of common carp (n=9) |
| 项目 Items | 组别Groups | |
|---|---|---|
| C | M | |
| 氮循环指标Nitrogen cycle indexes | ||
| 氮摄入量N intake/(g/桶) | 54.33±1.13a | 60.73±0.80b |
| 氮排放量N lose/(g/桶) | 41.08±0.80b | 37.93±0.71a |
| 氮沉积率N retention rate/% | 24.37±0.70a | 37.55±0.40b |
| 氨基酸沉积率AA retention rate/% | ||
| 蛋氨酸Met | 43.76±1.44a | 51.57±1.94b |
| 精氨酸Arg | 21.94±1.58a | 33.98±0.43b |
| 组氨酸His | 18.05±1.62a | 27.43±0.53b |
| 异亮氨酸Ile | 28.31±0.84a | 43.43±1.60b |
| 亮氨酸Leu | 19.50±0.61a | 29.50±0.92b |
| 赖氨酸Lys | 28.23±0.79a | 42.32±1.14b |
| 苯丙氨酸Phe | 16.48±0.84a | 24.87±0.53b |
| 苏氨酸Thr | 31.36±0.95a | 47.95±1.00b |
| 缬氨酸Val | 29.72±0.74a | 40.04±1.00b |
| 总必需氨基酸TEAA | 26.37±0.97a | 37.90±0.90b |
| 总非必需氨基酸TNEAA | 26.42±0.92a | 39.62±0.76b |
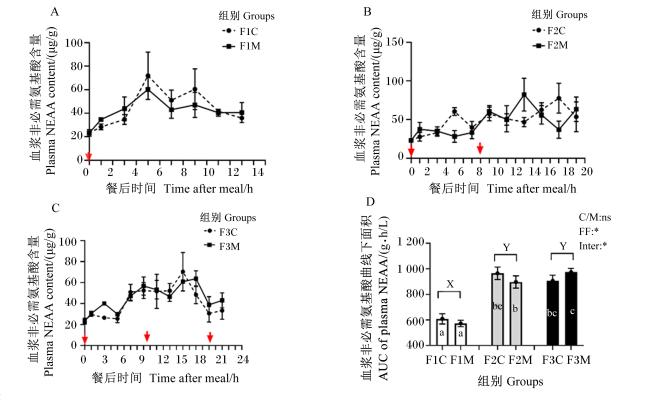
2.3 空腹血浆生理指标及投喂频率对餐后血浆游离氨基酸含量的影响
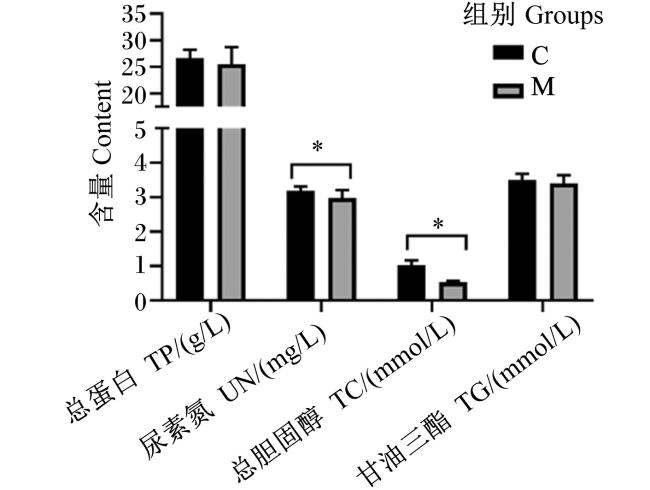
图1 餐后24 h鲤血浆TP、UN、TG和TC含量“*”表示差异显著(P<0.05)。The significant difference is marked with “*”. Fig.1 Plasma TP, UN, TG and TC contents at postprandial 24 h of common carp (n=18) |
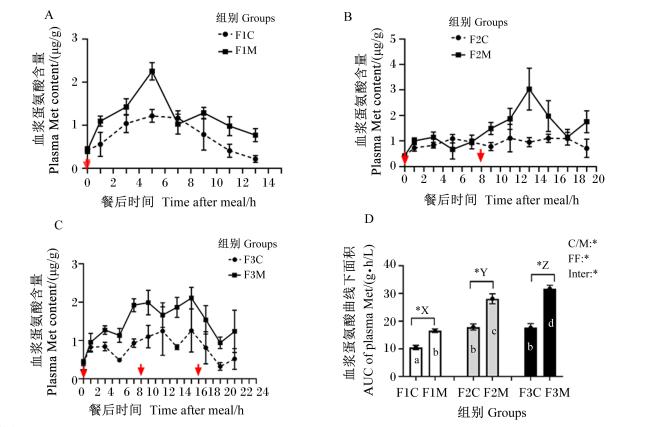
图2 不同投喂频率对鲤餐后不同时间血浆蛋氨酸含量的影响图A、B、C中红色箭头表示不同投喂频率下的投喂时间。图D中C/M表示补充蛋氨酸的影响,以“*”表示差异显著(P<0.05);FF表示投喂频率的影响,以不同大写字母表示差异显著(P<0.05);Inter表示交互作用的影响,以不同小写字母表示差异显著(P<0.05)。下图同。 Fig.2 Effects of various feeding frequencies on plasma Met content at different time after meal of common carp In figures A, B and C, the red arrow shows the feeding time with various feeding frequency. In figure D, C/M mean the effect of Met supplementation effect, and the significant difference is marked with “*” (P<0.05); FF mean the effect of feeding frequency, and the significant difference is marked with different uppercase letters (P<0.05) ; Inter mean the effect of interaction, and the significant difference is marked with different lowercase letters (P<0.05). The same as below. |
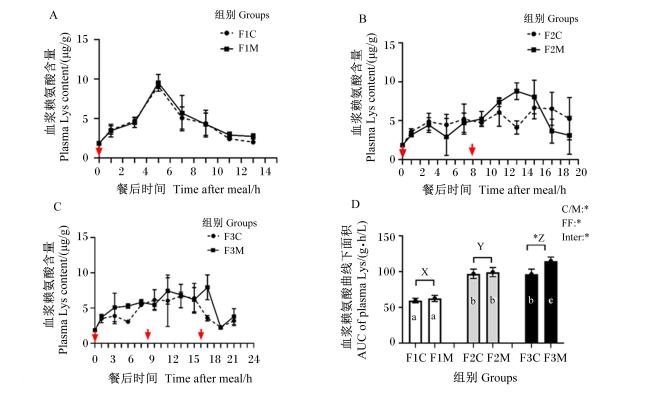
图3 不同投喂频率对鲤餐后不同时间血浆赖氨酸含量的影响Fig.3 Effects of various feeding frequencies on plasma Lys content at different time after meal of common carp |
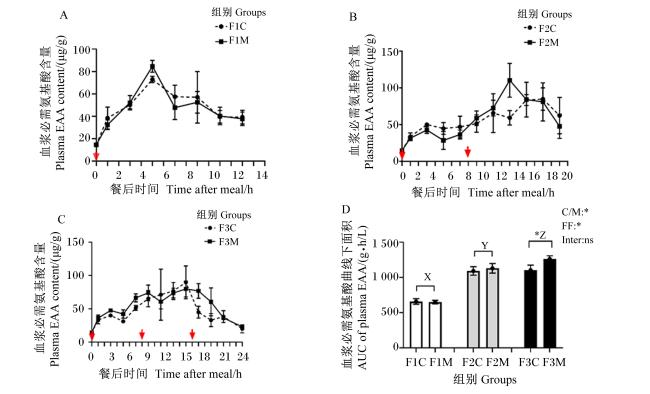
图4 不同投喂频率对鲤餐后不同时间血浆必需氨基酸含量的影响Fig.4 Effects of various feeding frequencies on plasma EAA content at different time after meal of common carp |