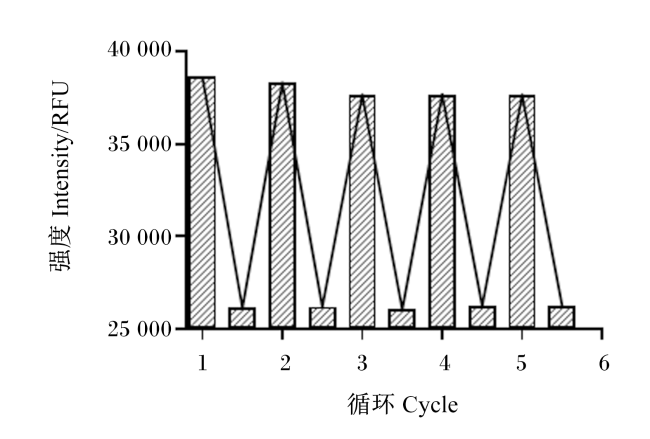
1 材料与方法
1.1 试验材料
1.1.1 主要试剂
1.1.2 主要仪器
1.2 试验方法
1.2.1 Tb-MOF的制备
1.2.2 RAC的荧光检测
2 结果与分析
2.1 Tb-MOF表征
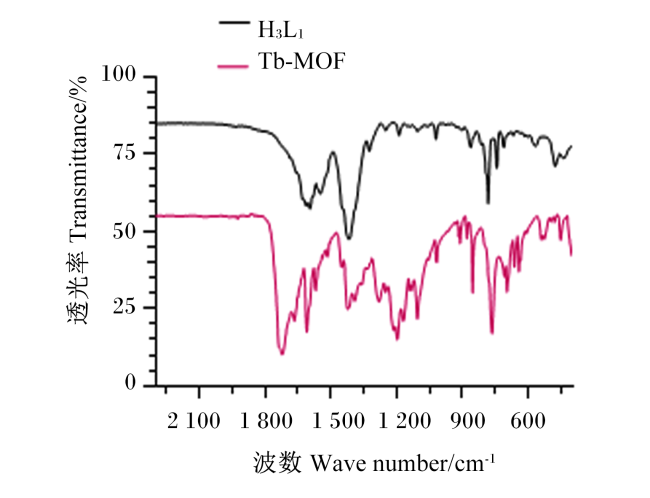
2.1.1 红外分析
2.1.2 晶体结构分析
表1 Tb-MOF的晶体结构分析Table 1 Crystal structure analysis of Tb-MOF |
| 项目Items | 参数Parameter | 项目Items | 参数Parameter | |
|---|---|---|---|---|
| 分子式 Empirical formula | C42H22Tb3O16.67 | 单位晶胞中所含分子个数 Unit number of molecules contained in a crystal cell (Z) | 6 | |
| 相对分子质量 Relative molecular mass | 1 270.02 | 晶体密度计算值 Calculated crystal density (Dc)/(g/cm3) | 1.228 | |
| 晶系 Crystal system | 六方 | 吸收系数 Absorption coefficient (μ)/mm-1 | 15.308 | |
| 空间群 Space group | P63/mmc | 晶胞中的电子数目 Number of electrons in a crystal cell [F(000)] | 3 614 | |
| 晶胞棱边长a Crystal cell edge length a/nm | 2.257 68(3) | 数据收集的θ范围 θ range for data collection/° | 3.786~73.723 | |
| 晶胞棱边长b Crystal cell edge length b/nm | 2.257 68(3) | 基于F2的拟合优度值 Goodness-of-fit on F2 | 1.078 | |
| 晶胞棱边长c Crystal cell edge length c/nm | 2.334 91(3) | 权重一致性因子[I>2σ(I)] R1,w(R2) [I>2σ(I)] | 0.035 5/0.092 6 | |
| 晶胞体积 Crystal cell volume/nm3 | 10.306 8(3) | 权重一致性因子[所有数据] R1,w(R2) [all data] | 0.042 1/0.096 2 |
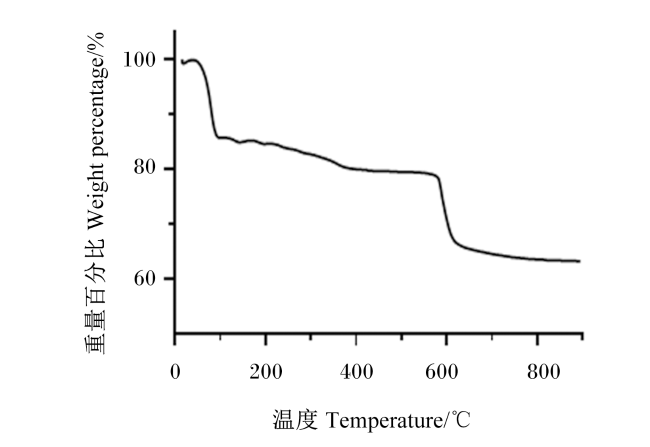
2.1.3 热重分析
2.2 Tb-MOF的发光性质
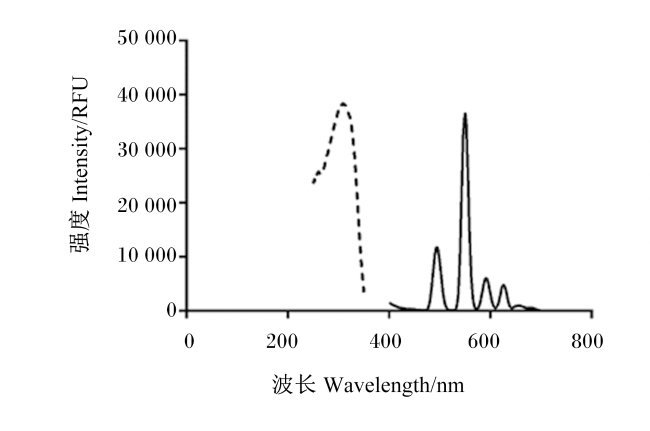
2.3 Tb-MOF荧光法检测RAC
2.3.1 试验条件优化
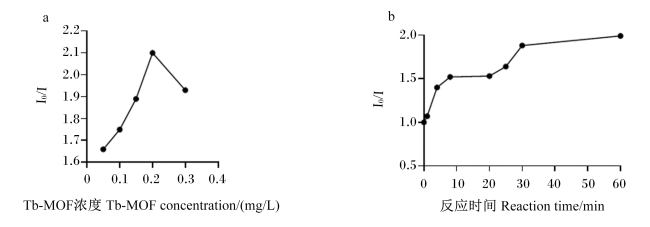
图4 Tb-MOF与RAC反应条件优化I0/I表示荧光猝灭效率,即Tb-MOF初始发射峰强度(I0)与RAC存在下Tb-MOF的发射峰强度(I)之间的比值。图8同。 a:Tb-MOF浓度对I0/I的影响 effects of Tb-MOF concentration on I0/I;b:反应时间对I0/I的影响 effects of reaction time on I0/I。 Fig.4 Optimization of reaction conditions between Tb-MOF and RAC I0/I mean fluorescence quenching efficiency, which was the ratio of initial peak emission intensity (I0) of Tb-MOF and peak emission intensity (I) of Tb-MOF in presence of RAC. The same as Fig.8. |
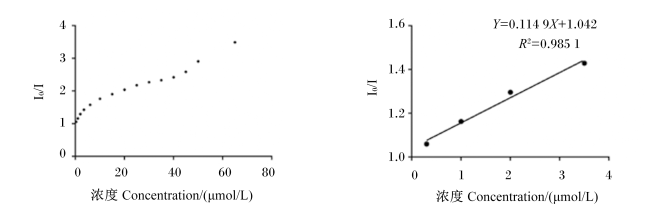
2.3.2 RAC定量分析
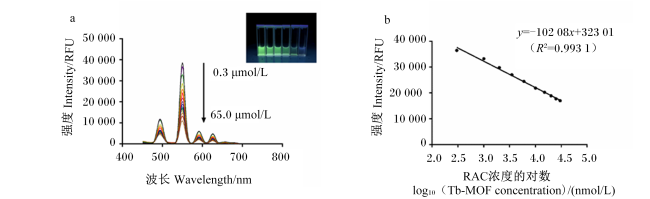
2.3.3 选择性和干扰分析
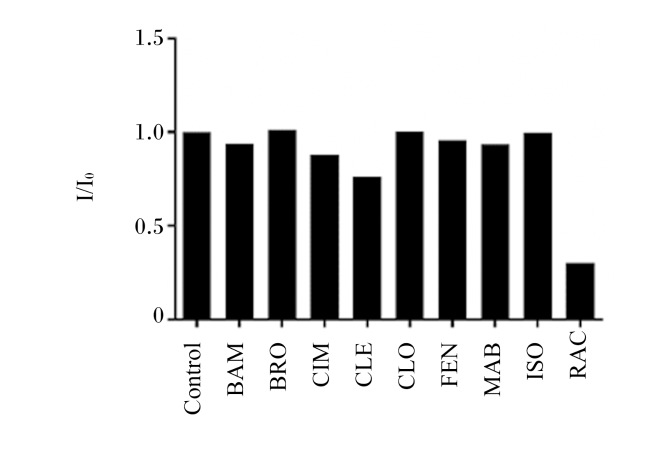
图6 RAC选择性和干扰分析I/I0表示向Tb-MOF标准分散液中加入50 μmol/L不同β-激动剂与未加入β-激动剂情况下550 nm处最高峰荧光强度比值。 Control:对照;BAM:班布特罗 bambuterol;BRO:溴布特罗 brombuterol;CIM:西布特罗 cimbuterol;CLE:克仑特罗 clenbuterol;CLO:克伦丙罗 clenproperol;FEN:非诺特罗 fenoterol;MAB:马布特罗 mabuterol;ISO:异丙肾上腺素 isoprenaline;RAC:莱克多巴胺 ractopamine。 Fig.6 Selectivity and interference analysis for RAC I/I0 mean ratio of ratio of peak fluorescence intensity at 550 nm when 50 μmol/L different β-agonists were added to Tb-MOF standard suspension and when no β-agonist was added. |
2.3.4 实际样品分析
表2 RAC在猪尿样品中的加标回收率Table 2 Adding standard recovery rates of RAC in pig urine samples (n=3) |
| 项目 Item | 添加值 Adding value/(μmol/L) | 检出值 Measured value/(μmol/L) | 回收率 Recovery rate/% | 相对标准偏差 RSD/% |
|---|---|---|---|---|
莱克多巴胺RAC | 3 | 2.8 | 93.3 | 8.9 |
| 15 | 13.1 | 87.3 | 5.3 | |
| 30 | 32.6 | 108.7 | 10.4 |