

1 材料与方法
1.1 试验设计及饲养管理
表1 试验饲粮组成及营养水平(干物质基础)Table 1 Composition and nutrient levels of experiment diets (DM basis) % |
| 项目 Items | 组别Groups | ||
|---|---|---|---|
| LCP | MCP | HCP | |
| 原料Ingredients | |||
| 玉米青贮Corn silage | 52.50 | 49.00 | 47.50 |
| 小麦秸秆Wheat straw | 15.00 | 11.50 | 12.00 |
| 玉米Corn | 28.00 | 23.50 | 20.50 |
| 豆粕Soybean meal | 0.50 | 2.00 | 5.00 |
| 菜籽粕Rapeseed meal | 0.50 | 2.00 | 5.50 |
| 小麦麸Wheat bran | 0.50 | 9.00 | 6.50 |
| 食盐NaCl | 1.00 | 1.00 | 1.00 |
| 磷酸氢钙CaHPO4 | 1.00 | 1.00 | 1.00 |
| 预混料Premix1) | 1.00 | 1.00 | 1.00 |
| 合计Total | 100.00 | 100.00 | 100.00 |
| 营养水平Nutrient levels2) | |||
| 代谢能ME/(MJ/kg) | 10.40 | 10.45 | 10.41 |
| 粗蛋白质CP | 8.08 | 10.01 | 12.04 |
| 中性洗涤纤维NDF | 36.81 | 36.43 | 36.48 |
| 酸性洗涤纤维ADF | 22.13 | 20.97 | 21.49 |
| 钙Ca | 0.49 | 0.49 | 0.52 |
1.2 样品采集
1.3 指标测定
1.3.1 饲粮营养成分
1.3.2 犊牛初生体况
1.3.3 瘤胃发酵性能及血清生化指标
1.3.4 微生物多样性
1.3.4.1 DNA提取与测序
1.3.4.2 生物信息学分析
1.4 数据统计分析
2 结果与分析
2.1 饲粮蛋白质水平对初生犊牛体况的影响
表2 饲粮蛋白质水平对初生犊牛体况的影响Table 2 Effects of dietary protein levels on body condition of newborn calves |
| 项目 Items | 组别Groups | 标准误 SE | P值 P-value | ||
|---|---|---|---|---|---|
| LCP | MCP | HCP | |||
| 体重Body weight/kg | 21.84b | 29.40a | 25.29b | 0.96 | 0.001 |
| 体高Body height/cm | 65.89b | 70.70a | 68.29ab | 0.82 | 0.048 |
| 腹围Abdominal circumference/cm | 62.73b | 71.71a | 66.09b | 1.17 | 0.002 |
| 胸围Chest circumference/cm | 64.40b | 70.44a | 67.30ab | 0.89 | 0.013 |
| 体斜长Body diagonal length/cm | 52.06b | 58.80a | 54.21ab | 1.14 | 0.039 |
| 坐骨端宽Sciatic wide/cm | 4.19 | 4.60 | 4.36 | 0.12 | 0.377 |
| 管围Cannon circumference/cm | 9.50 | 10.24 | 10.01 | 0.18 | 0.243 |
| 十字部高Cross height/cm | 69.26 | 73.96 | 69.61 | 1.07 | 0.132 |
| 尻长Caudal length/cm | 17.80b | 19.17b | 22.07a | 0.58 | 0.003 |
同行数据肩标不同小写字母表示差异显著(P<0.05),相同或无字母表示差异不显著(P>0.05)。下表同。 | |
In the same row, values with different small letter superscripts mean significant difference (P<0.05), while with the same or no letter superscripts mean no significant difference (P>0.05). The same as below. |
2.2 饲粮蛋白质水平对妊娠期秦川母牛瘤胃发酵性能的影响
表3 饲粮蛋白质水平对妊娠期秦川母牛瘤胃发酵性能的影响Table 3 Effects of dietary protein levels on rumen fermentation performance of Qinchuan cows during pregnancy |
| 项目 Items | 组别Groups | 标准误 SE | P值 P-value | ||
|---|---|---|---|---|---|
| LCP | MCP | HCP | |||
| pH | 6.60b | 6.86a | 6.94a | 0.05 | 0.014 |
| 氨态氮NH3-N/(mmol/L) | 5.50b | 5.94b | 7.90a | 0.39 | 0.016 |
| 乙酸Acetate/(mmol/L) | 60.29b | 80.17a | 70.37ab | 2.87 | 0.006 |
| 丙酸Propionate/(mmol/L) | 22.67 | 24.80 | 24.60 | 0.43 | 0.076 |
| 异丁酸Isobutyrate/(mmol/L) | 2.00 | 2.04 | 2.05 | 0.07 | 0.962 |
| 丁酸Butyrate/(mmol/L) | 15.20 | 15.65 | 16.57 | 0.57 | 0.641 |
| 异戊酸Isovalerate/(mmol/L) | 2.31 | 2.14 | 2.06 | 0.13 | 0.751 |
| 戊酸Valerate/(mmol/L) | 1.98 | 1.69 | 1.55 | 0.09 | 0.155 |
| 总挥发性脂肪酸TVFAs/(mmol/L) | 104.45b | 126.50a | 117.19a | 2.91 | <0.001 |
| 乙酸/丙酸Acetate/propionate | 2.69 | 3.25 | 2.86 | 0.19 | 0.146 |
2.3 饲粮蛋白质水平对妊娠期秦川母牛血清生化指标的影响
2.3.1 血清代谢相关指标
表4 饲粮蛋白质水平对妊娠期秦川母牛血清代谢相关指标的影响Table 4 Effects of dietary protein levels on serum metabolic related parameters of Qinchuan cows during pregnancy |
| 项目 Items | 组别Groups | 标准误 SE | P值 P-value | ||
|---|---|---|---|---|---|
| LCP | MCP | HCP | |||
| 总胆固醇TC/(mmol/L) | 2.45 | 2.72 | 2.21 | 0.09 | 0.068 |
| 甘油三酯TG/(mmol/L) | 0.33 | 0.34 | 0.32 | 0.02 | 0.888 |
| 总胆汁酸TBA/(μmol/L) | 30.98 | 26.01 | 34.13 | 3.30 | 0.616 |
| 高密度脂蛋白HDL/(mmol/L) | 1.25ab | 1.41a | 1.15b | 0.04 | 0.034 |
| 游离脂肪酸NEFA/(mmol/L) | 0.58 | 0.46 | 0.57 | 0.07 | 0.731 |
| β-羟丁酸β-HB/(mmol/L) | 0.35 | 0.32 | 0.39 | 0.03 | 0.558 |
| 葡萄糖GLU/(mmol/L) | 2.18 | 2.46 | 2.09 | 0.07 | 0.063 |
| 乳酸LAC/(mg/dL) | 66.73 | 59.56 | 46.80 | 3.95 | 0.125 |
| 总蛋白TP/(g/L) | 67.93b | 74.70a | 67.66b | 1.31 | 0.030 |
| 白蛋白ALB/(g/L) | 27.65 | 26.76 | 27.85 | 0.59 | 0.322 |
| 尿素氮UN/(mmol/L) | 2.49ab | 2.02b | 2.88a | 0.13 | 0.011 |
2.3.2 血清酶活性相关指标
表5 饲粮蛋白质水平对妊娠期秦川母牛血清酶活性相关指标的影响Table 5 Effects of dietary protein levels on serum enzyme activity related parameters of Qinchuan cows during pregnancy |
| 项目 Items | 组别Groups | 标准误 SE | P值 P-value | ||
|---|---|---|---|---|---|
| LCP | MCP | HCP | |||
| 超氧化物歧化酶SOD/(U/mL) | 137.00 | 127.71 | 136.17 | 3.79 | 0.479 |
| γ-谷氨酰胺基转移酶GGT/(U/L) | 25.50 | 29.57 | 27.67 | 1.27 | 0.441 |
| 谷丙转氨酶ALT/(U/L) | 21.80 | 20.17 | 21.15 | 0.98 | 0.805 |
| 谷草转氨酶AST/(U/L) | 62.43 | 69.51 | 66.43 | 1.98 | 0.355 |
2.4 饲粮蛋白质水平对妊娠期秦川母牛瘤胃微生物多样性的影响
2.4.1 α多样性和β多样性
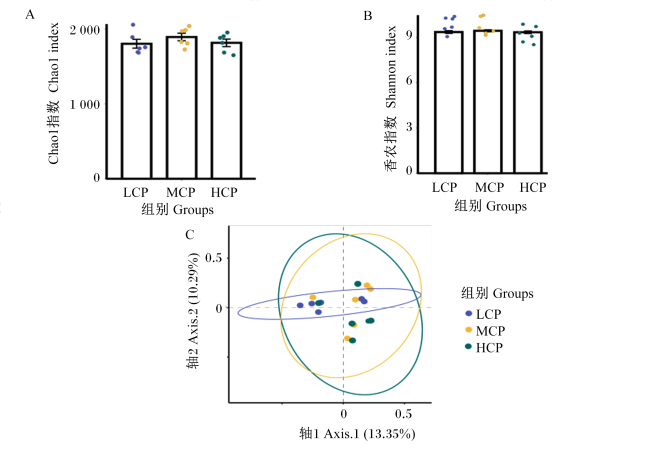
图1 饲粮蛋白质水平妊娠期秦川母牛瘤胃微生物多样性的影响数据柱标相同或无小写字母表示差异不显著(P>0.05),不同小写字母表示差异显著(P<0.05)。下图同。 Fig.1 Effects of dietary protein levels on rumen microbial diversity of Qinchuan cows during pregnancy Value columns with the same or no small letter mean no significant difference (P>0.05), while with different small letters mean significant difference (P<0.05). The same as below. |
2.4.2 微生物组成
表6 饲粮蛋白质水平对妊娠期秦川母牛瘤胃微生物相对丰度的影响Table 6 Effects of dietary protein level on rumen microbial relative abundance of Qinchuan cows during pregnancy |
| 项目 Items | 组别Groups | 标准误 SE | P值 P-value | ||
|---|---|---|---|---|---|
| LCP | MCP | HCP | |||
| 拟杆菌门Bacteroidota | 44.19 | 43.60 | 43.96 | 2.03 | 0.994 |
| 普雷沃氏菌属Prevotella | 19.55 | 15.99 | 17.53 | 1.28 | 0.554 |
| 理妍菌科RC9肠道群Rikenellaceae_RC9_gut_group | 5.95 | 6.34 | 7.11 | 0.57 | 0.721 |
| 普雷沃氏菌科UCG 003 Prevotellaceae_UCG_003 | 3.73 | 3.83 | 3.42 | 0.47 | 0.940 |
| 普雷沃氏菌科UCG 001 Prevotellaceae_UCG_001 | 2.97 | 2.80 | 2.63 | 0.17 | 0.733 |
| 厚壁菌门Firmicutes | 42.19 | 43.34 | 44.01 | 2.01 | 0.940 |
| 琥珀酸菌属Succiniclasticum | 4.31 | 4.34 | 5.12 | 0.32 | 0.527 |
| 瘤胃球菌属Ruminococcus | 2.75 | 3.12 | 3.44 | 0.46 | 0.848 |
| NK4A214群NK4A214_group | 2.07 | 2.40 | 3.12 | 0.27 | 0.277 |
| 糖酵菌属Saccharofermentans | 2.43 | 2.88 | 2.12 | 0.24 | 0.451 |
| 毛螺菌科XPB1014群Lachnospiraceae_XPB1014_group | 1.95 | 1.23 | 1.30 | 0.25 | 0.453 |
| 丁酸弧菌属Butyrivibrio | 1.39 | 0.89 | 0.96 | 0.14 | 0.278 |
| 毛螺菌科AC2044群Lachnospiraceae_AC2044_group | 1.13 | 1.10 | 0.80 | 0.09 | 0.305 |
| 变形菌门Proteobacteria | 5.12 | 3.77 | 3.06 | 0.78 | 0.579 |
| 琥珀酸菌科UCG_002 Succinivibrionaceae_UCG_002 | 2.47 | 1.68 | 0.97 | 0.74 | 0.737 |
| 髌骨菌门Patescibacteria | 2.98 | 2.44 | 3.50 | 0.22 | 0.147 |
| 假丝酵母菌属Candidatus_Saccharimonas | 1.89 | 1.48 | 2.10 | 0.16 | 0.304 |
| 疣微菌门Verrucomicrobiota | 1.57 | 2.07 | 1.68 | 0.20 | 0.594 |
| 螺旋体菌门Spirochaetota | 1.09 | 1.36 | 1.06 | 0.13 | 0.617 |
| 密螺旋体属Treponema | 0.94 | 1.07 | 0.86 | 0.13 | 0.797 |
| 蓝菌门Cyanobacteria | 0.74 | 0.51 | 0.78 | 0.13 | 0.652 |
| 纤维杆菌门Fibrobacterota | 0.30b | 1.11a | 0.36b | 0.11 | <0.001 |
| 纤维杆菌属Fibrobacter | 0.30b | 1.11a | 0.36b | 0.11 | <0.001 |
| 热脱硫杆菌门Desulfobacterota | 0.51 | 0.51 | 0.50 | 0.04 | 0.987 |
2.4.3 微生物标志物筛选
2.4.4 微生物功能预测
2.4.5 微生物共现网络分析
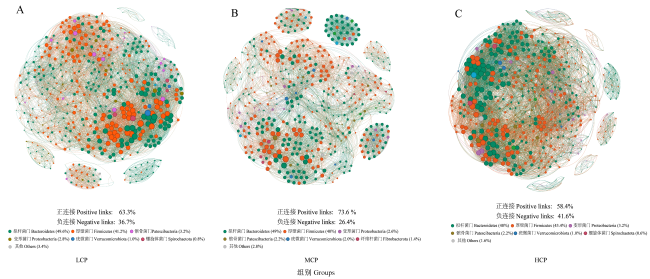


图4 各组妊娠期秦川母牛瘤胃微生物共现网络每个节点表示单个OTU,其大小与节点度呈正相关,颜色按门划分;边表示Spearman相关性(|r|>0.60和P<0.05)。 Fig.4 Rumen microbial co-occurrence network in all groups of Qinchuan cows during pregnancy Each node represents a single OTU, with the size positively correlated with the degree of the node, and the color coded by phylum; edges represent Spearman correlations (|r|>0.60 and P<0.05). |
表7 瘤胃微生物共现网络的拓扑结构分析Table 7 Topological structure analysis of rumen microbial co-occurrence network |
| 拓扑结构 Topological features | 组别Groups | ||
|---|---|---|---|
| LCP | MCP | HCP | |
| 边Edges | 8 458 | 6 508 | 8 213 |
| 网络直径Network diameter | 13.00 | 11.00 | 10.00 |
| 模块化Modularity | 0.57 | 0.70 | 0.54 |
| 聚类系数Clustering coefficient | 0.30 | 0.35 | 0.30 |
| 图密度Graph density | 0.03 | 0.03 | 0.03 |
| 平均度Average degree | 16.92 | 13.02 | 16.43 |
| 平均路径长度Average path length | 2.95 | 3.24 | 2.94 |