RESEARCH PAPER

Protein and Energy Requirements for Maintenance in Growing Male Sika Deer (Cervus nippon)

  • BAO Kun , 1, 2 ,
  • LIU Keyuan 1 ,
  • LI Guangyu , 1, *
Expand
  • 1 College of Animal Science and Technology, Qingdao Agricultural University, Qingdao 266109, China
  • 2 Institute of Special Wild Economic Animals and Plants, Chinese Academy of Agricultural Sciences, Changchun 130112, China
*professor, E-mail:

Received date: 2024-06-25

  Online published: 2025-02-16

Abstract

The objective of this study was to study the effects of feeding levels on energy metabolism, carbon and nitrogen balance and methane emission and to determine the maintenance requirements of energy and protein for male sika deer during their growing period. Sixteen 2-year-old male growing sika deer with similar body weight [(63.25±2.42) kg] were divided into 4 groups with 4 deer in each group. Feeding levels in each group were 100% (basal diet), 80%, 60% and 40% of the recommended dry matter standard, respectively. The experiment was divided into four phases, each lasting 12 days. In order to reduce the error of the test data due to the physical condition of the deer, after each stage, the deer only rested for 5 days and fed a basal diet. Carbon-nitrogen balance test, digestion metabolism test and energy balance test were carried out. The results showed that feeding levels had a significant impact on dry matter intake (P<0.05). Feeding level significantly affected the body weight of sika deer (P<0.05). The methane and carbon dioxide production of sika deer were significantly decreased with the decrease of feeding level (P<0.05). Fecal carbon, urinary carbon and deposited carbon were significantly affected by feeding level (P<0.05), and showed a decreasing trend. The apparent digestibility of nutrients was significantly increased with the decrease of feeding level (P<0.05). The deposited energy and caloric production were significantly decreased with the decrease of feeding level (P<0.05), and the deposited energy in the form of protein and the deposited energy in the form of fat were also significantly decreased (P<0.05). The daily nitrogen intake, fecal nitrogen, urinary nitrogen, deposited nitrogen and protein deposition were also significantly decreased with the decrease of feeding level (P<0.05), but the apparent digestibility of nitrogen was not significantly different under different feeding levels (P>0.05). The maintenance net energy (NEm) and maintenance metabolizable energy (MEm) values of male growing sika deer were estimated to be 223.62 and 251.17 kJ/(kg BW0.75·d), respectively according to the logarithmic regression between the heat production and metabolizable energy intake (MEI). The NNm and NPm values of 2-year-old male growing sika deer were estimated to be 251.8 mg/(kg BW0.75·d) and 1.57 g/(kg BW0.75·d), respectively based on the linear regression relationship between daily nitrogen intake and sedimentary nitrogen.

Cite this article

BAO Kun , LIU Keyuan , LI Guangyu . Protein and Energy Requirements for Maintenance in Growing Male Sika Deer (Cervus nippon)[J]. Chinese Journal of Animal Nutrition, 2025 , 37(2) : 1200 -1209 . DOI: 10.12418/CJAN2025.104

梅花鹿是中国东北地区饲养的重要经济动物品种。育成期是梅花鹿生长的关键时期,其生长的好坏直接影响后期鹿茸的产量。育成期梅花鹿营养需要的关键指标尚未完全确立,因此,研究梅花鹿营养需求对保证饲粮的有效利用、提高生产性能具有重要意义。
能量和蛋白质是梅花鹿需要的主要营养物质,其供给量直接影响鹿茸的产量和质量。为研究2岁雄性育成期梅花鹿的能量和蛋白质维持需求,本研究采用碳-氮平衡法,并通过开放回流式呼吸测热装置测量甲烷排放量。碳-氮平衡法用于计算沉积能量(RE),假设所有能量都以脂肪或蛋白质的形式沉积[1]。本试验通过探讨限制饲喂水平对能量代谢、碳-氮平衡和甲烷排放的影响,并使用碳-氮平衡法确定2岁雄性育成期梅花鹿的维持能量和蛋白质需求量,为我国梅花鹿营养标准制定提供基础数据,同时为梅花鹿饲粮精准配制提供充分的科学依据。

1 材料与方法

1.1 试验设计

本试验在中国农业科学院特产研究所茸鹿实验基地进行,试验日期为2020年5月1日至2020年7月10日。试验选择16头体重[(63.25±2.42) kg]相近的2岁雄性育成期梅花鹿,分为4组,每组4头鹿,饲喂水平分别为《鹿营养需要量》(GB/T 41190—2021)推荐量的100%(基础饲粮)、80%、60%和40%。试验分4个阶段进行,每个阶段持续12 d。为减少因鹿身体状况造成的测试数据误差,每个阶段结束后,鹿休息5 d,期间饲喂基础饲粮。鹿每天在06:30和15:30采食相同饲粮,自由饮水。所有试验程序和动物保护方案经过青岛农业大学动物科技学院实验动物伦理委员会的批准(批准号:QAU-DKY-20230702)。基础饲粮组成及营养水平如表1所示。
表1 基础饲粮组成及营养水平(风干基础)

Table 1 Composition and nutrient levels of the basal diet (air-dry basis) %

项目Items 含量Content
原料Ingredients
玉米粉Corn flour 22.0
豆粕Soybean meal 11.5
苜蓿草粉Alfalfa meal 50.0
干酒糟及其可溶物
Distillers dried grains with soluble
4.0
玉米胚芽饼Corn germ meal 5.5
糖蜜Molasses 5.0
氯化钠NaCl 0.5
共轭亚油酸Conjugated linoleic acid 0.5
预混料Premix1) 1.0
合计Total 100.0
营养水平Nutrient levels2)
总能GE/(MJ/kg) 13.92
有机物OM 82.50
粗蛋白质CP 16.12
粗脂肪EE 2.97
中性洗涤纤维NDF 42.03
酸性洗涤纤维ADF 17.22
钙Ca 0.80
磷P 0.52

1) 每千克预混料含有 Per kg premix contained the following: Mg 76 mg, Cu 36 mg,Zn 43 mg,Fe 53 mg,VA 2 484 IU,VD3 496.8 IU,VK3 0.23 mg,VB1 10.092 mg,VB2 0.69 mg,VB12 1.38 mg,叶酸 folic acid 0.023 mg,烟酸 nicotinic acid 1.62 mg,泛酸钙 calcium pantothenate 1.15 mg,磷酸氢钙 calcium hydrogen phosphate 5.17 g,碳酸钙 calcium carbonate 4.57 g。

2) 营养水平均为测定值。Nutrient levels were all measured values.

1.2 消化代谢试验

通过消化代谢试验测定营养成分的表观消化率。在试验开始和结束时分别对鹿只称重。每天收集剩余饲粮和粪便并称重。连续3 d每天收集粪便,在-20 ℃下储存,然后在化学分析前再次混合并取样,并在65 ℃下干燥。尿液收集在含有20 mL 10%浓硫酸的桶中,以减少尿液中的氮损失。对收集的所有尿液进行称重,并抽取每日尿量的3%进行分析。

1.3 气体代谢试验

本研究使用了4个体积为17.82 m3(450 cm×180 cm×220 cm)的开放回流式呼吸测热装置。该呼吸测热室专门为梅花鹿设计。空调和加热器用于调节呼吸室,以保持恒定的温度和湿度。使用真空泵从呼吸室连续抽取气体。使用分析仪每隔3 min测量每个呼吸室内的气体浓度。使用氧化锆传感器测量氧气(O2)浓度,使用分析仪中的非色散红外传感器测量二氧化碳(CO2)和甲烷(CH4)浓度。
根据Tovar-Luna等[2]提出的方法分析测量CH4、CO2和O2的浓度。首先分析空气中的CH4,然后分析CO2和O2。每次试验前,使用标准气体混合物(19.5%和20.5% O2、0和1.5% CO2以及0和0.3% CH4)校准分析仪。热量测定室的温度保持在20~23 ℃,相对湿度保持在50%~55%。
采用4×4拉丁方设计,选择4头梅花鹿,单笼饲养。经过24 h适应期后,连续24 h测量个体的CH4和CO2产量。为避免鹿在代谢笼中出现应激反应,所用的鹿只都接受过人工驯化。为了减少因鹿的身体状况造成的测试数据误差,每个时期结束后,给予5 d的间歇时间,在每个阶段后饲喂基础饲粮,使其恢复体况。

1.4 化学分析

采用GB/T 6435—2014的方法测定干物质含量;采用GB/T 6438—2007的方法测定粗灰分含量;采用GB/T 6436—2018的方法测定钙含量;采用GB/T 6437—2018 的方法测定磷含量;采用GB/T 6432—2018的方法测定粗蛋白质含量;采用GB/T 6433—2006的方法测定粗脂肪含量。有机物(OM,%)=100-绝干水分-粗灰分。中性洗涤纤维(NDF)和酸性洗涤纤维(ADF)的含量根据Van Soest等[3]所述的方法测定。氧弹量热仪(IKA C2000,德国)测量饲粮和粪中的总能(GE)。根据钟伟[4]所述的方法测量尿能(UE),采用滤纸法,取直径为9 cm的定量滤纸10张,每2张共同折叠称重,计算5组滤纸的平均能值,然后将折叠的2张滤纸置于坩埚内,吸取8 mL过滤后的尿样分次滴加在滤纸上,于65 ℃烘干后测定UE。使用碳-氮分析仪(Vario MAX CN,德国)估算饲粮、剩料、粪便和尿液中的碳和氮含量。
营养物质表观消化率的计算公式如下:
营养物质表观消化率(%)=[(摄入的营养物质含量-粪便中的营养物质含量)/摄入的营养物质含量]×100。

1.5 数据计算

1.5.1 代谢能(ME)

根据消化试验获得的数据计算饲粮中的ME。总能摄入量(GEI)和粪能(FE)之间的差为消化能(DE)。通过从DE中减去CH4中的能量和UE,获得了4种饲喂水平下梅花鹿的ME。CH4的能量当量为39.54 kJ/L[5]

1.5.2 碳-氮平衡

在碳-氮平衡法中,假设所有能量都以脂肪或蛋白质的形式沉积[6],RE根据碳-氮平衡法分析确定。碳平衡是保留在体内的碳总量,脂肪中保留的碳量可以通过从碳平衡中减去由氮平衡确定的蛋白质中保留的碳量来计算。假设脂肪的能量当量为39.76 kJ/g,蛋白质的能量当量为23.86 kJ/g,则可计算RE中以蛋白质沉积的能量(REp)和以脂肪沉积的能量(REf),计算公式如下:
REp=氮平衡(g)×6.25×23.86;
REf=[碳平衡(g)-氮平衡(g)×6.25×0.52]×1.304×39.76[1]
根据Brouwer[7]推荐的方法,RE=REp+REf。

1.5.3 维持所需要的能量和蛋白质

代谢能摄入量(MEI)和RE之间的差异为产热量(HP)。根据Lofgreen等[8]描述的方法,使用HP和MEI对数之间线性回归截距的反对数来估计雄性梅花鹿的维持净能(NEm,kJ/kg BW0.75)。根据Galvani等[9]提出的方法,通过迭代半对数线性回归方程,直到HP等于MEI,计算维持代谢能(MEm,kJ/kg BW0.75)。ME的维持代谢效率(Km)=(NEm/MEm)×100。
通过每日沉积氮(RN,mg/kg BW0.75)和每日氮摄入量(NI,g/kg BW0.75)之间的线性回归方程,估算维持净氮需求(NNm,mg/kg BW0.75)。该回归方程的截距表示内源性和代谢氮的损失。将损失乘以因子6.25的结果被假定为维持净蛋白质需求(NPm,g/kg BW0.75)。

1.6 统计分析

数据以平均值±标准差表示。使用SAS 8.0统计软件进行单因素方差分析,用Duncan氏法进行多重比较,P<0.05为差异显著。

2 结果

2.1 干物质采食量(DMI)和能量平衡

饲喂水平对梅花鹿体重、DMI和能量平衡的影响如表2所示。不同饲喂水平对DMI有显著影响(P<0.05)。饲喂水平显著影响梅花鹿的体重(P<0.05),随着饲喂水平的降低,体重显著下降。随着饲喂水平的降低,GEI、FE、UE、DE、ME和甲烷能显著降低(P<0.05),而DE/GE、甲烷能/GE显著增加(P<0.05)。当鹿采食不同水平的饲粮时,ME/GE和ME/DE之间没有显著差异(P>0.05)。
表2 饲喂水平对育成期梅花鹿体重、干物质采食量及能量平衡的影响

Table 2 Effects of feeding levels on body weight, dry matter intake and energy balance in growing sika deer

项目
Items
饲喂水平Feeding levels/% P
P-value
100 80 60 40
干物质采食量DMI/(kg/d) 1.90±0.12a 1.72±0.25b 1.14±0.13c 0.76±0.06d <0.001
体重BW/kg 64.26±3.87a 62.15±4.36b 59.83±3.83c 56.43±4.17d <0.001
总能摄入量
GEI/[kJ/(kg BW0.75·d)]
1 174.51±109.56a 1 080.20±103.21b 743.48±78.31c 517.89±57.62d <0.001
粪能FE/[kJ/(kg BW0.75·d)] 385.24±15.87a 339.32±21.56b 206.09±20.31c 118.79±12.57d <0.001
尿能UE/[kJ/(kg BW0.75·d)] 36.40±3.51a 34.01±2.87b 23.35±3.56c 16.87±2.91d <0.001
甲烷能
Methane energy/[kJ/(kg BW0.75·d)]
76.34±7.31a 73.04±8.52a 55.91±7.63b 43.01±5.45c 0.035
甲烷能/总能
Methane energy/GE/%
6.48±1.13c 6.69±0.89c 7.52±1.25b 8.32±1.37a 0.031
消化能DE/[kJ/(kg BW0.75·d)] 769.27±20.51a 745.88±25.87a 537.39±24.01b 399.10±18.75c <0.001
代谢能摄入量
MEI/[kJ/(kg BW0.75·d)]
752.87±35.05a 686.87±28.67a 434.04±20.55b 286.23±18.96c <0.001
消化能/总能DE/GE/% 65.50±7.82c 68.98±8.31c 72.27±7.69b 77.18±7.53a 0.023
代谢能/总能ME/GE/% 64.10±6.55 65.46±7.69 69.18±5.81 74.27±7.13 0.450
代谢能/消化能ME/DE/% 95.38±9.66 95.29±8.75 94.89±8.94 94.44±9.02 0.532

同行数据肩标不同小写字母表示差异显著(P<0.05)。下表同。

In the same row, values with different small letter superscripts mean significant difference (P<0.05). The same as below.

2.2 CH4和CO2排放量

饲喂水平对CH4和CO2排放量的影响如表3所示。饲喂水平对CH4排放量影响显著,育成期梅花鹿CH4日排放量和每千克代谢体重CH4日排放量随着饲喂水平的降低而减少(P<0.05)。每千克干物质采食量CH4排放量呈相反趋势(P<0.05)。
表3 饲喂水平对育成期梅花鹿甲烷和二氧化碳排放量的影响

Table 3 Effects of feeding levels on CH4 and CO2 emissions in growing sika deer

项目
Items
饲喂水平Feeding levels/% P
P-value
100 80 60 40
CH4排放量CH4 production
CH4日排放量Daily CH4
emission/(L/d)
61.26±6.13a 50.15±6.03b 41.82±3.97c 30.53±3.66d 0.012
每千克代谢体重CH4日排放量
Daily CH4 emission per kilogram of
metabolic body weight/
[L/(kg BW0.75·d)]
2.70±0.38a 2.27±0.42a 1.89±0.35b 1.77±0.31c 0.021
每千克干物质采食量CH4排放量
CH4 emission per kg of dry matter
intake/(L/kg DMI)
29.24±3.59c 31.16±3.15c 35.81±3.52b 48.07±5.03a 0.035
CO2排放量CO2 production
CO2日排放量Daily CO2 emission/(L/d)
610.50±50.21a 530.25±48.33b 480.36±36.53c 389.55±36.21d <0.001
每千克代谢体重CO2日排放量
Daily CO2 emission per kilogram of
metabolic body weight/
[L/(kg BW0.75·d)]
26.92±3.27a 23.94±2.46b 22.33±2.08b 18.93±1.88c 0.038
每千克干物质采食量CO2排放量
CO2 emission per kg of dry
matter intake/(L/kg DMI)
308.32±29.56d 321.28±28.57c 430.06±35.41b 512.57±49.32a <0.001
同时,饲喂水平对CO2排放量也有显著影响,随着饲喂水平的降低,CO2日排放量和每千克代谢体重CO2日排放量显著减少(P<0.05)。然而,每千克干物质采食量CO2排放量呈相反趋势(P<0.05)。

2.3 产热和碳-氮平衡

表4显示了饲喂水平对每日碳-氮平衡、能量沉积和产热量的影响,粪碳、尿液碳和沉积碳受饲喂水平的显著影响(P<0.05)呈下降趋势。二氧化碳中的碳(CO2-C)和甲烷中的碳(CH4-C)含量随饲喂水平的降低而显著降低(P<0.05),但各组间碳表观消化率(可消化碳)差异不显著(P>0.05)。
表4 饲喂水平对育成期梅花鹿碳-氮平衡、产热量和能量沉积的影响

Table 4 Effects of feeding levels on C-N balances, HP and RE in growing sika deer

项目
Items
饲喂水平Feeding levels/% P
P-value
100 80 60 40
碳平衡C balance/[g/(kg BW0.75·d)]
碳摄入CI 50.52±6.03a 42.69±4.31b 35.21±5.38c 24.75±3.51d <0.001
粪碳FC 24.22±3.56a 19.51±2.43b 14.34±2.65c 9.13±2.41d 0.011
尿碳UC 1.82±0.09a 1.53±0.21b 1.21±0.18c 0.96±0.25d 0.013
二氧化碳中的碳CO2-C 14.67±2.56a 13.05±1.08ab 12.17±2.56b 10.32±2.37c 0.032
甲烷中的碳CH4-C 1.56±0.23a 1.31±0.32ab 1.09±0.33b 1.02±0.19c 0.021
沉积碳RC 8.25±0.35a 7.27±0.56ab 4.40±0.57b 2.32±0.27c 0.026
碳表观消化率
Carbon apparent digestibility/%
52.06±4.82 54.30±4.32 59.27±6.03 63.11±7.38 0.223
氮平衡N balance/[g/(kg BW0.75·d)]
摄入氮NI 2.12±0.35a 1.96±0.26b 1.34±0.31c 0.93±0.17d 0.018
粪氮FN 1.10±0.12a 0.98±0.10b 0.54±0.11c 0.32±0.05d 0.022
尿氮UN 0.63±0.11a 0.61±0.09ab 0.41±0.08b 0.30±0.04c 0.017
沉积氮RN 0.38±0.08a 0.30±0.04ab 0.24±0.05b 0.20±0.02c 0.020
氮表观消化率
Nitrogen apparent digestibility/%
48.04±4.13 50.10±4.87 59.70±5.61 65.72±5.88 0.235
蛋白质沉积
Retention protein/
[g/(kg BW0.75·d)]
2.38±0.21a 1.88±0.36b 1.50±0.32c 1.25±0.22d 0.031
以蛋白质形式沉积能量
REp/[kJ/(kg BW0.75·d)]
56.66±4.87a 44.74±3.96b 35.79±3.96c 32.81±4.57d 0.043
以脂肪形式沉积能量
REf/[kJ/(kg BW0.75·d)]
363.71±30.52a 326.38±29.56b 187.69±25.31c 83.21±9.34d 0.012
沉积能量
RE/[kJ/(kg BW0.75·d)]
420.31±40.31a 371.08±32.31b 223.48±30.67c 116.02±13.52d 0.018
产热量
HP/[kJ/(kg BW0.75·d)]
332.50±27.86a 315.76±28.78ab 210.56±25.36b 170.21±19.34c 0.013
RE和HP随着饲喂水平的减少而显著降低(P<0.05),与能量沉积相关的REp和REf亦显著降低(P<0.05)。NI、FN、UN、RN和蛋白质沉积也随着饲喂水平的降低而显著降低(P<0.05),但氮表观消化率在不同的饲喂水平间差异不显著(P>0.05)。

2.4 营养物质表观消化率

表5显示了饲喂水平对DM、OM、ADF和NDF表观消化率的影响。随着饲喂水平的降低,DM、OM、ADF和NDF表观消化率显著提高(P<0.05)。
表5 饲喂水平对育成期梅花鹿营养物质表观消化率的影响

Table 5 Effects of feeding levels on nutrients apparent digestibility in growing sika deer

项目
Items
饲喂水平Feeding levels/% P
P-value
100 80 60 40
干物质DM/[g/(kg BW0.75·d)]
摄入量Intake 83.74±9.78a 77.69±8.46b 53.00±6.21c 36.93±3.58d <0.001
粪中含量Content in feces 41.69±5.65a 35.88±4.52ab 22.46±3.51b 14.75±2.42c <0.001
干物质表观消化率
DM apparent digestibility/%
50.21±6.03c 53.82±6.37bc 57.63±6.84b 60.05±6.82a 0.035
有机物OM/[g/(kg BW0.75·d)]
摄入量Intake 71.18±3.16a 66.03±2.57a 45.05±2.36b 31.39±4.21c 0.038
粪中含量Content in feces 33.54±2.88a 30.17±3.12a 18.19±2.55b 12.11±1.97c 0.042
有机物表观消化率
OM apparent digestibility/%
52.88±4.13c 55.31±4.25c 59.63±5.17b 61.4±6.06a 0.022
酸性洗涤纤维ADF/[g/(kg BW0.75·d)]
摄入量Intake 13.53±2.58a 12.55±2.41a 8.56±1.34b 5.97±1.06c <0.001
粪中含量Content in feces 9.45±2.41a 8.46±1.85b 5.52±1.10c 3.58±0.96d <0.001
酸性洗涤纤维表观消化率
ADF apparent digestibility/%
30.12±5.61c 32.56±4.23b 35.43±4.36ab 40.05±4.31a 0.033
中性洗涤纤维NDF/[g/(kg BW0.75·d)]
摄入量Intake 34.78±2.56a 32.27±3.52ab 22.02±3.15b 15.34±2.06c <0.001
粪中含量Content in feces 24.51±3.87a 21.55±2.69b 13.89±2.06c 8.99±1.87d <0.001
中性洗涤纤维表观消化率
NDF apparent digestibility/%
29.53±2.45c 33.21±4.57b 36.91±4.05ab 41.37±5.04a 0.021

2.5 维持所需的能量和净蛋白质

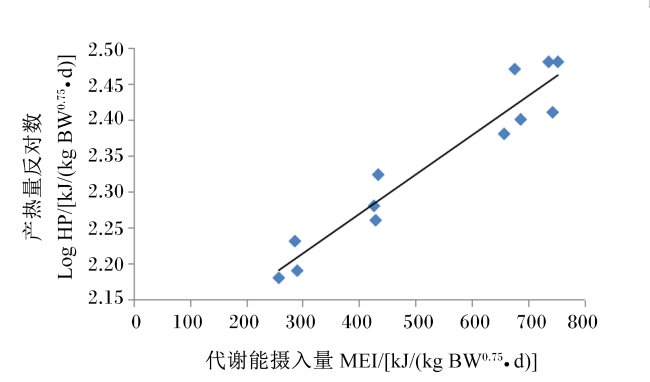
MEm、NEm和NEm/MEm(Km)的估计值如表6所示, LogHP和MEI之间的线性关系如图1所示。通过计算回归截距的反对数,确定雄性梅花鹿的NEm值为223.62 kJ/(kg BW0.75·d),通过迭代MEI上对数HP之间的回归方程,当HP等于MEI时,计算出MEm值为251.17 kJ/(kg BW0.75·d)。同时,计算出Km(NEm/MEm)值为0.89。
表6 估算育成期梅花鹿产热量、代谢能摄入量的方程预测净能维持需要

Table 6 Estimates of heat production and metabolisable energy intake in the equation to predict net energy requirement for maintenance in growing sika deer

体重
BW/kg
回归方程
Regression
equation
均方根
误差
RMSE
回归
系数
R2
鹿个体
Number of
deer
P
P-value
维持净能
NEm/
[kJ/(kg
BW0.75·d)]
维持
代谢能
MEm/
[kJ/(kg
BW0.75·d)]
维持利
用效率
Km
56.43~
64.26
LogHP=2.349 5(±0.021 2)+
0.000 5(±0.000 2) ×
MEI
0.083 1 0.924 6 12 <0.001 223.62 251.17 0.89

HP: 产热量 heat production; MEI:代谢能摄入量 metabolic energy intake。

图1 育成期梅花鹿LogHP与MEI的回归关系

Fig.1 Relationship between logarithm of heat production and metabolizable energy intake in growing sika deer

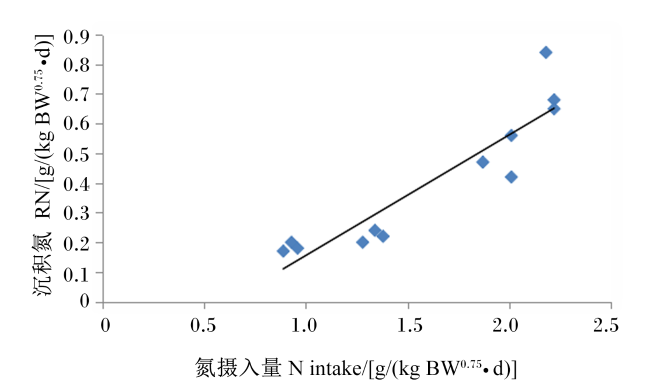
RN和NI之间的线性关系如表7图2所示。通过估算沉积氮对氮摄入量的线性回归截距,计算出维持净氮需求为251.8 mg/(kg BW0.75·d)。雄性育成期梅花鹿的NPm值为1.57 g/(kg BW0.75·d)。
表7 估算育成期梅花鹿留存氮和摄入氮之间的方程预测维持净蛋白质需求

Table 7 Estimates of retained N and N intake in the equation to predict net protein requirement for maintenance in growing sika deer

体重
BW/kg
回归方程
Regression equation
均方根误差
RMSE
回归系数
R2
鹿个体数
Number
of deer
P
P-value
维持净
氮需求
NNm/
[mg/(kg
BW0.75·d)]
维持净蛋
白质需求
NPm/[g/(kg
BW0.75·d)]
56.43~
64.26
RN=-0.251 8(±0.135 2)+
0.407(±0.052 4)×NI
0.123 5 0.847 9 12 <0.001 251.8 1.57

RN: 存留氮 retained N; NI: 摄入氮 N intake 。

图2 育成梅花鹿氮摄入量与沉积氮的回归关系

Fig.2 Relationship between retained nitrogen and nitrogen intake in growing sika deer

3 讨论

3.1 能量平衡和碳-氮平衡

CH4排放率是用于评估全球变暖潜在程度和估算肠道CH4排放量的关键因素。研究结果表明,雄性梅花鹿在育成期间,CH4排放率(甲烷能/GE)随着饲喂水平的降低而增加。这说明在维持期增加饲喂水平可以减少肠道CH4排放,这对反刍动物来说是一种重要的生理现象[10]。在本研究中,雄性梅花鹿的ME/DE为95.01%,高于羔羊[10]、肉鸡[11]和绵羊[12]。这可能与不同的饲粮成分和物种间差异有关。
Ferrell等[13]的研究报道,与饲喂水平的差异相比,怀孕导致的小母牛能量消化率的任何差异都是微不足道的。雄性育成期梅花鹿当前研究数据表明,甲烷能、UE、FE和DE随着饲喂水平的增加而增加,本研究的结果与上述报道结果一致。
Kishan等[14]研究认为,对于雄性水牛和杂交牛,能量水平影响尿液中碳和氮的排泄,尿液中碳与DE摄入量显著相关,但尿液、CO2和CH4的碳排放没有受到影响。氮排泄量和尿碳含量之间也存在相关性,与本研究结果一致。此外,本研究结果表明,碳表观消化率为52%~63%,与Blaxter等[15]研究结果一致。本研究中使用碳-氮平衡法计算的RC和RN之间存在一定差异。在本研究中,RN和RE随着饲喂水平的降低而降低,这与Singh等[16]、George等[17]、Zhang等[12]的研究结果一致。
能量摄入会影响HP。随着生长中牛的MEI增加,HP呈指数增长[18-19]。对生长中牛的能量代谢分析表明,随着MEI水平的增加,HP呈指数增长[20]。同样,妊娠期HP也会显著增加。在本研究中,MEI和HP逐渐降低,同时饲喂水平降低,可能是由于摄食减少的热效应所致。同时,ME摄入量减少,导致HP下降。这与Zhang等[21]报道的生长肥育猪的研究结果一致。
本研究中,REp值远低于REf值。当梅花鹿以40%的饲喂水平喂养时,REp和REf均达到其最小值。这些结果与在湖羊[12]上的研究结果一致。在本研究中,雄性梅花鹿饲喂水平的减少导致NI、FN和UN的减少。随着饲喂水平的减少,RN从0.38 g/(kg BW0.75·d)逐渐下降到0.20 g/(kg BW0.75·d)。与Singh等[16]的研究结果一致。

3.2 营养物质表观消化率

在本研究中,随着饲喂水平的减少,碳、氮、DM、OM、ADF和NDF表观消化率显著增加,表明限制饲粮采食可以提高营养物质的消化率和利用率。当饲喂水平减少时,机体会调节营养物质的消化和利用,以满足自身的维持需求。Deng等[22]研究发现,自由采食的羔羊的表观能量消化率(DE/GE)和代谢率(ME/GE)低于限制饲喂的羔羊。本研究对雄性梅花鹿的研究结果与上述研究结果一致。

3.3 维持所需的能量和蛋白质

在畜牧生产中通常采用限饲作为一种饲养管理和营养调控手段,用以提高饲料的转化效率,促进动物生长性能的发挥。限饲有2种方式,一种是数量限饲,即在营养平衡的饲粮上进行数量上的限饲;另一种是质量限饲,即对营养不平衡的饲粮在营养水平上的限饲。本研究采用第1种即数量限饲方式。近几年来,较多试验报道采取数量限饲来研究不同动物对于营养物质的需要量。MEI和HP之间的对数关系通常用于计算NEm。在MEI为0时的情况下,HP等于NEm[18]。当MEI和HP相等时,来计算MEm。由回归方程计算的NEm和MEm值分别为223.62和251.17 kJ/(kg BW0.75·d)。在本研究中,Km值为0.89。李忠宽等[23]研究了成年雄性梅花鹿的能量代谢,确定成年梅花鹿的MEm需求量为516 kJ/(kg BW0.75·d)。这一结果比本研究的结果要大。原因可能是试验所选鹿年龄不同以及不同时期的生理状态差异。成年梅花鹿需要更多的能量来维持它们的自身需要和鹿茸的生长。相比之下,对于处于育成期的鹿来说,更多的能量用于自身身体的发育和生长,因此计算出的MEm较少。本研究中的Km值高于李忠宽等[23]报道的成年鹿Km值(0.707),这主要与所选鹿的年龄有关。Luo等[24]报道认为,MEm的差异主要取决于NEm的变化,而不是Km的变化。NEm和MEm的值因物种而异,对于物种、生理阶段、环境温度和饲粮成分也会影响NEm和MEm的值[11]。在本研究中,试验动物雄性梅花鹿体重为56.43~64.26 kg,呼吸室内温度为22 ℃。这些可能是NEm和MEm值与以前报道中不同的主要原因。
对于羔羊和绵羊,RN和每日NI之间的回归方程是通过氮平衡试验获得NPm的有效方法[16,25]。回归方程的截距表示内源和代谢氮损失。根据梅花鹿育成期日均NI和RN之间的回归方程,估计NNm和NPm值分别为251.8 mg/(kg BW0.75·d)和2.045 g/(kg BW0.75·d)。Costa等[19]报道认为,使用比较屠宰法根据RN和每日NI之间的关系估计的NPm大于使用氮平衡法根据RN和每日NI之间的关系确定的NPm。这种差异可能是由于氮平衡法未考虑的氮损失造成的。氮平衡试验可以减少动物伤害,满足动物福利要求,是估算净蛋白质需要量的重要方法。

4 结论

根据HP和MEI之间的对数回归,2岁雄性育成期梅花鹿的NEm和MEm值分别估算为223.62和251.17 kJ/(kg BW0.75·d)。基于NI与RN的线性回归关系,估算出育成期雄性梅花鹿的NNm和NPm值估计为251.8 mg/(kg BW0.75·d)和1.57 g/(kg BW0.75·d)。
[1]
FERNÁNDEZ C, LÓPEZ M C, LACHICA M. Heat production determined by the RQ and CN methods,fasting heat production and effect of the energy intake on substrates oxidation of indigenous Manchega sheep[J]. Animal Feed Science and Technology, 2012, 178(1/2):115-119.

[2]
TOVAR-LUNA I, GOETSCH A L, PUCHALA R, et al. Effects of moderate feed restriction on energy expenditure by 2-year-old crossbred Boer goats[J]. Small Ruminant Research, 2007, 72(1):25-32.

[3]
VAN SOEST P J, ROBERTSON J B, LEWIS B A. Methods for dietary fiber,neutral detergent fiber,and nonstarch polysaccharides in relation to animal nutrition[J]. Journal of Dairy Science, 1991, 74(10):3583-3597.

[4]
钟伟. 育成期北极狐净能需要量与能量代谢规律研究[D]. 博士学位论文. 北京: 中国农业科学院, 2020.

ZHONG W. Study on the net energy requirement and regularity of energy metabolism in arctic fox (Alopex lagopus) during the growing-furring period[D]. Ph.D.Thesis. Beijing: Chinese Academy of Agricultural Sciences, 2020. (in Chinese)

[5]
BROUWER E. Report of sub-committee on constants and factors[C]// Proceedings of the 3rd Symposium on Energy Metabolism. Utah: Academic Press, 1965:441-443.

[6]
LÓPEZ M C, FERNÁNDEZ C. Changes in heat production by sheep of Guirra breed after increase in quantity of barley grain on the diet[J]. Small Ruminant Research, 2013, 109(2/3):113-118.

[7]
BROUWER E. Report of sub-committee on constants and factors[R]. London, UK: Academic Press, 1965:441-443.

[8]
LOFGREEN G P, GARRETT W N. A system for expressing net energy requirements and feed values for growing and finishing beef cattle[J]. Journal of Animal Science, 1968, 27(3):793-806.

[9]
GALVANI D B, PIRES C C, KOZLOSKI G V, et al. Energy requirements of texel crossbred lambs[J]. Journal of Animal Science, 2008, 86(12):3480-3490.

DOI PMID

[10]
CHAOKAUR A, NISHIDA T, PHAOWPHAISAL I, et al. Effects of feeding level on methane emissions and energy utilization of Brahman cattle in the tropics[J]. Agriculture,Ecosystems & Environment, 2015, 199:225-230.

[11]
LIU W, LIN C H, WU Z K, et al. Estimation of the net energy requirement for maintenance in broilers[J]. Asian-Australasian Journal of Animal Sciences, 2017, 30(6):849-856.

DOI PMID

[12]
ZHANG H, SUN L W, WANG Z Y, et al. Energy and protein requirements for maintenance of Hu sheep during pregnancy[J]. Journal of Integrative Agriculture, 2018, 17(1):173-183.

[13]
FERRELL C L, GARRETT W N, HINMAN N, et al. Energy utilization by pregnant and non-pregnant heifers[J]. Journal of Animal Science, 1976, 42(4):937-950.

PMID

[14]
KISHAN J, KHAN M Y, LAL M. Influence of dietary energy levels on urinary nitrogen and carbon excretion in buffaloes[J]. Indian Journal of Animal Nutrition, 1987, 3(3):197-200.

[15]
BLAXTER K L, WAINMAN F W. The utilization of the energy of different rations by sheep and cattle for maintenance and for fattening[J]. The Journal of Agricultural Science, 1964, 63(1):113-128.

[16]
SINGH P, VERMA A K, SAHU D S, et al. Utilization of nutrients as influenced by different restriction levels of feed intake under sub-tropical conditions in crossbred calves[J]. Livestock Science, 2008, 117(2/3):308-314.

[17]
GEORGE S K, DIPU M T, MEHRA U R, et al. Growth of crossbred bulls affected by level of feed intake[J]. Indian Journal of Animal Nutrition, 2005, 22(2):81-84.

[18]
CHIZZOTTI M L, VALADARES FILHO S C, TEDESCHI L O, et al. Energy and protein requirements for growth and maintenance of F-1 Nellore×Red Angus bulls,steers,and heifers[J]. Journal of Animal Science, 2007, 85(8):1971-1981.

[19]
COSTA M R G F, PEREIRA E S, SILVA A M A, et al. Body composition and net energy and protein requirements of morada nova lambs[J]. Small Ruminant Research, 2013, 114(2/3):206-213.

[20]
CHIZZOTTI M L, TEDESCHI L O, VALADARES FILHO S C. A Meta-analysis of energy and protein requirements for maintenance and growth of nellore cattle[J]. Journal of Animal Science, 2008, 86(7):1588-1597.

DOI PMID

[21]
ZHANG G F, LIU D W, WANG F L, et al. Estimation of the net energy requirements for maintenance in growing and finishing pigs[J]. Journal of Animal Science, 2014, 92(7):2987-2995.

DOI PMID

[22]
DENG K D, DIAO Q Y, JIANG C G, et al. Energy requirements for maintenance and growth of Dorper crossbred ram lambs[J]. Livestock Science, 2012, 150(1/2/3):102-110.

[23]
李忠宽, 高秀华, 张晓明, 等. 成年梅花公鹿能量代谢研究[J]. 特产研究, 1997(1):1-4.

LI Z K, GAO X H, ZHANG X M, et al. A study on enecy metabolism of adult male sika deer[J]. Special Wild Economic Animal and Plant Research, 1997(1):1-4. (in Chinese)

[24]
LUO J, GOETSCH A L, NSAHLAI I V, et al. Maintenance energy requirements of goats:predictions based on observations of heat and recovered energy[J]. Small Ruminant Research, 2004, 53(3):221-230.

[25]
LOU C, SI B W, DENG K D, et al. Energy requirements of Dorper×Thin-Tailed Han crossbred ewes during non-pregnancy and lactation[J]. Journal of Integrative Agriculture, 2015, 14(12):2605-2617.

DOI

Outlines

/