RESEARCH PAPER

Effects of Dietary Net Energy Levels on Growth Performance, Carcass Quality, Intestinal Morphology, Microbial Community and Liver Metabolism of Finishing Pigs

  • JIANG Jingya ,
  • WU Dengke ,
  • REN Gehan ,
  • LIU Ning ,
  • LIU Xinglin ,
  • WANG Yue ,
  • LANG Yujie ,
  • CHU Guiyan ,
  • CAI Chuanjiang , *
Expand
  • College of Animal Science and Technology, Northwest A&F University, Yangling 712100, China
*associate professor, E-mail:

Received date: 2024-08-28

  Online published: 2025-03-13

Abstract

This experiment was conducted to investigate the effects of different dietary net energy levels on growth performance, carcass quality, intestinal morphology, microbial community and liver metabolism of finishing pigs. A total of 84 healthy Duroc×Landrace×Yorkshire crossbred finishing pigs with an average body weight of (53.69±5.99) kg were randomly divided into high-net energy (HNE) group (10.36 MJ/kg), medium-net energy (MNE) group (9.90 MJ/kg), and low-net energy (LNE) group (9.44 MJ/kg), respectively. Each treatment group had 7 replicates of 4 pigs per replicate. The experiment lasted for 63 days, which were divided into three phases as days 1 to 21, days 22 to 42 and days 43 to 63. The results showed as follows: 1) there were no significant differences in growth performance, carcass quality and intestinal morphology among the three groups (P>0.05). 2) There were no significant differences in ACE, Chao1, Simpson and Shannon indices between the three groups (P>0.05). The linear discriminant analysis effect size (LEfSe) analysis showed that the relative abundance of Lachnospiraceae_UCG_010 and Megamonas was significantly increased in colonic microbial community of MNE group compared with HNE group and LNE group (P<0.05); the relative abundance of Coprococcus was significantly increased in cecal microbial community of MNE group (P<0.05). The relative abundance of Lachnospira, Prevotella_7, Coprococcus and Eubacterium_eligens_group significantly increased in colonic microbial community of LNE group compared with HNE group and LNE group (P<0.05), while the relative abundance of Oscillospira, Colidextribacter and Alphaproteobacteria in cecal microbial community significantly increased (P<0.05). Compared with HNE group, 482 and 849 metabolites were up-regulated (VIP>1 and P<0.05), while 585 and 938 metabolites were down-regulated (VIP>1 and P<0.05) in MNE group and LNE group, respectively. Compared with the HNE group, the MNE and LNE groups had significantly increased metabolites associated with lipids and lipid-like molecules (P<0.05). Meanwhile, some important energy metabolism related metabolic pathways were changed in the MNE or LNE groups (P<0.05), such as oxidative phosphorylation, inositol phosphate metabolism, pantothenate and CoA biosynthesis, amino sugar and nucleotide sugar metabolism, and propanoate metabolism. 4) The results of Spearman correlation analysis showed that the relative abundance of Megamonas and Coprococcus were positively correlated with 3-hydroxykynurenine content, the intermediate product of tryptophan metabolism in MNE group (P<0.05); the relative abundance of Prevotella_7 and Coprococcus were positively correlated with 3-hydroxykynurenine, the intermediate product of tryptophan metabolism in LNE group (P<0.05). In conclusion, in the range of dietary net energy level (9.44 to 10.36 MJ/kg) in this experiment, reducing net energy level of diet don’t affect the growth performance, carcass quality and intestinal morphology of finishing pigs, but increase energy utilization efficiency.

Cite this article

JIANG Jingya , WU Dengke , REN Gehan , LIU Ning , LIU Xinglin , WANG Yue , LANG Yujie , CHU Guiyan , CAI Chuanjiang . Effects of Dietary Net Energy Levels on Growth Performance, Carcass Quality, Intestinal Morphology, Microbial Community and Liver Metabolism of Finishing Pigs[J]. Chinese Journal of Animal Nutrition, 2025 , 37(3) : 1645 -1659 . DOI: 10.12418/CJAN2025.140

在畜牧业中,给动物提供充足的营养是实现高效和盈利生产的重要条件。营养供应不足可能会限制动物生产和潜在生长,而营养过剩可能会加剧环境污染并降低经济效益[1-3]。我国是世界上最大的猪肉生产国,养猪业和大量的饲料需求给我国带来了巨大的环境压力[4]。目前,猪的饲料主要由能量饲料(玉米、小麦和大麦等)和蛋白质饲料(豆粕、花生粕和鱼粉等)组成,其中能量饲料成本占猪饲料总成本的很大一部分。适宜的饲粮能量水平是养猪业可持续生产的重要因素,降低猪的饲粮能量水平可能在减轻环境污染和提高经济效益方面有积极作用。
近几十年来,人们采用消化能系统和代谢能系统来评估饲粮能量水平和猪的能量需求。然而,高蛋白质或高纤维饲粮的能量水平被消化能和代谢能系统高估,高脂肪或高淀粉饲粮的能量水平被消化能和代谢能系统低估[5]。净能系统是根据动物的能量需求来评估饲粮能量水平的一种评估方法,净能系统将热增耗从代谢能系统中排除,比消化能系统和代谢能系统评估高蛋白质或高纤维饲粮的能量值更为精确[6]。因此,应用净能系统评估猪的能量需求是一种更经济的饲养策略[4]
饲粮能量水平可影响机体的生理功能、肠道微生物群和能量代谢[7]。宿主消化道中的微生物群与能量利用效率有关,肠道微生物群可以将纤维转化为短链脂肪酸(SCFAs)为机体提供能量[8]。肝脏是机体的主要代谢器官,可以控制营养物质的分配,调节从饲料营养物质中获得的能量向器官或组织的转化效率[9-10]。在育肥期,猪的蛋白质沉积低于脂肪沉积[11],这可能意味着育肥猪有更高的能量需求。然而,先前的研究表明,降低饲粮能量水平不会影响育肥猪的生长性能和胴体品质[3,12-13]。因此我们推测,在一定饲粮能量水平范围内,由于育肥猪肠道菌群和肝脏代谢的变化,低能量水平饲粮可以达到与高能量水平饲粮在育肥猪生长性能和胴体品质方面相近的效果。本研究旨在探讨饲粮净能水平对育肥猪生长性能、胴体品质、肠道形态及微生物群落和肝脏代谢的影响,为低净能水平饲粮在猪生产中的应用提供新的思路。

1 材料与方法

1.1 试验设计及饲养管理

本试验在陕西省咸阳市洛阳村养殖场进行,试验方案及动物使用经由西北农林科技大学动物研究伦理委员会批准(No.NWAFU-202207156)。
本试验将84头体重为(53.69±5.99) kg的杜×长×大三元杂交猪随机分为3组,每组7个重复,每个重复4头猪。参照NRC(2012)猪营养需要标准配制饲粮,饲粮组成及营养水平如表1所示。配制的饲粮含有相同水平的粗蛋白质(等氮),净能水平分别为10.36(高净能组,HNE组)、9.90(中净能组,MNE组)和9.44 MJ/kg(低净能组,LNE组)。试验期共63 d,分为3个阶段:第1~21天(第Ⅰ阶段)、第22~42天(第Ⅱ阶段)和第43~63天(第Ⅲ阶段)。试验采用全进全出饲养管理模式,每天观察猪只健康状态并详细记录。猪舍内保持通风,地面干燥。试验猪自由采食和饮水,每个圈舍均配有1个乳头式饮水器和1个3孔料槽。
表1 饲粮组成及营养水平(风干基础)

Table 1 Composition and nutrient levels of diets (air-dry basis) %

项目
Items
组别Groups 组别Groups 组别Groups
第1~21天Days 1 to 21 第22~42天Days 22 to 42 第43~63天Days 43 to 63
HNE MNE LNE HNE MNE LNE HNE MNE LNE
原料Ingredients
玉米Corn 71.00 62.80 54.50 74.10 64.20 54.30 77.00 66.00 55.00
豆粕Soybean meal 20.30 18.80 17.30 17.30 15.60 14.00 10.00 8.90 7.80
干酒糟Distillers dried grains 5.00 5.00 5.00 6.00 6.00 6.00 6.00 6.00 6.00
细麦麸Fine wheat bran 5.00 10.00 6.00 12.00 5.30 11.70 18.10
豆皮Bean skin 2.70 5.40 3.00 6.00 3.00 6.00
甜菜粕Sugar beet pulp 2.50 5.00 2.80 5.60 2.80 5.60
豆油Soybean oil 0.80 0.40 0.30 0.15
石粉Limestone 0.89 0.76 0.76 0.71 0.64 0.48 0.44 0.33 0.22
磷酸氢钙CaHPO4 0.47 0.45 0.42 0.20 0.17 0.14
L-赖氨酸盐酸盐L-Lys·HCl 0.32 0.34 0.35 0.26 0.28 0.30 0.23 0.23 0.23
DL-蛋氨酸DL-Met 0.08 0.09 0.10 0.04 0.05 0.06
L-苏氨酸L-Thr 0.10 0.12 0.13 0.06 0.08 0.09 0.02 0.03 0.04
L-色氨酸L-Trp 0.04 0.04 0.04 0.03 0.03 0.03 0.01 0.01 0.01
预混料Premix1) 1.00 1.00 1.00 1.00 1.00 1.00 1.00 1.00 1.00
合计Total 100.00 100.00 100.00 100.00 100.00 100.00 100.00 100.00 100.00
营养水平Nutrient levels2)
净能NE/(MJ/kg) 10.36 9.90 9.44 10.36 9.90 9.44 10.36 9.90 9.44
干物质DM 87.15 87.28 87.42 87.06 87.25 87.44 86.93 87.14 87.35
粗蛋白质CP 16.50 16.40 16.50 15.50 15.30 15.30 13.40 13.40 13.20
粗脂肪EE 4.35 3.87 3.38 4.05 3.79 3.54 3.94 3.81 3.69
粗纤维CF 3.01 4.42 5.82 3.01 4.59 6.17 3.10 4.72 6.33
钙Ca 0.75 0.74 0.74 0.56 0.58 0.60 0.45 0.44 0.45
总磷TP 0.70 0.68 0.70 0.61 0.60 0.60 0.56 0.55 0.55
可消化赖氨酸SID Lys 0.91 0.91 0.91 0.80 0.80 0.80 0.61 0.61 0.61
可消化蛋氨酸+半胱氨酸
SID Met+Cys
0.53 0.54 0.54 0.47 0.47 0.47 0.38 0.38 0.37
可消化苏氨酸SID Thr 0.60 0.60 0.60 0.53 0.53 0.53 0.40 0.40 0.41
可消化色氨酸SID Trp 0.18 0.18 0.18 0.16 0.16 0.16 0.11 0.11 0.11
可消化异亮氨酸SID Ile 0.58 0.56 0.55 0.54 0.52 0.50 0.43 0.42 0.41
可消化缬氨酸SID Val 0.67 0.65 0.64 0.63 0.62 0.60 0.53 0.52 0.52

1)预混料为每千克饲粮提供 Premix provided the following per kg of diets:VD3 1 500 IU,VA 9 600 IU,VK3 1.5 mg,VE 30 IU,VB2 4.5 mg,VB1 1.2 mg,VB12 0.024 mg,VB6 3 mg,D-泛酸 D-pantothenic acid 6 mg,烟酸 nicotinic acid 8.4 mg,生物素 biotin 0.048 mg,叶酸 folic acid 0.72 mg,Fe 72 mg,Zn 45 mg,Cu 22.5 mg,Se 0.18 mg,Mn 18 mg,I 0.375 mg。

2)干物质、粗蛋白质、粗脂肪、粗纤维、钙和总磷为测定值,净能和氨基酸为参考NRC(2012)猪营养需要所得计算值。DM, CP, EE, CF, Ca and TP were measured values, while NE and amino acids were calculated values according to nutrient requirements of swine in NRC (2012).

1.2 样品采集及指标测定

1.2.1 饲粮营养成分含量测定

饲粮中干物质、粗蛋白质、粗脂肪、粗纤维、钙和总磷的含量分别参考GB/T 6435—2014、GB/T 6432—2018、GB/T 6433—2006、GB/T 6434—2022、GB/T 6436—2018和GB/T 6437—2018中的方法进行测定。

1.2.2 生长性能

在第1、22、43和63天的早上,对所有猪空腹称重,计算各阶段的平均日增重(ADG)。每天记录每个重复的采食量,计算各阶段平均日采食量(ADFI)和料重比(F/G)。

1.2.3 胴体性状

在试验的最后1天,在每组中随机选择5头猪屠宰。屠宰后,根据《瘦肉型猪胴体性状测定技术规范》测定猪胴体重、胴体直长、胴体斜长和眼肌面积,并计算屠宰率。用游标卡尺测量胴体肩部最厚处、胸腰椎结合处和腰荐椎结合处的膘厚,计算平均背膘厚。

1.2.4 肠道形态学

屠宰后,打开腹腔,立即分离收集肠道,用生理盐水清洗十二指肠、空肠和回肠的样品。将十二指肠、空肠和回肠样品在4%多聚甲醛中固定48 h后,用蒸馏水清洗并用乙醇和二甲苯溶液脱水。将样品包埋在石蜡中,用自动切片机(HM-355S,中国)切成5 μm厚切片,进行苏木精-伊红染色,并用中性树脂密封。用显微镜(IX-73,日本)对十二指肠、空肠和回肠切片进行观察。每个切片选择6个视野,使用ImageJ软件测量绒毛高度(VH)和隐窝深度(CD),并计算VH与CD的比值(VH/CD)。

1.2.5 微生物组学分析

使用Illumina MiSeq平台对盲肠和结肠内容物中的菌群进行16S rDNA焦磷酸测序。使用上游引物515F和下游引物806R(分别为5'-ACTCCTACGGGAGCAGCAG-3'和5'-GGACTACHVGGGTWTCTAAT-3')扩增16S rDNA的V3~V4高变区。将PCR产物等比例混合后,使用Qiagen Gel Extraction Kit试剂盒(德国)纯化混合的PCR产物。纯化后的样品送至上海美吉生物医药科技有限公司进行微生物测序。测序流程包括:构建文库、文库质量评估和测序。对原始测序数据进行质量过滤和合并,使用UPARSE软件,对操作分类单元进行聚类,选出相似性97%以上的序列,利用美吉生物云平台进行菌群数据分析。

1.2.6 非靶向代谢组学分析

将50 mg肝脏冷冻样品置于1 mL含有内标物D-氯苯丙氨酸(100 ng/mL)和酮洛芬(10 ng/mL)的提取液(40%甲醇、40%乙腈和20%水)中。用高通量组织研磨机(Scientz-192,中国)研磨样品10 min。将100 μL样品溶液加入提取液(50%甲醇和50%乙腈)中超声10 min后,置于-20 ℃下20 min。随后,在4 ℃下以12 000×g离心15 min,取500 μL上清液并在真空浓缩器中干燥。用50%乙腈和50%水配制的溶液对离心后保留的沉淀物再溶解,并在4 ℃下以12 000×g离心15 min。收集120 μL上清液用于液相色谱-质谱(LC-MS)分析。LC-MS分析使用高分辨率质谱仪(Waters,美国),色谱柱为Acquity UPLC HSS T3色谱柱(2.1 mm × 100 mm, 1.8 μm)。用缓冲液A(含0.1%甲酸的超纯水)和缓冲液B(含0.1%甲酸的乙腈)洗脱。使用采集软件MassLynx V4.2获得MS/MS谱图,使用Progenesis QI软件分析原始数据,并使用内部数据库注释样品中的代谢物。

1.3 统计分析

运用SAS 9.4对数据进行单因素方差分析(one-way ANOVA),处理之间采用Tukey法进行多重比较,结果用平均值和均值标准误(SEM)表示。采用正交多项式对比确定随饲粮净能水平减少的线性和二次效应。P<0.05为差异显著,0.05≤P<0.10为有显著差异趋势。根据差异表达倍数(FC)、变量重要性投影(VIP)和P值筛选差异代谢物,FC<0.83或FC>1.20、VIP>1且P<0.05时,认定该代谢物为差异代谢物。采用Spearman相关性分析对肠道微生物群和肝脏代谢物进行相关性分析。

2 结果

2.1 饲粮净能水平对育肥猪生长性能的影响

表2所示,在第1~21天,与其他组相比,MNE组的F/G有增加趋势(P=0.050);F/G随饲粮净能水平增加呈先增加后降低的二次曲线变化(P<0.05)。在试验全期,ADG随着饲粮净能水平的增加呈线性增加(P<0.05),3组之间ADFI、ADG和F/G无显著差异(P>0.05)。
表2 饲粮净能水平对育肥猪生长性能的影响

Table 2 Effects of dietary net energy levels on growth performance of finishing pigs

项目
Items
组别Groups 均值
标准误
SEM
PP-value
HNE MNE LNE 方差分析
ANOVA
线性
Linear
二次
Quadratic
体重BW/kg
第1天体重BW on day 1 53.21 53.70 54.16 0.979 0.799 0.520 0.994
第22天体重BW at day 22 75.11 75.11 75.25 1.800 0.992 0.845 0.915
第43天体重BW at day 43 95.63 94.66 96.02 1.732 0.956 0.873 0.898
第63天体重BW on day 63 114.99 112.91 112.73 1.651 0.590 0.371 0.655
第1~21天Days 1 to 21
平均日采食量ADFI/(kg/d) 2.45 2.47 2.34 0.089 0.576 0.408 0.540
平均日增重ADG/(kg/d) 0.96 0.93 0.91 0.029 0.544 0.291 0.925
料重比F/G 2.55 2.65 2.57 0.022 0.050 0.535 0.020
第22~42天Days 22 to 42
平均日采食量ADFI/(kg/d) 2.76 2.90 2.80 0.064 0.324 0.674 0.162
平均日增重ADG/(kg/d) 0.99 0.96 0.97 0.014 0.442 0.351 0.391
料重比F/G 2.79 3.02 2.90 0.078 0.208 0.365 0.125
第43~63天Days 43 to 63
平均日采食量ADFI/(kg/d) 3.03 3.03 2.99 0.099 0.963 0.836 0.870
平均日增重ADG/(kg/d) 0.91 0.81 0.80 0.038 0.160 0.084 0.413
料重比F/G 3.32 3.73 3.78 0.179 0.222 0.120 0.463
第1~63天Days 1 to 63
平均日采食量ADFI/(kg/d) 2.75 2.80 2.71 0.067 0.659 0.733 0.415
平均日增重ADG/(kg/d) 0.95 0.90 0.89 0.016 0.085 0.042 0.353
料重比F/G 2.89 3.13 3.09 0.078 0.146 0.125 0.186

同行数据肩标无字母或相同字母表示差异不显著(P>0.05),不同小写字母表示差异显著(P<0.05)。下表同。

In the same row, values with no letter or the same letter superscripts mean no significant difference (P>0.05), while with different small letter superscripts mean significant difference (P<0.05). The same as below.

2.2 饲粮净能水平对育肥猪胴体品质的影响

表3所示,3个组之间的胴体重、屠宰率、胴体直长、胴体斜长、眼肌面积和平均背膘厚均无显著差异(P>0.05)。
表3 饲粮净能水平对育肥猪胴体品质的影响

Table 3 Effects of dietary net energy levels on carcass quality of finishing pigs

项目
Items
组别Groups 均值
标准误
SEM
PP-value
HNE MNE LNE 方差分析
ANOVA
线性
Linear
二次
Quadratic
胴体重Carcass weight/kg 88.80 86.20 88.00 3.840 0.888 0.885 0.648
屠宰率Dressing rate/% 72.01 72.05 71.93 0.005 0.989 0.924 0.914
胴体直长Carcass straight length/cm 100.86 101.82 99.64 1.435 0.575 0.559 0.389
胴体斜长Carcass oblique length/cm 85.62 85.86 86.66 1.073 0.777 0.506 0.835
眼肌面积Loin eye area/cm2 49.09 41.00 45.18 2.344 0.089 0.261 0.054
平均背膘厚Average fat thickness/mm 21.07 22.05 21.80 0.950 0.919 0.773 0.778

2.3 饲粮净能水平对育肥猪肠道形态的影响

表4所示,3组之间的十二指肠、空肠和回肠的VH、CD和VH/CD无显著差异(P>0.05)。与HNE组和MNE组相比,LNE组的十二指肠VH/CD有增加的趋势(P=0.074)。
表4 饲粮净能水平对育肥猪肠道形态的影响

Table 4 Effects of dietary net energy levels on intestinal morphology of finishing pigs

项目
Items
组别Groups 均值
标准误
SEM
PP-value
HNE MNE LNE 方差分析
ANOVA
线性
Linear
二次
Quadratic
十二指肠Duodenum
绒毛高度VH/μm 432.66 366.36 443.12 28.289 0.193 0.809 0.078
隐窝深度CD/μm 559.55 554.99 503.91 77.837 0.848 0.651 0.736
绒毛高度/隐窝深度VH/CD 0.77 0.66 0.88 0.089 0.074 0.110 0.084
空肠Jejunum
绒毛高度VH/μm 505.16 344.77 356.18 46.978 0.059 0.045 0.161
隐窝深度CD/μm 508.39 469.62 489.48 31.465 0.692 0.678 0.462
绒毛高度/隐窝深度VH/CD 1.05 0.77 0.77 0.122 0.223 0.133 0.387
回肠Ileum
绒毛高度VH/μm 517.39 433.29 480.48 29.764 0.177 0.398 0.097
隐窝深度CD/μm 295.19 287.98 317.13 39.804 0.866 0.097 0.716
绒毛高度/隐窝深度VH/CD 1.89 1.65 1.66 0.239 0.730 0.509 0.677

2.4 饲粮净能水平对育肥猪肠道微生物群落的影响

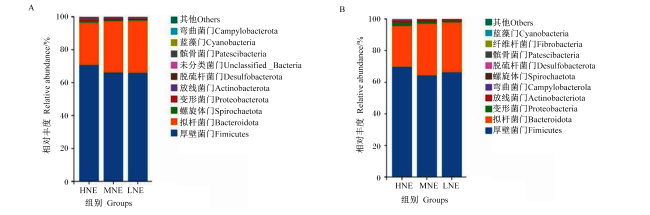
结肠和盲肠微生物群落α多样性指数如表5所示。3个组之间结肠和盲肠微生物群落的ACE、Chao1、Simpson和Shannon指数无显著差异(P>0.05),MNE组盲肠Simpson指数(P=0.054)和Shannon指数(P=0.094)有降低趋势。在门水平上,结肠和盲肠微生物群落的相对丰度如图1-A图1-B所示,厚壁菌门和拟杆菌门是3组结肠和盲肠微生物群落中的优势菌门。
表5 饲粮净能水平对育肥猪肠道微生物群落α多样性的影响

Table 5 Effects of dietary net energy levels on intestinal microbial community α-diversity of finishing pigs

项目
Items
组别Groups 均值
标准误
SEM
PP-value
HNE MNE LNE 方差分析
ANOVA
线性
Linear
二次
Quadratic
结肠Colon
Shannon指数Shannon index 7.45 7.25 7.55 0.282 0.578 0.724 0.335
Simpson指数Simpson index 0.98 0.98 0.99 0.008 0.541 0.512 0.434
Ace指数Ace index 456.40 409.50 450.90 31.670 0.307 0.852 0.112
Chao指数Chao index 456.70 411.80 451.90 30.100 0.297 0.865 0.108
盲肠Cecum
Shannon指数Shannon index 7.48 7.04 7.35 0.189 0.094 0.491 0.052
Simpson指数Simpson index 0.99 0.98 0.99 0.004 0.054 0.941 0.046
Ace指数Ace index 425.00 362.60 409.20 32.540 0.180 0.550 0.037
Chao指数Chao index 425.80 363.50 410.80 32.730 0.181 0.576 0.040
图1 饲粮净能水平对育肥猪结肠(A)和盲肠(B)微生物群落门水平相对丰度的影响

Fig.1 Effects of dietary net energy levels on relative abundances of microbial community at phylum level in colon (A) and cecum (B) of finishing pigs

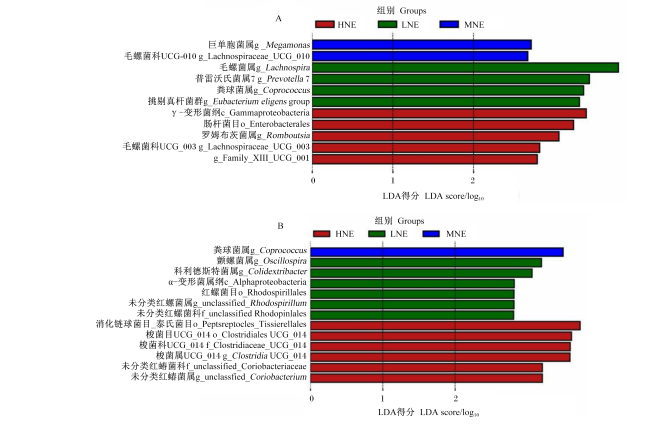
线性判别分析(LDA)效应大小(LEfSe)分析鉴定3组肠道微生物群落相对丰度有显著差异的菌(LDA阈值为2,P<0.05)。如图2-A所示,γ-变形菌纲、肠杆菌目、罗姆布茨菌属、毛螺菌科UCG_003和Family_ⅩⅢ_UCG_001在HNE组结肠微生物群落中显著富集;毛螺菌科UCG_010和巨单胞菌属在MNE组结肠微生物群落中显著富集;毛螺菌属、普雷沃氏菌属7、粪球菌属和挑剔真杆菌群在LNE组结肠微生物群落中显著富集。如图2-B所示,在盲肠微生物群落中共筛选出13种相对丰度有显著差异的菌。消化链球菌目_泰氏菌目、梭菌属UCG_014、未分类红蝽菌属在HNE组在盲肠微生物群落中显著富集;粪球菌属在MNE组盲肠微生物群落中显著富集;颤螺菌属、科利德斯特菌属和α-变形菌纲在LNE组盲肠微生物群落中显著富集。
图2 LEfSe分析结肠(A)和盲肠(B)显著富集的微生物群落

Fig.2 Significantly enriched microbial community in colon(A) and cecum(B) analyzed by LEfSe

2.5 饲粮净能水平对育肥猪肝脏代谢的影响

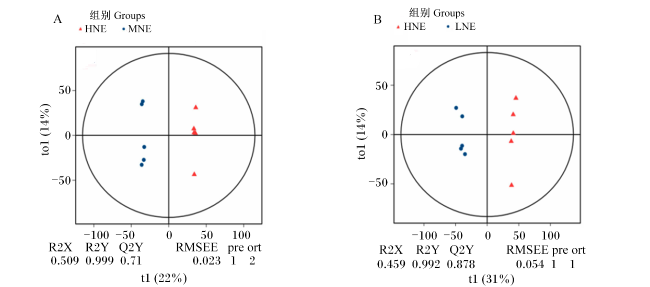
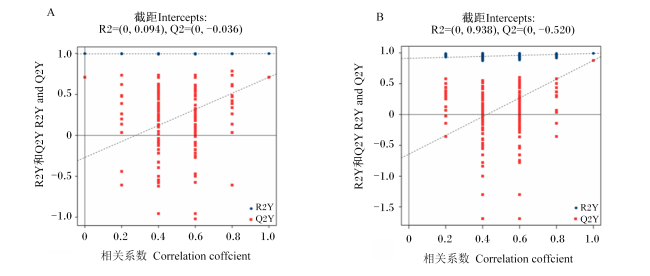
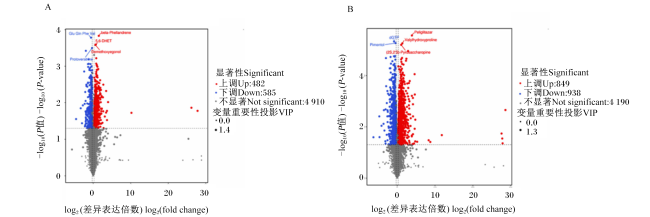
为了确定饲粮净能水平如何影响肝脏功能,本试验采用阳性和阴性模型进行代谢组学研究,来揭示饲粮净能水平对肝脏代谢物的影响。正交偏最小二乘判别分析(OPLS-DA)结果显示,HNE组和MNE组之间(图3-A)以及HNE组和LNE组之间(图3-B)肝脏代谢物有显著差异。2个OPLS-DA模型都是可靠的,没有过度拟合(图4-A4-B)。从火山图可以观察到,降低饲粮净能水平后,肝脏代谢物发生显著变化。与HNE组相比,MNE组有482个代谢物上调和585个代谢物下调(图5-A);与HNE组相比,低净能组有849种代谢物上调和938种代谢物下调(图5-B)。
图3 育肥猪肝脏代谢物OPLS-DA得分图

A:MNE组与HNE组的OPLS-DA图OPLS-DA plot in MNE group vs HNE group;B:LNE组与HNE组的OPLS-DA图OPLS-DA plot in LNE group vs HNE group。

R2X是模型对代谢物定量矩阵的解释率;R2Y是模型对样本分组矩阵的解释率;Q2Y是模型的预测能力;RMSEE是均方根误差;pre是预测组件;ort是正交分量的数量;t1代表预测分量(组间差异分量),to1代表正交分量(组内差异分量)。

Fig.3 OPLS-DA score plot of metabolites in liver of finishing pigs

R2X is the explanatory rate of the model to the metabolite quantitative matrix; R2Y is the explanatory rate of the model to the sample grouping matrix; Q2Y is the predictive ability of the model; RMSEE is the root mean square error;pre is the predictive component; ort is the number of orthogonal components.t1 represents the predicted component (the between-group difference component), and to1 represents the orthogonal component (the within-group difference component).

图4 育肥猪肝脏代谢物OPLS-DA模型置换检验图

A:MNE组与HNE组的置换检验图 permutation test plot in MNE group vs HNE group;B:LNE组与HNE组的置换检验图permutation test plot in LNE group vs HNE group。

R2Y是模型对样本分组矩阵的解释率;Q2Y是模型的预测能力。

Fig.4 OPLS-DA permutation test plot of metabolites in liver of finishing pigs

R2Y is the explanatory rate of the model to the sample grouping matrix; Q2Y is the predictive ability of the model.

图5 育肥猪肝脏差异代谢物火山图

A:MNE组与HNE组的差异代谢物火山图volcano plot of differential metabolites in MNE group vs HNE group;B:LNE组与HNE组的差异代谢物火山图volcano plot of differential metabolites in LNE group vs HNE group。

图中蓝色的点代表下调差异表达代谢物,红色的点代表上调差异表达代谢物,灰色代表检测到但差异不显著的代谢物。

Fig.5 Volcano plot of differential metabolites in liver of finishing pigs

The blue dots in the figure represent down-regulated differentially expressed metabolites, the red dots represent up-regulated differentially expressed metabolites, and the gray dots represent detected metabolites with no significant difference.

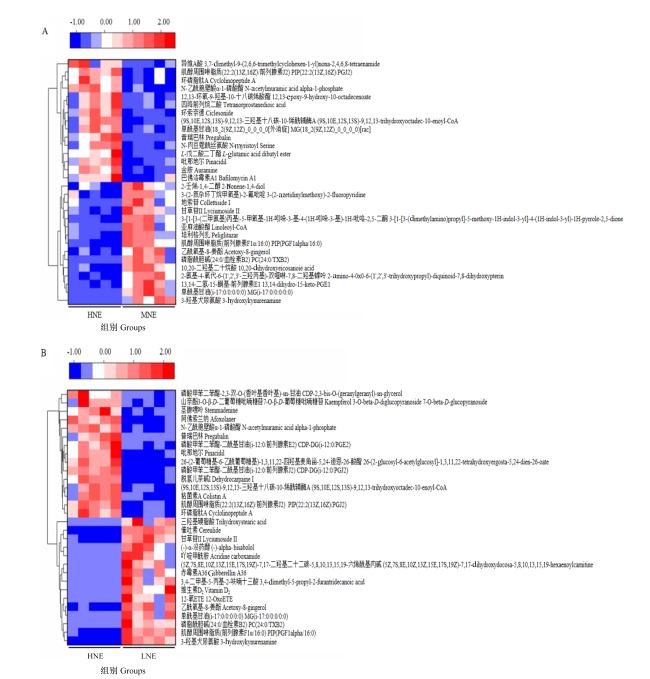
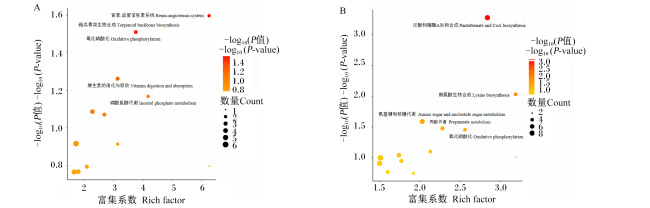
HNE组和MNE组之间以及HNE组和LNE组之间的前30种差异代谢物分别如图6-A图6-B所示(VIP>1和P<0.05)。与HNE组相比,MNE组和LNE组中与脂质和类脂分子相关的代谢物含量显著提高,例如赤霉素A36、维生素D2、甘草苷Ⅱ等。色氨酸代谢的中间产物3-羟基犬尿氨酸含量在MNE组和LNE组中显著提高。进一步分析差异代谢物的涉及相关代谢途径,与HNE组相比,MNE组肾素-血管紧张素系统、萜类骨架生物合成、氧化磷酸化、维生素消化和吸收以及磷酸肌醇代谢等相关途径发生显著变化(图7-A);与HNE组相比,LNE组泛酸和辅酶A生物合成、赖氨酸生物合成、氨基糖和核糖代谢、丙酸代谢和氧化磷酸化等相关代谢途径发生显著变化(图7-B)。
图6 育肥猪肝脏差异代谢物热图

A:HNE组与MNE组间前30种差异代谢物热图 heat map of top 30 metabolites in HNE group vs MNE group;B:HNE组与LNE组间前30种差异代谢物热图heat map of top 30 metabolites in HNE group vs LNE group。

Fig.6 Heat map of liver differential metabolites of finishing pigs

图7 育肥猪肝脏差异代谢物KEGG富集通路分析

A:HNE组与MNE组KEGG途径富集分析Enrichment analysis of KEGG pathways in HNE group vs MNE group;B:HNE组与LNE组KEGG途径富集分析Enrichment analysis of KEGG pathways in HNE group vs LNE group。

Fig.7 KEGG enrichment pathway analysis of liver differential metabolites of finishing pigs

2.6 肠道微生物群落与肝脏代谢物的相关性

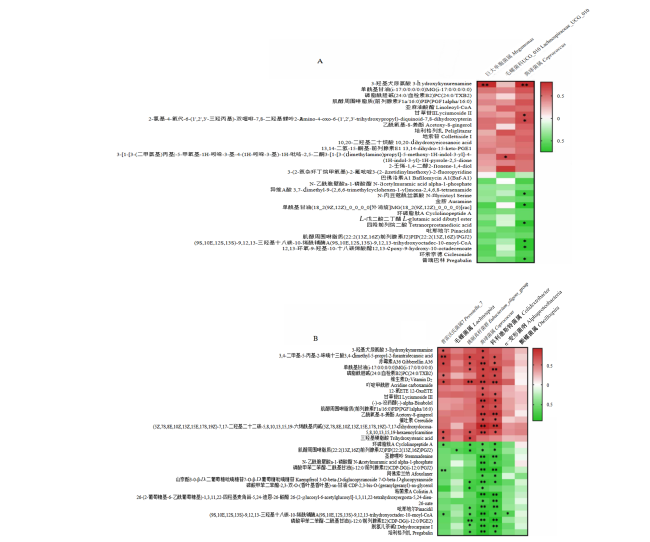
为了研究肠道微生物群落和肝脏代谢物之间的关系,将在MNE组显著富集的菌群和MNE组较HNE组发生显著改变的前30种肝脏代谢物进行了Spearman相关性分析(图8-A),将在LNE组显著富集的菌群和LNE组较HNE组发生显著改变的前30种肝脏代谢物进行相关性分析(图8-B)。结肠粪球菌属和盲肠科利德斯特菌属相对丰度分别与LNE组较HNE组发生显著改变的前30种肝脏代谢物中的29种和26种差异代谢物含量呈显著相关(P<0.05),而与毛螺菌属、α-变形菌纲和颤螺菌属相对丰度呈显著相关的差异代谢物数量极少。
图8 肠道微生物群落和肝脏代谢物的Spearman相关性分析

A:MNE组较HNE组显著变化的菌群和肝脏代谢物的相关性分析correlation analysis of significantly changed gut microbiota and liver metabolites in MNE group vs HNE group;B:LNE组较HNE组显著变化的菌群和肝脏代谢物的相关性分析correlation analysis of significantly changed gut microbiota and liver metabolites in LNE group vs HNE group。*表示P<0.05,**表示P<0.01。* indicated P<0.05, ** indicated P<0.01.

Fig.8 Spearman correlation analysis of gut microbial community and liver metabolites

在MNE组和LNE组较HNE组发生显著改变的前30种差异代谢物中存在11种变化趋势相同的差异代谢物。在MNE组和LNE组中3-羟基犬尿氨酸含量均与粪球菌属相对丰度呈显著正相关(P<0.05)。单酰基甘油(i-17∶0/0∶0/0∶0)、磷脂酰胆碱(24∶0/血栓素B2)、肌醇周围啉脂质(前列腺素F1α/16∶0)、N-乙酰胞壁酸α-1-磷酸酯和肌醇周围啉脂质(22∶2(13Z,16Z)/前列腺素J2)这5种脂质化合物含量,与3种MNE组富集的微生物相对丰度无显著相关(P>0.05);单酰基甘油(i-17∶0/0∶0/0∶0)、磷脂酰胆碱(24∶0/血栓素B2)、肌醇周围啉脂质(前列腺素F1α/16∶0)含量与LNE组结肠粪球菌属和盲肠科利德斯特菌属相对丰度呈显著正相关(P<0.05),N-乙酰胞壁酸α-1-磷酸酯和肌醇周围啉脂质(22∶2(13Z,16Z)/前列腺素J2)含量与LNE组结肠粪球菌属和盲肠科利德斯特菌属相对丰度呈显著负相关(P<0.05)。吡那地尔这种离子通道激活剂含量,与3种MNE组富集的微生物相对丰度无显著相关(P>0.05),与LNE组结肠挑剔真杆菌群、结肠粪球菌属和盲肠科利德斯特菌属相对丰度呈显著负相关(P<0.05)。

3 讨论

3.1 饲粮净能水平对育肥猪生长性能的影响

研究表明,当饲粮能量水平足以满足生长育肥猪的能量需求时,提高饲粮能量水平对生长性能没有显著影响[14-15]。本试验与Hong等[13]之前研究结果一致,2个饲粮代谢能组(14.08和13.66 MJ/kg)之间ADG、ADFI和F/G无显著差异。在本研究中,HNE组、MNE组和LNE组育肥猪的ADG、ADFI和F/G无显著差异。Ha等[3]的研究表明,饲喂高消化能、中消化能和低消化能(14.22、13.39和12.55 MJ/kg)饲粮后,育肥猪的ADG和F/G无显著差异,而中消化能饲粮组的ADFI高于其他组。本研究结果表明,在ADFI没有显著差异的情况下,育肥猪的ADG随着饲粮净能水平的降低而降低,这可能是由于猪需要从饲粮中获得足够的能量来满足生长的要求。在本试验条件下,适当降低饲粮能量水平对育肥猪的生长性能没有负面影响。

3.2 饲粮净能水平对育肥猪胴体品质的影响

由于胴体品质会影响经济效益[16-17],因此本研究评估了不同净能水平饲粮对胴体品质的影响。在本研究中,MNE组和LNE组与HNE组相比,屠宰率无显著差异。Ha等[3]的研究表明,高消化能组、中消化能组和低消化能组(14.22、13.39和12.55 MJ/kg)的育肥猪屠宰率无显著差异。Hinson等[12]研究也表明,饲喂3种代谢能水平饲粮(14.80、14.09和13.88 MJ/kg)的猪屠宰率无显著差异。育肥猪的体脂组成和脂肪沉积率随着每日消化能摄入量的增加呈线性或二次增加[18],腰眼面积与猪的背部脂肪和胴体瘦肉率有着重要联系[19-20]。在本研究中,3组的胴体肩部最厚处、胸腰椎结合处和腰荐椎结合处的脂肪厚度无显著差异,MNE组和LNE组的猪腰眼面积有降低的趋势。在本试验饲粮净能水平范围(9.44~10.36 MJ/kg)内,适当降低饲粮能量水平对育肥猪的胴体品质没有负面影响。

3.3 饲粮净能水平对育肥猪肠道形态的影响

VH、CD和VH/CD是评价动物肠道营养物质吸收效率的重要指标。为了提高营养利用效率,通常根据猪的营养需求调整饲粮,例如改变饮食能量、蛋白质或纤维水平等[21]。仔猪十二指肠和空肠的VH随饲粮粗蛋白质水平降低而降低[22-23],而饲粮纤维水平可以影响VH[24]。Jin等[25]的研究报道,在相同的饲粮代谢能水平(13.64 MJ/kg)下,10%麦秸高纤维饲粮组的空肠VH显著高于不含麦秸的低纤维饲粮组。本试验结果表明,饲粮净能水平降低不影响育肥猪的肠道形态,但空肠的VH随饲粮净能水平降低呈线性下降趋势,这可能是由于试验第Ⅲ阶段的低蛋白质水平与高纤维水平对VH的作用相反。

3.4 饲粮净能水平对育肥猪肠道微生物群落的影响

肠道微生物群落在调节宿主代谢中起着至关重要的作用[26]。本研究结果表明,巨单胞菌属和毛螺菌科UCG_010在MNE组结肠中显著富集。在肥胖个体中,巨单胞菌属的相对丰度增加,并且巨单胞菌属与代谢性肥胖有关[27-28]。巨单胞菌属可以激活P461-PWY代谢途径产生乙酸盐,促进甘油三酯的积累[29-30]。毛螺菌属的所有成员都表现出很强的水解活性[31]。毛螺菌属可以利用饲粮中的菊粉、淀粉和阿拉伯木聚糖产生丁酸盐和其他短链脂肪酸[32]。此外,本研究结果表明粪球菌属在MNE组盲肠和LNE组结肠中显著富集。粪球菌属是评估消化道健康的微生物生物标志物[33]。粪球菌属可以利用碳水化合物产生丁酸盐[34-35]。丁酸盐具有广泛的药理活性,如抗炎、抗氧化、抗肥胖和调节代谢途径,产丁酸盐的肠道微生物相对丰度提高有益于宿主健康[36]。在本试验条件下,降低饲粮净能水平可以提高巨单胞菌属、毛螺菌科和粪球菌属相对丰度,有利于乙酸盐和丁酸盐的产生,减少机体炎症。

3.5 饲粮净能水平对育肥猪肝脏代谢的影响

本研究结果表明,降低饲粮净能水平可以显著改变育肥猪的肝脏代谢。与HNE组相比,MNE组与能量代谢相关的氧化磷酸化和磷酸肌醇代谢发生显著改变。肌醇脂质及其衍生物在信号传导中起着重要作用[37]。磷酸肌醇代谢的相关代谢物参与机体能量稳态、抗炎和抗氧化等生理过程[38]。高能量饮食可诱导氧化应激、DNA损伤和肝脏炎症[39]。MNE组相较于HNE组饲粮净能水平降低,可能通过肌醇磷酸代谢途径减轻机体氧化应激和炎症。与MNE组较HNE组发生改变的能量代谢途径数量相比,LNE组较HNE组发生改变的能量代谢途径数量更多,例如泛酸和辅酶A生物合成、氨基糖和核糖代谢、丙酸代谢和氧化磷酸化。
肠道微生物群落产生的脂肪酸、氨基酸和吲哚可通过血液到达器官或组织[40]。色氨酸可以被肠道微生物群落转化为吲哚及其衍生物,例如吲哚丙烯酸、吲哚-3-醛和吲哚-3-酸-乙酸[41]。肠道微生物群落可以通过催化色氨酸分解的限速酶吲哚胺2,3-双加氧酶调节炎症和免疫反应[42],吲哚胺2,3-双加氧酶可以利用活性氧来调节细胞内的氧化还原平衡。本研究相关分析结果表明,色氨酸代谢的中间产物3-羟基犬尿氨酸含量与巨单胞菌属、粪球菌属和普雷沃氏菌属7的相对丰度呈正相关。大约95%的游离色氨酸通过犬尿氨途径代谢,其代谢产物参与炎症、免疫反应和兴奋性神经传递等生理过程[43]。因此,降低饲粮中净能水平可能减少氧化应激和炎症反应。

4 结论

在本试验饲粮净能水平范围(9.44~10.36 MJ/kg)内,降低饲粮净能水平,不影响育肥猪的生长性能、胴体品质和肠道形态,可以优化肠道菌群结构,改善肝脏能量代谢,提高能量利用效率。
[1]
JONGBLOED A W, LENIS N P. Alteration of nutrition as a means to reduce environmental pollution by pigs[J]. Livestock Production Science, 1992, 31(1/2):75-94.

[2]
PAIK I K. Strategies to reduce environmental pollution from animal manure:nutritional management option[J]. Asian-Australasian Journal of Animal Sciences, 1999, 12(4):657-666.

[3]
HA D M, KIM G D, HAN J C, et al. Effects of dietary energy level on growth efficiency and carcass quality traits of finishing pigs[J]. Journal of Animal Science and Technology, 2010, 52(3):191-198.

[4]
HU Q L, SHI H W, WANG L, et al. Mitigating environmental impacts using net energy system in feed formulation in China’s pig production[J]. Science of the Total Environment, 2023, 856(Pt 1):159103.

[5]
NOBLET J, FORTUNE H, SHI X S, et al. Prediction of net energy value of feeds for growing pigs[J]. Journal of Animal Science, 1994, 72(2):344-354.

DOI PMID

[6]
LI Z C, LIU H, LI Y K, et al. Methodologies on estimating the energy requirements for maintenance and determining the net energy contents of feed ingredients in swine:a review of recent work[J]. Journal of Animal Science and Biotechnology, 2018, 9:39.

[7]
WANG B T, KONG Q M, LI X, et al. A High-fat diet increases gut microbiota biodiversity and energy expenditure due to nutrient difference[J]. Nutrients, 2020, 12(10):3197.

[8]
BLAUT M. Gut microbiota and energy balance: role in obesity[J]. Proceedings of the Nutrition Society, 2015, 74(3):227-234.

[9]
RUI L Y. Energy metabolism in the liver[J]. Comprehensive Physiology, 2014, 4(1):177-197.

DOI PMID

[10]
SHIMIZU N, MARUYAMA T, YOSHIKAWA N, et al. A muscle-liver-fat signalling axis is essential for central control of adaptive adipose remodelling[J]. Nature Communications, 2015, 6:6693.

DOI PMID

[11]
WHITTEMORE C T. The science and practice of pig production[J]. Zivocisna Vyroba, 1996, 41(3):144-144.

[12]
HINSON R B, WIEGAND B R, RITTER M J, et al. Impact of dietary energy level and ractopamine on growth performance,carcass characteristics,and meat quality of finishing pigs[J]. Journal of Animal Science, 2011, 89(11):3572-3579.

[13]
HONG J S, LEE G I, JIN X H, et al. Effect of dietary energy levels and phase feeding by protein levels on growth performance,blood profiles and carcass characteristics in growing-finishing pigs[J]. Journal of Animal Science and Technology, 2016, 58:37.

[14]
CROMWELL G V H, FIGUEROA V T, KEMP A J. Effects of dietary protein and energy levels for growing-finishing swine on performance,muscle composition and eating quality of pork[J]. Journal of Animal Science, 1978, 47(2):505-513.

[15]
MATTHEWS J O, HIGBIE A D, SOUTHERN L L, et al. Effect of chromium propionate and metabolizable energy on growth, carcass traits,and pork quality of growing-finishing pigs[J]. Journal of Animal Science, 2003, 81(1):191-196.

[16]
ČOBANOVIĆN, STAJKOVIĆ S, BLAGOJEVIĆ B, et al. The effects of season on health, welfare,and carcass and meat quality of slaughter pigs[J]. International Journal of Biometeorology, 2020, 64(11):1899-1909.

[17]
WANG Z B, ZENG X L, ZHANG C, et al. Higher niacin intakes improve the lean meat rate of Ningxiang pigs by regulating lipid metabolism and gut microbiota[J]. Frontiers in Nutrition, 2022, 9:959039.

[18]
LIU F, BREWSTER C J, GILMOUR S L, et al. Relationship between energy intake and growth performance and body composition in pigs selected for low backfat thickness[J]. Journal of Animal Science, 2021, 99(12):skab342.

[19]
FRIESEN K G, NELSSEN J L, GOODBAND R D, et al. The effect of dietary lysine on growth,carcass composition,and lipid metabolism in high-lean growth gilts fed from 72 to 136 kilograms[J]. Journal of Animal Science, 1995, 73(11):3392-3401.

[20]
CHO S B, KIM D W, BAEK K H, et al. Effects of dietary energy intake levels on growth performance and body composition of finishing barrows and gilts[J]. Asian-Australasian Journal of Animal Sciences, 2008, 21(10):1516-1521.

[21]
POMAR C, ANDRETTA I, REMUS A. Feeding strategies to reduce nutrient losses and improve the sustainability of growing pigs[J]. Frontiers in Veterinary Science, 2021, 8:742220.

[22]
YU D F, ZHU W Y, HANG S Q. Effects of long-term dietary protein restriction on intestinal morphology,digestive enzymes,gut hormones,and colonic microbiota in pigs[J]. Animals, 2019, 9(4):180.

[23]
YU D F, ZHU W Y, HANG S Q. Effects of low-protein diet on the intestinal morphology,digestive enzyme activity,blood urea nitrogen,and gut microbiota and metabolites in weaned pigs[J]. Archives of Animal Nutrition, 2019, 73(4):287-305.

[24]
HEDEMANN M S, ESKILDSEN M, LÆRKE H N, et al. Intestinal morphology and enzymatic activity in newly weaned pigs fed contrasting fiber concentrations and fiber properties[J]. Journal of Animal Science, 2006, 84(6):1375-1386.

DOI PMID

[25]
JIN L, REYNOLDS L P, REDMER D A, et al. Effects of dietary fiber on intestinal growth, cell proliferation,and morphology in growing pigs[J]. Journal of Animal Science, 1994, 72(9):2270-2278.

[26]
ZHAI Z Y, LIU J P, NIU K M, et al. Integrated metagenomics and metabolomics to reveal the effects of policosanol on modulating the gut microbiota and lipid metabolism in hyperlipidemic C57BL/6 mice[J]. Frontiers in Endocrinology, 2021, 12:722055.

[27]
DUAN M M, WANG Y Z, ZHANG Q, et al. Characteristics of gut microbiota in people with obesity[J]. PLoS One, 2021, 16(8):e0255446.

[28]
ZHOU J L, ZHANG Q, ZHAO Y Z, et al. The relationship of Megamonas species with nonalcoholic fatty liver disease in children and adolescents revealed by metagenomics of gut microbiota[J]. Scientific Reports, 2022, 12(1):22001.

[29]
WEITKUNAT K, STUHLMANN C, POSTEL A, et al. Short-chain fatty acids and inulin, but not guar gum, prevent diet-induced obesity and insulin resistance through differential mechanisms in mice[J]. Scientific Reports, 2017, 7(1):6109.

[30]
CHU H K, DUAN Y, YANG L, et al. Small metabolites, possible big changes:a microbiota-centered view of non-alcoholic fatty liver disease[J]. Gut, 2019, 68(2):359-370.

[31]
VACCA M, CELANO G, CALABRESE F M, et al. The controversial role of human gut Lachnospiraceae[J]. Microorganisms, 2020, 8(4):573.

[32]
O SHERIDAN P, MARTIN J C, LAWLEY T D, et al. Polysaccharide utilization loci and nutritional specialization in a dominant group of butyrate-producing human colonic Firmicutes[J]. Microbial Genomics, 2016, 2(2):e000043.

[33]
LOUIS P, FLINT H J. Diversity, metabolism and microbial ecology of butyrate-producing bacteria from the human large intestine[J]. FEMS Microbiology Letters, 2009, 294(1):1-8.

DOI PMID

[34]
PRYDE S E, DUNCAN S H, HOLD G L, et al. The microbiology of butyrate formation in the human colon[J]. FEMS Microbiology Letters, 2002, 217(2):133-139.

DOI PMID

[35]
NOGAL A, LOUCA P, ZHANG X Y, et al. Circulating levels of the short-chain fatty acid acetate mediate the effect of the gut microbiome on visceral fat[J]. Frontiers in Microbiology, 2021, 12:711359.

[36]
AMIRI P, HOSSEINI S A, GHAFFARI S, et al. Role of butyrate,a gut microbiota derived metabolite,in cardiovascular diseases:a comprehensive narrative review[J]. Frontiers in Pharmacology, 2021, 12:837509.

[37]
IRVINE R F. A short history of inositol lipids[J]. Journal of Lipid Research, 2016, 57(11):1987-1994.

PMID

[38]
VUCENIK I. Anticancer properties of inositol hexaphosphate and inositol:an overview[J]. Journal of Nutritional Science and Vitaminology, 2019, 65:S18-S22.

[39]
YANG S L, XIA J H, ZHANG Y Y, et al. Hyperinsulinemia shifted energy supply from glucose to ketone bodies in early nonalcoholic steatohepatitis from high-fat high-sucrose diet induced Bama minipigs[J]. Scientific Reports, 2015, 5:13980.

[40]
FENG W W, AO H, PENG C. Gut microbiota,short-chain fatty acids,and herbal medicines[J]. Frontiers in Pharmacology, 2018, 9:1354.

[41]
ALEXEEV E E, LANIS J M, KAO D J, et al. Microbiota-derived indole metabolites promote human and murine intestinal homeostasis through regulation of interleukin-10 receptor[J]. American Journal of Pathology, 2018, 188(5):1183-1194.

DOI PMID

[42]
CLARKE G, GRENHAM S, SCULLY P, et al. The microbiome-gut-brain axis during early life regulates the hippocampal serotonergic system in a sex-dependent manner[J]. Molecular Psychiatry, 2013, 18(6):666-673.

DOI PMID

[43]
STONE T W, STOY N, DARLINGTON L G. An expanding range of targets for kynurenine metabolites of tryptophan[J]. Trends in Pharmacological Sciences, 2013, 34(2):136-143.

DOI PMID

Outlines

/