

1 材料与方法
1.1 试验材料
1.2 试验设计与饲养管理
表1 各组灌服溶质质量Table 1 Mass of solute administered by each group |
| 组别Groups | 处理Treatment | 溶质质量Solute mass/[mg/(只·d)] |
|---|---|---|
| CON | 35 mL生理盐水 | |
| ASP | 将黄芪多糖溶于35 mL生理盐水 | 1.0 |
| EPS-L | 将乳酸菌胞外多糖溶于35 mL生理盐水 | 0.5 |
| EPS-M | 将乳酸菌胞外多糖溶于35 mL生理盐水 | 1.0 |
| EPS-H | 将乳酸菌胞外多糖溶于35 mL生理盐水 | 2.0 |
表2 羔羊开食料组成及营养水平(风干基础)Table 2 Composition and nutrient levels of the starter feed (air-dry basis) % |
| 项目Items | 含量Content | ||
|---|---|---|---|
| 原料Ingredients | |||
| 玉米Corn | 53.00 | ||
| 豆粕Soybean meal | 33.00 | ||
| 小麦麸Wheat bran | 5.50 | ||
| 菜籽粕Cottonseed meal | 5.00 | ||
| 石粉Limestone | 1.50 | ||
| 磷酸氢钙CaHPO4 | 0.50 | ||
| 氯化钠NaCl | 0.50 | ||
| 预混料Premix | 1.00 | ||
| 合计Total | 100.00 | ||
| 营养水平Nutrient levels2) | |||
| 干物质DM | 86.82 | ||
| 粗蛋白质CP | 21.26 | ||
| 粗脂肪EE | 2.82 | ||
| 粗纤维CF | 3.61 | ||
| 钙Ca | 0.80 | ||
| 磷P | 0.53 | ||
| 代谢能ME/(MJ/kg) | 13.29 |
1)预混料为每千克开食料提供The premix provided the following per kg of the starter feed:VA 4 500 IU,VD 600 IU,VE 40 IU,Zn 80 mg,Mn 50 mg,Fe 50 mg,I 0.75 mg,Co 0.65 mg,Se 0.25 mg。 2)代谢能参照《中国饲料成分及营养价值表(2020年第31版)》进行计算,干物质(GB/T 6435—2014)、粗蛋白质(GB/T 3462—2018)、粗脂肪(GB/T 6433—2006)、粗纤维(GB/T 3434—2022)、钙(GB/T 6436—2018)、磷(GB/T 6437—2018)参照相应的国标方法进行测定。ME was calculated according to Tables of Feed Composition and Nutritive Values in China (thirty-first edition, 2020), while DM (GB/T 6435—2014), CP(GB/T 3462—2018), EE (GB/T 6433—2006), CF (GB/T 3434—2022), Ca (GB/T 6436—2018) and P (GB/T 6437—2018) were measured according to corresponding national standard methods. |
1.3 大肠杆菌攻毒试验
1.4 样本采集
1.4.1 血液样本采集及血清、血浆分离
1.4.2 胃肠道内容物样本采集
1.4.3 试验羔羊体重数据记录
1.5 指标检测与方法
1.5.1 血清抗氧化指标测定
1.5.2 血浆细胞因子和免疫球蛋白含量测定
1.5.3 瘤胃内容物挥发性脂肪酸浓度测定
1.5.4 胃肠道内容物微生物宏基因组测序
1.6 数据处理与分析
2 结果与分析
2.1 乳酸菌胞外多糖对羔羊血液指标的影响
表3 各组羔羊的血清抗氧化指标及血浆细胞因子和免疫球蛋白含量Table 3 Serum antioxidant indexes and plasma cytokine and immunoglobulin contents of lambs in different groups |
| 项目 Items | 组别Groups | 均值 标准误 SEM | P值P-value | ||||||
|---|---|---|---|---|---|---|---|---|---|
| CON | ASP | EPS-L | EPS-M | EPS-H | 处理 Treatment | 采血时间 Time of blood sampling | 处理× 采血时间 Treatment× time of blood sampling | ||
| 丙二醛 MDA/(nmol/mL) | 1.19 | 1.43 | 1.42 | 1.66 | 1.58 | 0.095 | 0.761 | 0.001 | 0.353 |
| 超氧化物歧化酶 SOD/(U/mL) | 71.87 | 69.23 | 72.50 | 69.95 | 72.74 | 0.534 | 0.072 | <0.001 | 0.068 |
| 过氧化氢酶 CAT/(U/L) | 17.83 | 21.21 | 19.86 | 19.49 | 20.20 | 1.379 | 0.947 | 0.002 | 0.663 |
| 总抗氧化能力 T-AOC/(U/mL) | 25.57 | 26.76 | 23.95 | 26.01 | 25.36 | 0.735 | 0.848 | <0.001 | 0.314 |
| 谷胱甘肽过氧化物酶 GSH-Px/(U/mL) | 0.07bc | 0.09abc | 0.10ab | 0.07c | 0.11a | 0.004 | 0.042 | <0.001 | 0.008 |
| 白细胞介素-1β IL-1β/(pg/mL) | 54.98 | 54.75 | 56.36 | 55.95 | 55.09 | 0.326 | 0.206 | <0.001 | 0.089 |
| 白细胞介素-4 IL-4/(pg/mL) | 39.46 | 39.00 | 39.08 | 38.06 | 39.06 | 0.165 | 0.774 | <0.001 | 0.680 |
| 白细胞介素-6 IL-6/(pg/mL) | 150.91 | 150.19 | 150.45 | 148.34 | 151.18 | 0.357 | 0.974 | <0.001 | 0.235 |
| 皮质醇 COR/(ng/mL) | 138.15 | 136.37 | 136.45 | 139.58 | 138.80 | 0.747 | 0.332 | <0.001 | 0.677 |
| γ-干扰素 IFN-γ/(pg/mL) | 635.07 | 625.18 | 630.71 | 615.05 | 627.57 | 1.797 | 0.697 | <0.001 | 0.617 |
| 肿瘤坏死因子-α TNF-α/(pg/mL) | 130.65b | 131.60b | 134.41a | 127.80c | 133.09ab | 0.395 | 0.049 | <0.001 | 0.536 |
| 免疫球蛋白G IgG/(mg/mL) | 62.10 | 61.27 | 59.14 | 59.46 | 60.72 | 0.391 | 0.147 | <0.001 | 0.858 |
| 免疫球蛋白M IgM/(μg/mL) | 1 238.41 | 1 209.31 | 1 238.10 | 1 202.15 | 1 267.27 | 5.989 | 0.118 | <0.001 | 0.062 |
| 免疫球蛋白A IgA/(μg/mL) | 313.16 | 312.71 | 311.46 | 306.47 | 313.60 | 1.055 | 0.912 | <0.001 | 0.907 |
同行数据肩标无字母或相同小写字母表示差异不显著(P>0.05),不同小写字母表示差异显著(P≤0.05),不同大写字母表示差异极显著(P≤0.01)。下表同。 | |
In the same row, vales with no letter or the same lowercase letter superscripts mean no significant difference (P>0.05), while with different lowercase letter superscripts mean significant difference (P≤0.05), and with different capital letter superscripts mean extremely significant difference (P≤0.01). The same as below. |
2.2 大肠杆菌攻毒处理下乳酸菌胞外多糖对羔羊瘤胃内容物pH和挥发性脂肪酸浓度的影响
表4 各组羔羊瘤胃内容物pH和挥发性脂肪酸浓度Table 4 pH and volatile fatty acid concentrations in rumen content of lambs in different groups |
| 项目 Items | 组别Groups | 均值标准误 SEM | P值 P-value | ||
|---|---|---|---|---|---|
| CON | ASP | EPS-H | |||
| pH | 5.85 | 5.80 | 6.15 | 0.324 | 0.222 |
| 乙酸Acetate/(mmol/L) | 46.01 | 58.30 | 50.62 | 3.261 | 0.340 |
| 丙酸Propionate/(mmol/L) | 12.04 | 10.03 | 10.22 | 0.492 | 0.188 |
| 异丁酸Isobutyrate/(mmol/L) | 0.53 | 0.43 | 0.60 | 0.046 | 0.366 |
| 丁酸Butyrate/(mmol/L) | 6.91 | 6.82 | 7.30 | 0.451 | 0.922 |
| 异戊酸Isovaleric/(mmol/L) | 0.51 | 0.33 | 0.44 | 0.046 | 0.303 |
| 戊酸Valproic/(mmol/L) | 0.39 | 0.39 | 0.33 | 0.032 | 0.734 |
| 己酸Hexanoic/(mmol/L) | 0.02a | 0.15b | 0.04a | 0.024 | 0.043 |
| 乙酸/丙酸Acetate/propionate | 3.81b | 5.81a | 4.92ab | 0.335 | 0.017 |
| 总挥发性脂肪酸TVFA/(mmol/L) | 66.42 | 76.45 | 69.55 | 3.818 | 0.613 |
2.3 大肠杆菌攻毒处理下乳酸菌胞外多糖对羔羊胃肠道微生物多样性的影响
2.3.1 下机原始数据质控及统计
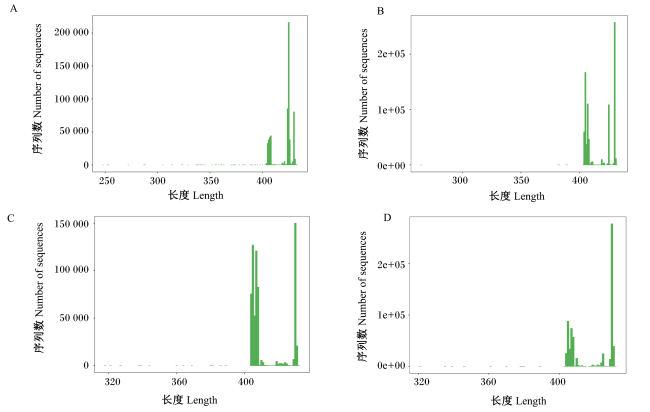
2.3.2 各样本微生物α多样性分析
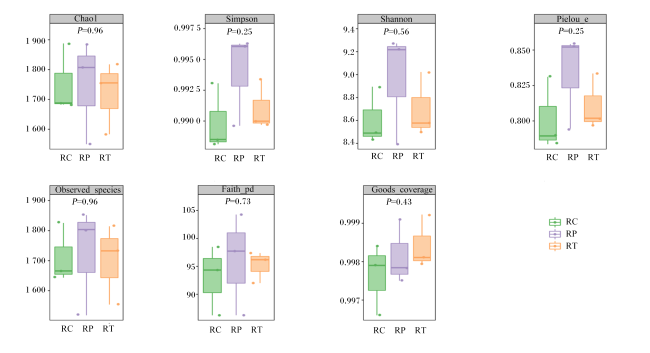
图2 各组瘤胃样本的微生物α多样性指数箱线图RC为CON组瘤胃样本,RP为ASP组瘤胃样本,RT为EPS-H组瘤胃样本。 Fig.2 Box plots of microbial α diversity indexes for rumen samples from different groups RC is the rumen sample of CON group, RP is the rumen sample of ASP group, and RT is the rumen sample of ESP-H group. |
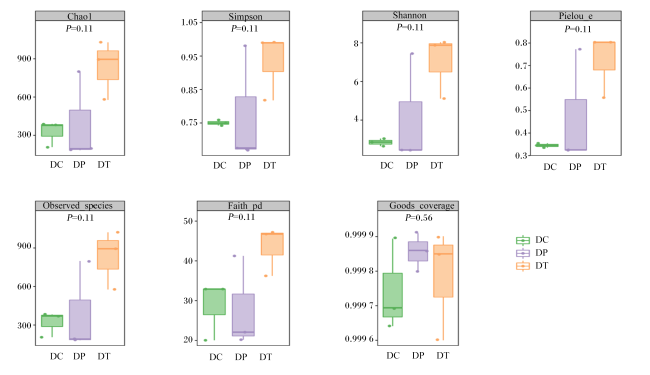
图3 各组十二指肠样本的微生物α多样性指数箱线图DC为CON组十二指肠样本,DP为ASP组十二指肠样本,DT为EPS-H组十二指肠样本。 Fig.3 Box plots of microbial α diversity indexes for duodenum samples from different groups DC is the duodenum sample of CON group, DP is the duodenum sample of ASP group, and DT is the duodenum sample of ESP-H group. |
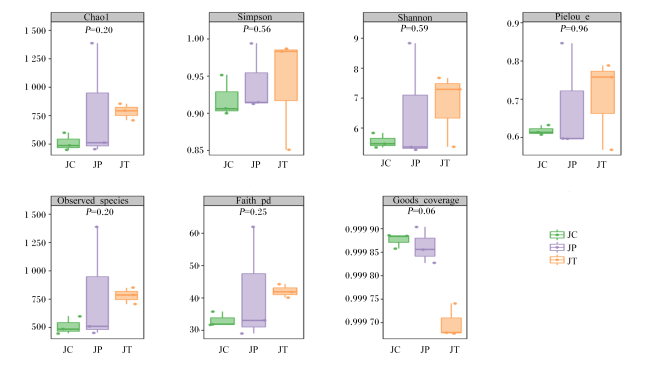
图4 各组空肠样本的微生物α多样性指数箱线图JC为CON组空肠样本,JP为ASP组空肠样本,JT为EPS-H组空肠样本。 Fig.4 Box plots of microbial α diversity indexes for jejunum samples from different groups JC is the jejunum sample of CON group, JP is the jejunum sample of ASP group, and JT is the jejunum sample of ESP-H group. |
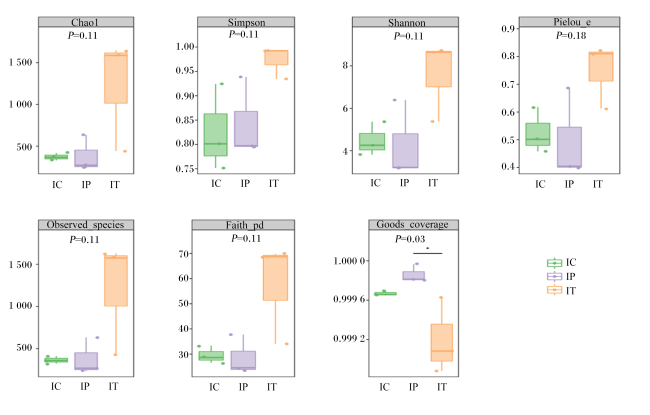
2.3.3 各样本微生物差异分析与标志微生物筛选
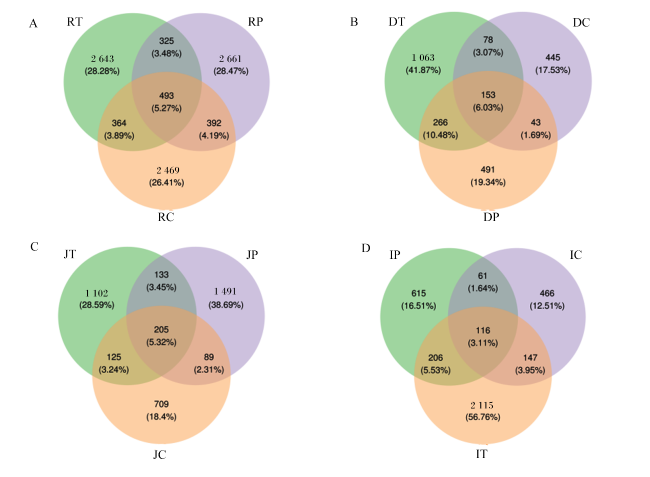
图6 各样本微生物有效序列数量韦恩图A为各组瘤胃样本韦恩图,图中RC为CON组,RP为ASP组,RT为EPS-H组。B为各组十二指肠样本韦恩图,图中DC为CON组,DP为ASP组,DT为EPS-H组。C为各组空肠样本韦恩图,图中JC为CON组,JP为ASP组,JT为EPS-H组。D为各组回肠样本韦恩图,图中IC为CON组,IP为ASP组,IT为EPS-H组。 Fig.6 Venn diagrams of effective sequence quantity for microbes of each sample A is the Venn diagram of rumen samples from different groups, in the figure, RC is CON group, RP is ASP group, and RT is ESP-H group. B is the Venn diagram of duodenum samples, in the figure, DC is CON group, DP is ASP group, and DT is ESP-H group. C is the Venn diagram of jejunum samples, in the figure, JC is CON group, JP is ASP group, and JT is ESP-H group. D is the Venn diagram of ileum samples, in the figure, IC is CON group, IP is ASP group, and IT is ESP-H group. |
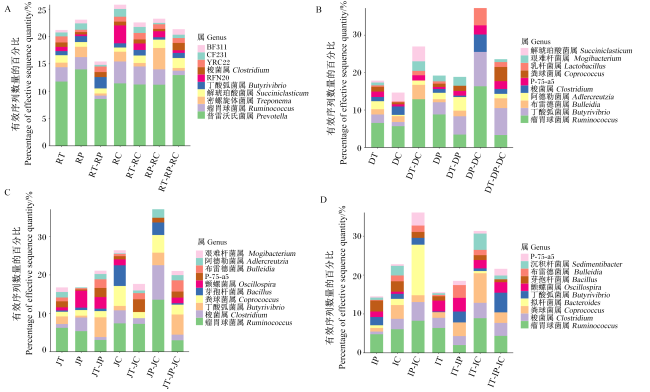
图7 各样本微生物属水平有效序列数量柱状图A、B、C、D分别为瘤胃、十二指肠、空肠、回肠样本微生物属水平有效序列数量统计。图中横坐标为对应韦恩图中不同区域的有效序列集合,纵坐标为属于不同属的微生物有效序列数量的百分比。横坐标中RC、DC、JC和IC表示CON组独有的,RP、DP、JP和IP表示ASP组独有的,RT、DT、JT和IT表示EPS-H组独有,RT-RP、DT-DP、JT-JP和IT-IP表示EPS-H组与ASP组共有的,RT-RC、DT-DC、JT-JC和IT-IC表示EPS-H组与CON组共有的,RP-RC、DP-DC、JP-JC和IP-IC表示ASP组与CON组共有的,RT-RP-RC、DT-DP-DC、JT-JP-JC和IT-IP-IC为EPS-H组、ASP组和CON组3组共有的。不同分类单元以不同颜色标识。 Fig.7 Bar charts of effective sequence quantity of microbes at genus level in each sample A, B, C and D are effective sequence quantity statistics of microbes at genus level in rumen, duodenum, jejunum and ileum samples, respectively. In figures, the horizontal axis represents the effective sequence sets corresponding to different regions of the Venn diagram, and the vertical axis represents the percentage of effective sequence quantity belonging to different genera. In the horizontal axis, RC, DC, JC and IC represent unique to the CON group; RP, DP, JP and IP represent those unique to the ASP group; RT, DT, JT and IT represent those unique to the EPS-H group; RT-RP, DT-DP, JT-JP and IT-IP represent those shared by the EPS-H group and the ASP group; RT-RC, DT-DC, JT-JC and IT-IC represent those shared by the EPS-H group and the CON group; RP-RC, DP-DC, JP-JC and IP-IC represent those shared by the ASP group and the CON group; RT-RP-RC, DT-DP-DC, JT-JP-JC and IT-IP-IC represent those shared by the EPS-H group, the ASP group and the CON group. Different classification units are marked with different colors. |
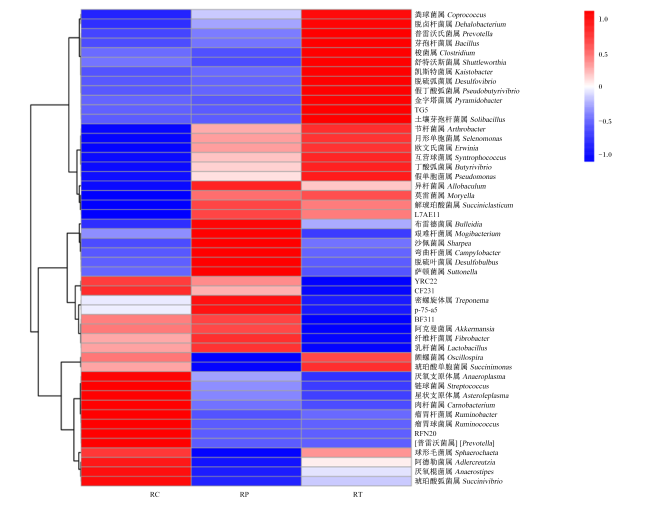
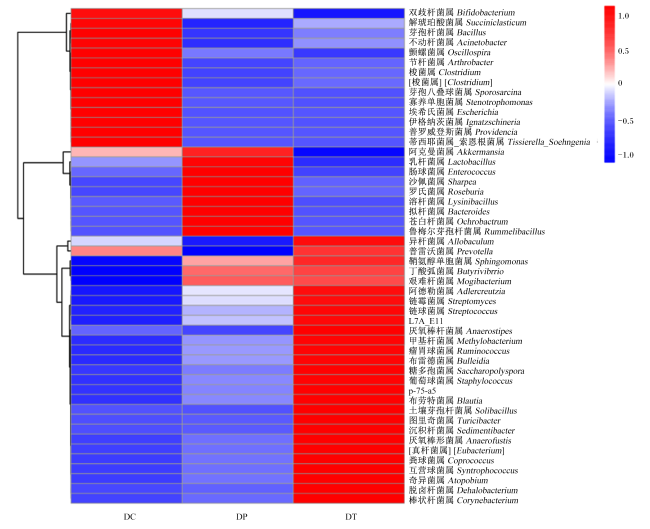
图9 十二指肠样本微生物属水平物种组成热图Fig.9 Heat maps of species composition of microbes at genus level in duodenum sample |
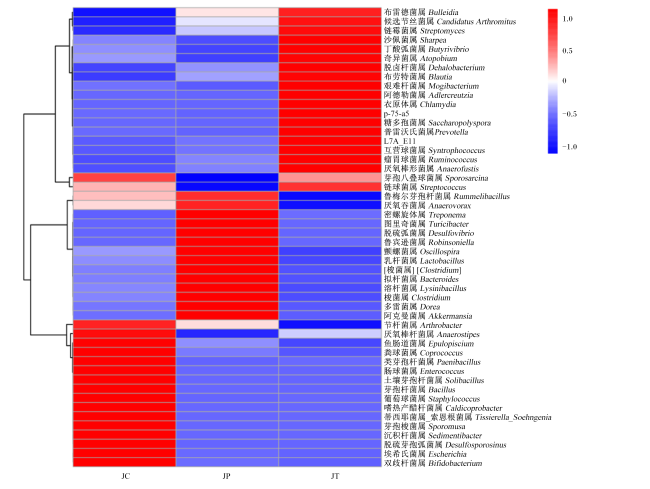
图10 空肠样本微生物属水平物种组成热图Fig.10 Heat maps of species composition of microbes at genus level in jejunum sample |
2.3.4 标志微生物代谢通路预测
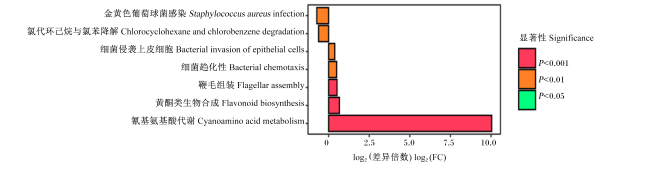
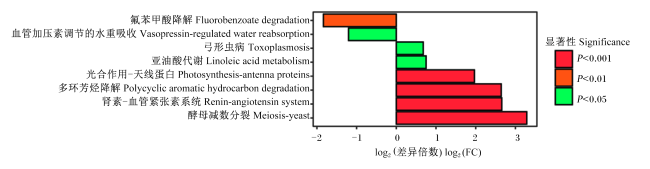
图13 瘤胃样本中EPS-H组和CON组之间差异KEGG代谢通路图横坐标log2(差异倍数)正值代表EPS-H组相对CON组上调,负值为下调,纵坐标为不同的KEGG代谢通路标签。以不同颜色展示显著性程度。图14、图15和图16同。 Fig.13 KEGG metabolic pathway diagram of differences between EPS-H group and CON group in rumen sample The positive value of log(FC) on the horizontal axis represents the up-regulation of EPS-H group compared with CON group, while the negative value represents the down-regulation. The vertical axis represents different KEGG metabolic pathway labels. Display the degree of significance in different colors. The same as Fig.14, Fig.15 and Fig.16. |
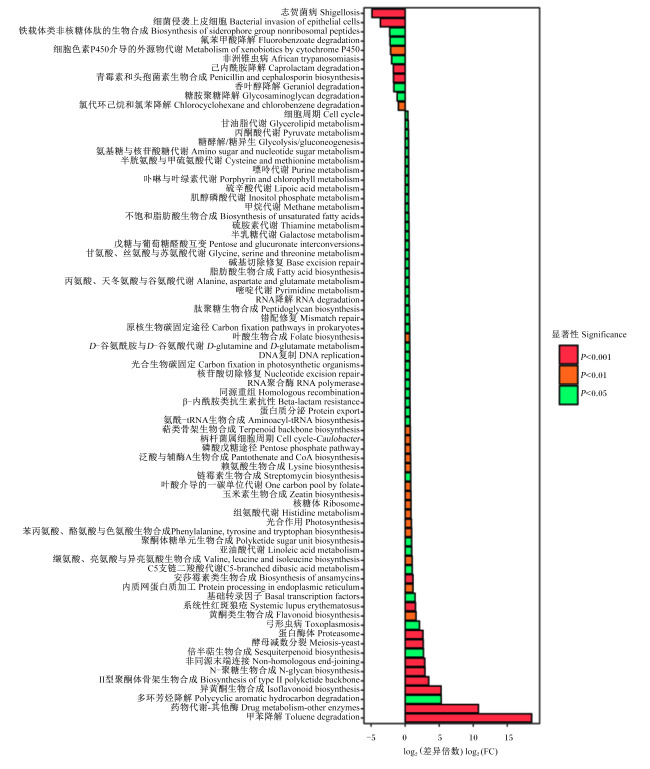
图14 十二指肠样本中EPS-H组和CON组之间差异KEGG代谢通路图Fig.14 KEGG metabolic pathway diagram of differences between EPS-H group and CON group in duodenum sample |
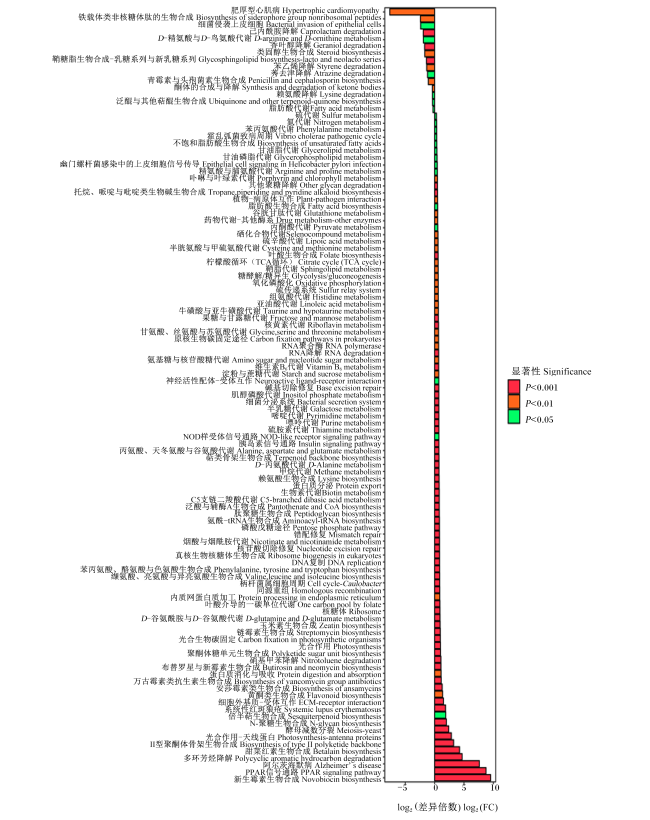
图15 空肠样本中EPS-H组和CON组之间差异KEGG代谢通路图Fig.15 KEGG metabolic pathway diagram of differences between EPS-H group and CON group in jejunum sample |


2.4 各组羔羊体重数据
表5 各组羔羊体重数据Table 5 Body weight data of lambs in different groups kg |
| 项目 Items | 组别Groups | 均值标准误 SEM | P值 P-value | ||||
|---|---|---|---|---|---|---|---|
| CON | ASP | EPS-L | EPS-M | EPS-H | |||
| 初始体重IBW | 6.09 | 6.88 | 6.98 | 7.94 | 7.46 | 0.311 | 0.430 |
| 终末体重FBW | 15.12c | 17.41bc | 16.46c | 19.42ab | 20.44a | 0.487 | <0.001 |